Memory Management Internals
Objective:
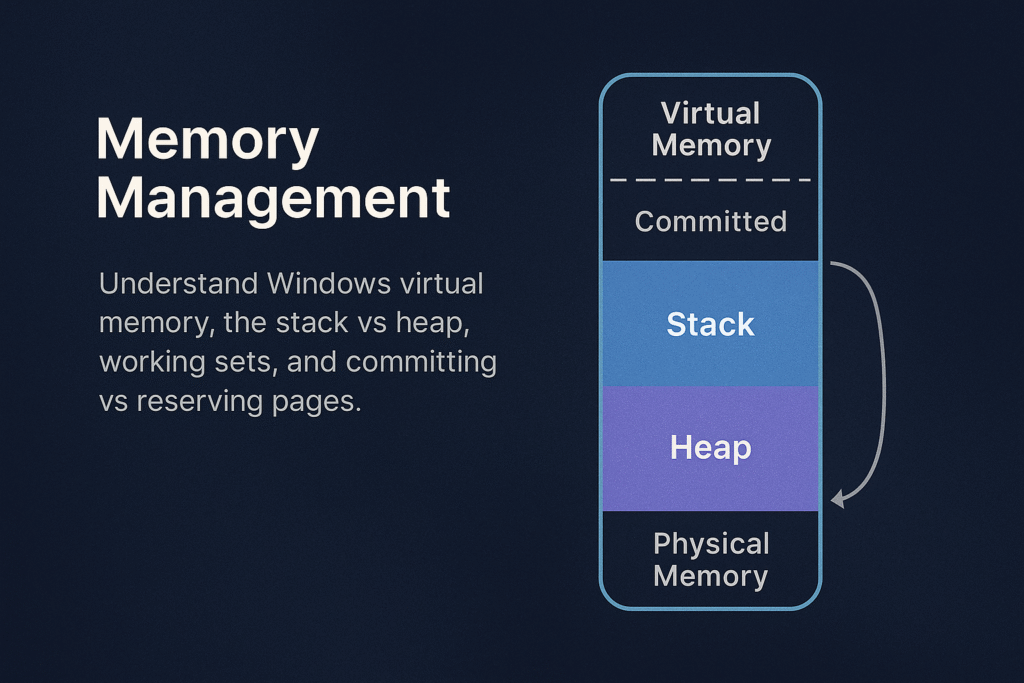
Understand the internal architecture and functionality of Windows memory management, including virtual memory, physical memory mappings, distinctions between stack and heap allocations, and memory management concepts such as working sets, committed versus reserved memory. This knowledge is essential for reverse engineering, exploit development, malware analysis, and system performance optimization.
Contents
- 1 Introduction
- 2 Memory Management Overview
- 3 Virtual Memory Layout
- 4 Stack vs Heap
- 5 Working Sets
- 6 Commit vs Reserve
- 7 Paging and Page Tables
- 8 Memory Protection & Permissions
- 9 Heap Internals
- 10 Stack Internals
- 11 Memory Management APIs & Tools
- 12 Malware and Exploit Use Cases
- 13 Memory Forensics & Detection
- 14 Summary
- 15 Related Tutorials
- 16 References
Introduction
Windows uses advanced virtual memory management to efficiently handle application and system memory. Understanding how Windows manages memory—from virtual addresses to physical memory mappings—enables better performance tuning, troubleshooting memory leaks, analyzing malware behaviors, and performing memory-based exploit development.
Memory Management Overview
Windows memory management involves:
- Virtual Address Space (VAS)
- Physical Memory (RAM)
- Paging and Page Tables
- Heap and Stack allocations
- Working Sets
- Commit and Reserve
Virtual Memory Layout
Each Windows process has a unique virtual address space, typically:
- User-mode space: Lower addresses (e.g., 0x00000000–0x7FFFFFFF on 32-bit; 0x0000000000000000–0x00007FFFFFFF on 64-bit)
- Kernel-mode space: Higher addresses (e.g., 0x80000000–0xFFFFFFFF on 32-bit; 0xFFFF800000000000–0xFFFFFFFFFFFFFFFF on 64-bit)
x64 Windows Layout:
+------------------------------+ 0xFFFFFFFFFFFFFFFF
| Kernel-mode space |
+------------------------------+ 0xFFFF800000000000
| Unused |
+------------------------------+ 0x00007FFFFFFFFFFF
| User-mode space |
+------------------------------+ 0x0000000000000000
Stack vs Heap
Applications allocate memory using two main methods: Stack and Heap.
Stack
- LIFO (Last In, First Out) data structure.
- Used for function calls, local variables, return addresses.
- Fixed-size, determined at thread creation (default ~1MB/thread).
- Stack overflow occurs when usage exceeds allocated stack space.
Example stack allocation (automatic):
int foo() {
 int a = 10; // Stack allocated
 return a;
}
Heap
- Flexible, dynamically-sized region.
- Managed explicitly by
malloc(),HeapAlloc(),new,VirtualAlloc(). - Fragmentation can occur over time.
Example heap allocation (manual):
int* arr = (int*)malloc(10 * sizeof(int));Working Sets
The Working Set is a set of physical memory pages currently used by a process.
- Windows tracks per-process working sets.
- Working sets dynamically change based on usage.
- Windows trims working sets under memory pressure.
Use Task Manager or Process Explorer to examine Working Sets:
- Private Working Set: memory exclusive to a process.
- Shareable Working Set: memory shared between processes.
Inspect via PowerShell:
Get-Process | Select Name, WorkingSet, PagedMemorySize, PrivateMemorySizeCommit vs Reserve
When an application allocates virtual memory, Windows allows two different states:
Reserved Memory
- Reservation of virtual address range without allocating physical memory or paging file.
- Not usable until committed.
- Used to ensure contiguous memory availability for future use.
Committed Memory
- Backed by physical RAM or paging file.
- Usable immediately by applications.
- Counts against system commit limit.
Example (C++):
// Reserve virtual memory
LPVOID reserved = VirtualAlloc(NULL, 4096, MEM_RESERVE, PAGE_READWRITE);

// Commit reserved memory
LPVOID committed = VirtualAlloc(reserved, 4096, MEM_COMMIT, PAGE_READWRITE);
Paging and Page Tables
Windows uses paging to map virtual addresses to physical addresses.
- Page size typically 4KB.
- Uses Multi-level page tables (x64: PML4 → PDPT → PD → PT).
- On access violation (page fault), Windows loads the requested page from disk if available (paging).
Example of Page Fault Handling:
- A program references an address not in RAM.
- CPU raises a page fault.
- Windows kernel fetches the page from disk or allocates memory.
- Instruction is retried.
Memory Protection & Permissions
Each page has memory protection attributes:
PAGE_EXECUTE_READWRITE: executable, readable, writable (often abused by malware)PAGE_READONLY: read-onlyPAGE_NOACCESS: no access permitted
Example memory permission change:
DWORD oldProtect;
VirtualProtect(address, size, PAGE_EXECUTE_READWRITE, &oldProtect);
Heap Internals
Windows provides several heaps per process:
- Default Process Heap: created automatically at startup (
GetProcessHeap()). - Private Heaps: created explicitly (
HeapCreate()).
Heap allocations are tracked via internal heap structures:
- Heap headers: track size, flags.
- Heap fragmentation: caused by frequent allocations/deallocations.
Tools like WinDbg or !heap extension allow analysis of heap internals:
!heap -s ; Summary of heaps
!heap -h 0xAddr ; Analyze specific heap
Stack Internals
- Each thread gets its own stack.
- Stack grows downward (high → low addresses).
- Stack Pointer (
ESP/RSP) tracks current stack top.
Typical stack frame (x64):
+------------------------+
| Local Variables |
+------------------------+
| Saved Registers |
+------------------------+
| Return Address |
+------------------------+
| Function Parameters |
+------------------------+
Memory Management APIs & Tools
Common Memory APIs:
| Function | Purpose |
|---|---|
VirtualAlloc | Reserve/commit virtual pages |
VirtualFree | Release/decommit memory |
HeapAlloc | Allocate heap memory |
HeapFree | Free heap memory |
RtlAllocateHeap | NT heap allocation API |
Memory Analysis Tools:
- VMMap: Detailed virtual memory analysis.
- RAMMap: Physical memory usage inspection.
- Process Hacker: Real-time memory allocation inspection.
- WinDbg: In-depth debugging and analysis.
Malware and Exploit Use Cases
| Technique | Abuse Scenario |
|---|---|
| Heap Spray | Preparing predictable memory layout for exploitation |
| Stack Overflow | Overwriting return addresses for RCE |
| ROP Gadgets | Executing chained snippets of legitimate code in stack |
| Code Injection | Allocating executable memory (PAGE_EXECUTE_READWRITE) |
| Shellcode Loading | Using VirtualAlloc/VirtualProtect to execute payloads |
Memory Forensics & Detection
- Use Volatility Framework for memory forensics:
volatility -f memory.dmp pslist
volatility -f memory.dmp malfind- Monitor abnormal allocations (
PAGE_EXECUTE_READWRITEpages) with Sysmon:
Sysmon Event ID 10 (ProcessAccess)Summary
- Windows manages memory through complex virtual-to-physical mapping.
- Stack is used for automatic, function-local allocations.
- Heap handles dynamic memory, manually managed by developers.
- Working Sets optimize performance and memory efficiency.
- Commit and Reserve control memory usage strategy.
- Understanding these internals enables effective memory forensics, exploit development, and performance tuning.
Related Tutorials
- Access Tokens and Privileges: The Kernel’s Security Context
- SIDs and Security Descriptors: Identity in Windows Security
- Fibers: User-Mode Cooperative Threads
- Jobs and Silos: Process Grouping and Resource Limits
- Windows Scheduler Internals: Priority Levels, Quantum, and Thread Selection
References
- Memory Management (Win32 Apps) — Microsoft Learn
- Windows Kernel-Mode Memory Manager — Microsoft Learn (Windows Drivers)
- Virtual Memory Functions — Microsoft Learn (Win32 Apps)
- Memory Management for Windows Drivers — Microsoft Learn
- Process Injection (T1055) — MITRE ATT&CK Enterprise
- OS Credential Dumping: LSASS Memory (T1003.001) — MITRE ATT&CK Enterprise
Get new drops in your inbox
Windows internals, exploit dev, and red-team write-ups — no spam, unsubscribe anytime.