Understanding the Stack: Frames, Prologue/Epilogue, and Stack Layout
Objective: Understand how the call stack is organized in x86 and x64 Windows processes — the mechanics of stack frames, function prologue/epilogue sequences, calling conventions, shadow space, and the exact memory layout a debugger reveals — so you can recognize a healthy stack versus a corrupted one and reason precisely about stack-based exploitation and its defenses.
1. Why the Stack Matters for Exploit Development
The stack is the primary battleground for classic memory-safety bugs. Saved return addresses, saved frame pointers, function arguments, and fixed-size local buffers all live side by side on the same contiguous, downward-growing region. When a write runs past the end of a stack buffer, it corrupts the very control-flow data the CPU will trust on the next RET.
For a defender, the same knowledge is diagnostic. A return address pointing into the stack or heap instead of an executable image, an RSP value that jumped thousands of bytes (a stack pivot), or a frame chain that no longer links cleanly are all signatures of corruption. You cannot recognize an abnormal stack until you have internalized a normal one.
2. The Stack as a Data Structure: Growth Direction and Address Space Layout
A Windows process virtual address space holds the mapped image (.text, .data), loaded DLLs, the heap, thread stacks, and per-thread/per-process control structures (TEB/PEB). Each thread receives its own stack, reserved and committed on demand.
The stack grows downward — toward lower addresses. PUSH decrements the stack pointer; POP increments it. The live top of the stack is always tracked by RSP (x64) / ESP (x86).
| Register | Role |
|---|---|
RSP / ESP | Stack pointer — always points to the top (lowest address) of the current frame |
RBP / EBP | Base/frame pointer — anchors the frame in x86; in x64 not used for locals/args unless alloca() is used |
RIP / EIP | Instruction pointer — saved as the return address by CALL |
RAX | Integer/pointer return value (XMM0 for floating-point) |
3. x86 Stack Frames: Registers, Calling Conventions, and the EBP Chain
32-bit Windows supports several co-existing calling conventions, which is why x86 reversing requires you to identify the convention before reading arguments.
| Convention | Cleanup | Argument Passing |
|---|---|---|
__cdecl | Caller cleans | Right-to-left on stack |
__stdcall | Callee cleans | Right-to-left on stack (Win32 API) |
__fastcall | Callee cleans | First two in ECX/EDX, rest on stack |
__thiscall | Callee cleans | C++ this in ECX, args on stack |
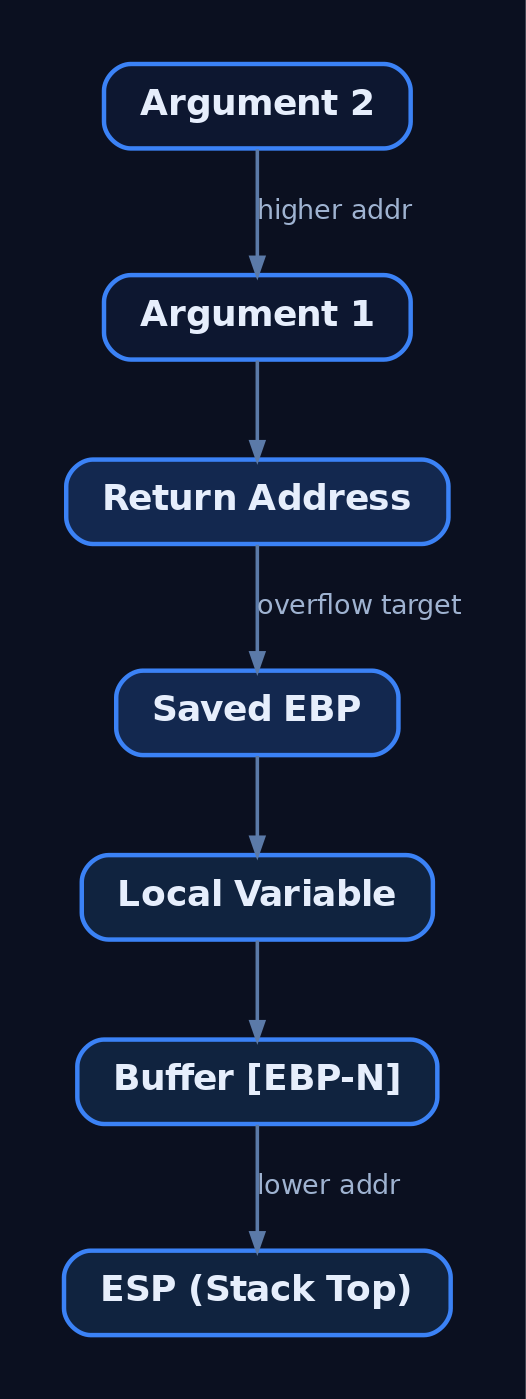
x86 code conventionally uses EBP as a fixed frame anchor. Every local and argument is addressed relative to it, and each saved EBP points at the caller’s saved EBP, forming a walkable frame chain.
// MSVC x86, compiled /Od (no optimization)
void vuln(char *src) {
    char buf[64];      // local buffer — classic overflow target
    strcpy(buf, src);  // bounded only by src
}
; x86 frame for vuln(), high → low address
push ebp ; save caller's EBP
mov ebp, esp ; EBP anchors this frame
sub esp, 64 ; allocate buf[64]
; ... strcpy ...
; [EBP + 8] -> arg1 (src)
; [EBP + 4] -> return address ← ret-overwrite target
; [EBP + 0] -> saved EBP ← frame chain link
; [EBP - 64] -> buf ← overflow originA buffer overflow that walks upward from [EBP-64] crosses the saved EBP, then the return address — the two values the epilogue and RET consume.
4. x64 Stack Frames: The Windows ABI and Shadow Space
The Windows x64 ABI consolidates every x86 convention into a single calling convention. The first four integer or pointer parameters pass in RCX, RDX, R8, R9; the first four floating-point parameters in XMM0–XMM3. Additional arguments spill onto the stack.
Two rules dominate the x64 layout:
- Shadow space (home space): The caller allocates 32 bytes immediately above the return address, regardless of how many parameters are actually used. The callee may dump
RCX/RDX/R8/R9into this home space if it needs to spill them. - 16-byte alignment:
RSPmust be 16-byte aligned at aCALL. BecauseCALLpushes an 8-byte return address,RSPis16n+8before the call and16n-aligned on entry to the callee.
Critically, x64 functions typically address locals and arguments RSP-relative, leaving RSP constant for the body of the function. RBP is freed for general use unless alloca() is present.
[High address — caller's frame]
  Stack arg 5+      ← [RSP + 0x28+]
  Shadow [R9]       ← [RSP + 0x20]
  Shadow [R8]       ← [RSP + 0x18]
  Shadow [RDX]      ← [RSP + 0x10]
  Shadow [RCX]      ← [RSP + 0x08]   (relative to callee entry)
  Return Address    ← [RSP + 0x00]   ← ret-overwrite target
  Local variables   ← [RSP - N]
[Low address — grows downward]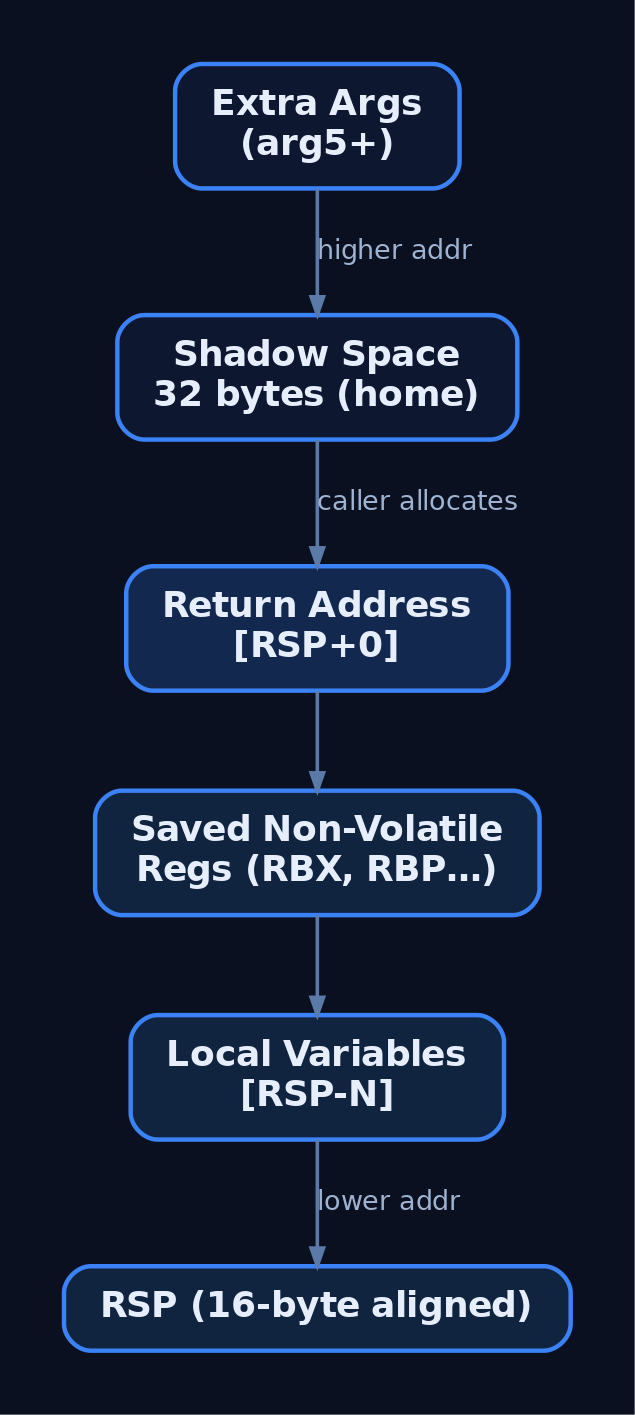
5. Volatile vs. Non-Volatile Registers and Leaf Functions
The x64 convention splits the register file into volatile (caller-saved) and non-volatile (callee-saved). A function that clobbers a non-volatile register must save and restore it in its prologue/epilogue.
| Class | Registers |
|---|---|
| Volatile (caller-saved) | RAX, RCX, RDX, R8–R11, XMM0–XMM5 |
| Non-volatile (callee-saved) | RBX, RBP, RDI, RSI, R12–R15, XMM6–XMM15 |
A leaf function changes no non-volatile register (including not altering RSP by calling out). A non-leaf function calls another function — which adjusts RSP — and therefore must establish a frame and register unwind data. This distinction drives whether the compiler emits a prologue and .pdata entry at all.
6. Prologue and Epilogue Deep Dive
The prologue establishes the frame: save callee-saved registers and reserve local space. The epilogue reverses it and returns.
; x86 epilogue
mov  esp, ebp      ; free locals
pop  ebp           ; restore caller's EBP
ret                ; pop return address → EIP
LEAVE is a single instruction equivalent to mov esp, ebp + pop ebp, available on both x86 and x64.
; x64 MASM (ml64) non-leaf frame
sub  rsp, 0x28     ; 0x20 shadow + 8 align pad
; ... body uses [rsp+0x..] for locals/spills ...
add  rsp, 0x28     ; deallocate
ret                ; pop return address → RIP
Many optimized x64 functions omit push rbp entirely and address everything from RSP. Frame Pointer Omission (FPO) saves two instructions and frees RBP as a general register; GCC/Clang do this by default at -O2, and MSVC does similarly with /O2. For exploitation this matters: without a frame pointer there is no [EBP+4] anchor for the return address — offsets must be computed from RSP at a known instruction.
__declspec(noinline) int callee(int a, int b, int c, int d) {
    int local = a + b + c + d;   // forces a real frame + homing
    return local;
}
int caller(void) { return callee(1, 2, 3, 4); }
Compile this on Godbolt or step it in WinDbg to watch RCX/RDX/R8/R9 home into shadow space.
7. Unwind Data and Structured Exception Handling
x64 Windows requires every non-leaf function to register unwind data in the PE .pdata and .xdata sections so the OS can walk frames during structured exception handling. Each function publishes a RUNTIME_FUNCTION and an associated UNWIND_INFO that describes the prologue.
typedef struct _RUNTIME_FUNCTION {
    ULONG BeginAddress;
    ULONG EndAddress;
    ULONG UnwindData;   // RVA to UNWIND_INFO
} RUNTIME_FUNCTION, *PRUNTIME_FUNCTION;
RtlVirtualUnwind() consumes this data to reconstruct caller frames without a frame pointer. For defenders, intact, parseable unwind data is what lets EDR and crash tooling produce a reliable call stack; ROP chains and stack pivots frequently produce stacks that fail to unwind cleanly — itself a detectable anomaly.
8. Reading Stack Frames in a Debugger
In WinDbg or x64dbg you read the live frame directly off RSP.
bp mymodule!vuln        ; break at the function
g                       ; run to it
dps rsp L10             ; dump 16 pointer-sized stack slots
r rsp, rbp, rip         ; show live pointers
k                       ; walk the call stack (uses unwind data)
dps rsp L10 prints the raw stack; the slot at [RSP+0x08] after entry (or the top after the prologue) holds the saved return address, which k resolves to module!function+offset. A return address that resolves to no module — or to the stack itself — is the first sign of a hijacked frame.
9. How Stack Overflows Corrupt Frame Integrity
Overflowing a fixed local buffer writes past its bounds toward higher addresses, in the direction of the saved frame pointer and the return address.
# Conceptual layout arithmetic — NOT a payload.
# 64-byte buffer sitting below the saved return address.
import struct

buf_size      = 64
saved_rbp     = 8          # x86: 4
ret_addr_slot = 8          # x86: 4
offset_to_ret = buf_size + saved_rbp   # bytes before reaching the return slot

print(f"bytes before saved frame ptr: {buf_size}")
print(f"bytes before return address : {offset_to_ret}")
When execution reaches RET, the CPU pops whatever now sits in the return slot into RIP/EIP and jumps there. A controlled overwrite places a valid, attacker-chosen address (a gadget or function); an uncontrolled overwrite leaves garbage, producing an immediate access violation. The distinction matters operationally: uncontrolled corruption crashes loudly (WER dump), while a precise overwrite can transfer control silently — which is exactly why the compiler inserts a guard between the buffer and the return address.

10. Modern Mitigations and What They Change About the Layout
Mitigations alter the frame layout or the trust placed in it; none remove the need to understand the stack.
// /GS inserts a cookie between locals and the saved frame data.
void vuln(char *src) {
    char buf[64];
    // prologue: mov rax, __security_cookie; xor rax, rsp; mov [rsp+0x..], rax
    strcpy(buf, src);
    // epilogue: mov rcx, [rsp+0x..]; xor rcx, rsp; call __security_check_cookie
}| Mitigation | Structural Effect |
|---|---|
/GS stack cookie | __security_cookie placed between locals and saved return address; mismatch → __report_gsfailure |
| DEP / NX | IMAGE_DLLCHARACTERISTICS_NX_COMPAT; stack pages non-executable, blocking on-stack shellcode |
| ASLR | IMAGE_DLLCHARACTERISTICS_DYNAMIC_BASE; randomizes stack/image base, breaking hardcoded addresses |
| Control Flow Guard | IMAGE_GUARD_CF_INSTRUMENTED; validates indirect call targets |
| Intel CET Shadow Stack | CETCOMPAT mitigation; read-only shadow copy of return addresses defeats classic ret-overwrites |
11. Common Attacker Techniques
| Technique | Description |
|---|---|
| Saved return-address overwrite | Overflow a local buffer to replace [RSP+0x08]/[EBP+4] and redirect RET |
| Saved frame pointer overwrite | Corrupt saved RBP/EBP to desynchronize the frame chain or pivot |
| Stack pivot | Use a gadget (xchg rsp, rax; leave; ret) to point RSP at attacker data |
| ROP chaining | Defeat DEP by chaining ret-terminated gadgets via the corrupted stack |
| SEH overwrite (x86) | Corrupt the exception handler chain on the stack to gain control on fault |
| Off-by-one / frame-pointer overwrite | Single-byte overflow to truncate or shift EBP, shifting subsequent frame math |
These primitives all depend on knowing the exact offset from a controllable buffer to the saved control-flow data — which is precisely the layout this tutorial defines.
12. Defensive Strategies & Detection
Detection focuses on the crash artifacts and post-exploitation behavior that stack corruption produces, since the corruption itself is often only visible at the moment of RET.
| Signal | Detail |
|---|---|
| Windows Error Reporting | Access violation at abnormal RIP; dumps under %LOCALAPPDATA%\Microsoft\Windows\WER\ReportQueue; Application Event 1000/1001 |
| Sysmon Event ID 1 | Unusual child process from document/browser renderers (T1203 follow-on) |
| Sysmon Event ID 10 | Cross-process stack reads via ReadProcessMemory |
| Security Event 4672 | Special privileges to an unexpected logon (T1068 follow-on) |
ETW Microsoft-Windows-Kernel-Process | Anomalous RIP/RSP deltas via call-stack sampling (stack pivot) |
ETW Microsoft-Windows-Security-Mitigations | Emits events when CFG, DEP, or Shadow Stack violations are blocked |
A practical first-line Sigma sketch catches the most common post-exploitation chain — a renderer spawning a shell:
title: Suspicious Child Process From Document Renderer
logsource:
  product: windows
  service: sysmon
detection:
  selection:
    EventID: 1
    ParentImage|endswith:
      - '\WINWORD.EXE'
      - '\EXCEL.EXE'
      - '\AcroRd32.exe'
    Image|endswith:
      - '\cmd.exe'
      - '\powershell.exe'
      - '\wscript.exe'
  condition: selection
level: high
Hardening checklist: compile with /GS (verify no /GS-), link /NXCOMPAT and /DYNAMICBASE, enable CFG with /guard:cf, turn on CET via SetProcessMitigationPolicy(ProcessUserShadowStackPolicy, ...), enforce /SAFESEH on x86, and configure Windows Defender Exploit Guard for legacy binaries. MITRE mitigation M1050 (Exploit Protection) bundles these OS controls.
13. MITRE ATT&CK Mapping
Stack layout knowledge is foundational rather than a single technique; the mapping below frames it in the defensive direction — recognizing the artifacts each technique produces.
| Technique | MITRE ID | Detection |
|---|---|---|
| Exploitation for Client Execution | T1203 | Sysmon EventID 1 renderer child chains; WER crash dumps |
| Exploitation for Privilege Escalation | T1068 | Security EventID 4672 unexpected source process |
| Exploit Public-Facing Application | T1190 | Service crash loops + WER on network-facing daemons |
| Reflective Code Loading | T1620 | ETW call-stack anomalies; non-image-backed RIP |
| Process Injection | T1055 | Sysmon EventID 8/10; abnormal cross-process access |
14. Tools for Stack Analysis
| Tool | Description | Link |
|---|---|---|
| WinDbg | Kernel/user debugging, k, dps, unwind walking | microsoft.com |
| x64dbg | Live user-mode stack inspection on x64/x86 | x64dbg.com |
| Godbolt Compiler Explorer | View prologue/epilogue and FPO across compilers | godbolt.org |
| Ghidra | Static reconstruction of frames and calling conventions | ghidra-sre.org |
| Process Hacker | Live thread stacks and call-stack walking | processhacker.sourceforge.io |
| NASM | Assemble illustrative prologue/epilogue snippets | nasm.us |
| GDB + pwndbg | Cross-platform frame and offset analysis | gdb.gnu.org |
Summary
- The stack is a downward-growing region where buffers sit beside the very return address the CPU trusts at
RET— which is why it is the primary target of memory-safety exploits. - x86 frames anchor on
EBPwith multiple calling conventions; x64 uses one convention,RCX/RDX/R8/R9parameters, 32-byte shadow space, 16-byte alignment, and RSP-relative addressing. - The prologue saves non-volatile registers and reserves locals; the epilogue (
LEAVE/RET) reverses it; frame-pointer omission removes the[EBP+4]anchor and forces RSP-relative offset math. - Overflows corrupt saved
RBP/EBPand the return address;/GS, DEP, ASLR, CFG, and CET Shadow Stack change the layout’s trust model but not the need to understand it. - Detect follow-on activity via WER dumps, Sysmon
EventID 1/10, Security4672, and ETW mitigation/call-stack events, mapped toT1203andT1068.
Related Tutorials
- Classic Stack Buffer Overflow: Smashing the Stack on Windows
- Egghunters: Staged Payload Delivery When Buffer Space Is Tight
- Shellcode Encoders: XOR Encoding, Custom Decoders, and Avoiding Bad Chars
- Position-Independent Code: Writing PIC Shellcode Without Hardcoded Addresses
- Writing x64 Shellcode: Differences, Shadow Space, and Register Conventions
References
- x64 ABI Conventions | Microsoft Learn
- Exploitation for Privilege Escalation (T1068) | MITRE ATT&CK
- Intel x86 Function-call Conventions – Assembly View | unixwiz.net
- ENTER — Make Stack Frame for Procedure Parameters (x86 Instruction Reference) | felixcloutier.com
- Windows x64 Calling Convention: Stack Frame | Red Team Notes (ired.team)