Handle Tables & Object Manager
Objective:
Understand the role and internals of the Windows Object Manager, the structure and purpose of handle tables, kernel object creation and management, object security, and impersonation techniques. This knowledge is critical for reverse engineering, system analysis, kernel exploitation, and detection of privilege escalation and persistence techniques.
Introduction
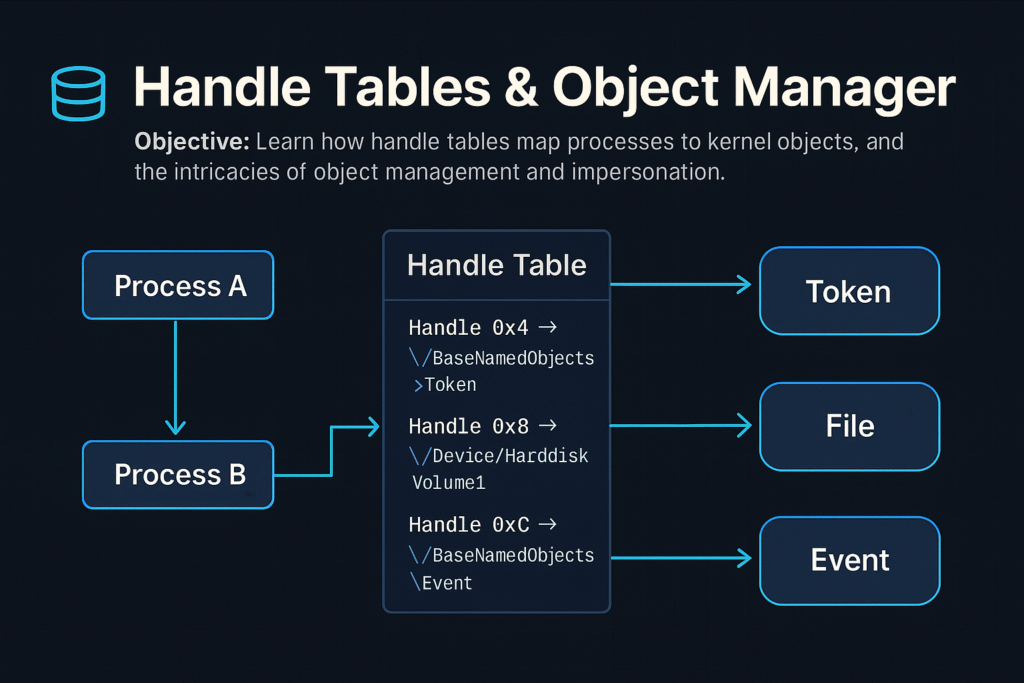
Windows internally uses objects to represent resources—files, processes, threads, events, mutexes, semaphores, and more. The Object Manager is a kernel subsystem responsible for creating, managing, securing, and destroying these objects.
Each process maintains a private Handle Table, mapping numeric handles to kernel objects. Accessing these kernel objects securely and efficiently through handles is fundamental for Windows’ stability and security.
Windows Object Manager Overview
The Object Manager (ntoskrnl.exe) manages:
- Creation and deletion of kernel objects.
- Object namespace management (hierarchical paths).
- Security via Access Control Lists (ACLs).
- Reference counting and lifetime management.
Common Kernel Objects
| Object Type | Description |
|---|---|
| Process | Executing program instance |
| Thread | Unit of execution within a process |
| File | Represents open file or I/O device |
| Event | Synchronization primitive |
| Mutex | Mutual exclusion lock |
| Semaphore | Synchronization counter |
| Token | Security context (user privileges, groups) |
Object Namespace
Kernel objects are structured hierarchically, similar to a file system:
Example paths:
\Device\HarddiskVolume1
\BaseNamedObjects\GlobalEvent
Use tools like WinObj (Sysinternals) to browse the object namespace.
Object Structures and Headers
Every object in kernel mode has a common header (OBJECT_HEADER) with metadata:
typedef struct _OBJECT_HEADER {
 LONG_PTR PointerCount; // Number of active pointers
 LONG_PTR HandleCount; // Active handle count
 PVOID ObjectType; // Pointer to OBJECT_TYPE structure
 PVOID SecurityDescriptor; // ACL for the object
 UNICODE_STRING Name; // Object name
 // ...
} OBJECT_HEADER;
This header precedes the actual object in memory.
Handle Tables
A Handle is an integer value referencing an object entry in a process-specific handle table.
- Each process has its own handle table.
- Maps handle values (integers) to pointers to kernel-mode objects.
Handle Table Entry (HANDLE_TABLE_ENTRY):
typedef struct _HANDLE_TABLE_ENTRY {
 union {
 PVOID Object; // Pointer to actual object
 ULONG_PTR Attributes;
 };
 ACCESS_MASK GrantedAccess; // Permissions for the handle
} HANDLE_TABLE_ENTRY;
Handle Tables allow controlled, indirect access to kernel objects.
Working with Handles (APIs)
Common APIs for working with handles:
| API Function | Purpose |
|---|---|
OpenProcess | Gets a handle to an existing process |
OpenThread | Gets a handle to a thread |
CreateFile | Opens file/device handle |
DuplicateHandle | Duplicates existing handles |
CloseHandle | Releases the handle |
Example (C++):
HANDLE hProc = OpenProcess(PROCESS_ALL_ACCESS, FALSE, pid);
CloseHandle(hProc);
NtQuerySystemInformation
A native NT API function that provides extensive system information.
NTSTATUS NtQuerySystemInformation(
 SYSTEM_INFORMATION_CLASS SystemInformationClass,
 PVOID SystemInformation,
 ULONG SystemInformationLength,
 PULONG ReturnLength
);
Common use:
- Query process lists (
SystemProcessInformation) - Handle information (
SystemHandleInformation)
Example: Enumerating Handles
NtQuerySystemInformation(SystemHandleInformation, buffer, bufferSize, &returnedSize);Enumerating Handles via PowerShell:
Get-Process | ForEach-Object {
 $_ | Select-Object -ExpandProperty Handles
}
Object Security & ACLs
Kernel objects include a Security Descriptor (SD):
- Owner SID
- Group SID
- DACL (Discretionary ACL): who has access
- SACL (System ACL): audit events on access
Example: Changing ACL via WinAPI:
SetSecurityInfo(hFile, SE_FILE_OBJECT, DACL_SECURITY_INFORMATION, NULL, NULL, pNewDacl, NULL);Audit ACLs with:
Get-Acl '\\.\pipe\mypipe'Object Reference Counting
Objects have two counters:
- Handle Count: Number of handles referencing it.
- Pointer Count: Direct kernel pointers referencing it.
When both reach zero, the object is destroyed automatically.
Kernel Objects and Impersonation
Windows supports Security Impersonation, allowing threads to execute with another user’s security context (token).
Impersonation Levels:
- Anonymous: No identification.
- Identification: Identity check only.
- Impersonation: Access local resources as the impersonated user.
- Delegation: Access remote resources as impersonated user.
Impersonation APIs:
ImpersonateLoggedOnUserImpersonateNamedPipeClientSetThreadToken
Example Impersonation:
LogonUser(user, domain, pass, LOGON32_LOGON_INTERACTIVE, LOGON32_PROVIDER_DEFAULT, &hToken);
ImpersonateLoggedOnUser(hToken);
// Thread now has user privileges
Attackers exploit impersonation by stealing tokens from privileged processes (Token stealing via handle duplication).
Handle Duplication for Privilege Escalation
Attackers commonly duplicate high-privilege handles:
Example exploitation flow:
- Open a privileged process handle (
OpenProcess). - Duplicate its token (
DuplicateHandle). - Assign the duplicated token to the current process (
SetThreadTokenorSetTokenInformation).
Detection via Sysmon (Event ID 10 – ProcessAccess).
Common Attacker Techniques
| Technique | Description |
|---|---|
| Handle Hijacking | Duplicate handles to privileged processes |
| Object ACL Abuse | Modify ACLs of kernel objects |
| Named Object Hijacking | Hijack named objects (events/mutexes) |
| Kernel Object Leaks | Leaking kernel object addresses |
Defensive Strategies & Detection
Sysmon (Process Access Monitoring):
- Track unusual handle duplications:
Sysmon Event ID 10: PROCESS_ACCESSHandle & Object Auditing:
- Use Process Hacker or Process Monitor.
- Enumerate handles periodically for anomalies.
Object ACL Hardening:
- Reduce unnecessary write permissions.
- Regularly audit ACLs on critical named objects.
Tools for Handle & Object Analysis
| Tool | Description |
|---|---|
WinObj | Browse kernel object namespace (Sysinternals) |
Process Hacker | Real-time handle/object analysis |
handle.exe | Sysinternals command-line handle viewer |
Process Monitor | File, registry, and handle monitoring |
Volatility | Forensic memory object & handle analysis |
Example handle enumeration (handle.exe):
handle.exe -p 1234Summary
- Windows Object Manager controls lifecycle, security, and naming of kernel objects.
- Each process has a handle table, mapping handles to kernel objects securely.
NtQuerySystemInformationprovides detailed handle and object insights.- Impersonation techniques allow threads to execute with alternative user privileges.
- Attackers leverage handle duplication and impersonation for privilege escalation.
- Defensive controls include Sysmon monitoring, ACL auditing, and continuous handle enumeration.
Related Tutorials
- Access Tokens and Privileges: The Kernel’s Security Context
- SIDs and Security Descriptors: Identity in Windows Security
- Fibers: User-Mode Cooperative Threads
- Jobs and Silos: Process Grouping and Resource Limits
- Windows Scheduler Internals: Priority Levels, Quantum, and Thread Selection
References
- Handles and Objects – Win32 Apps | Microsoft Learn
- NtQuerySystemInformation function (winternl.h) – Win32 Apps | Microsoft Learn
- Process Injection, Technique T1055 – Enterprise | MITRE ATT&CK
- Process Injection: Thread Execution Hijacking, Sub-technique T1055.003 – Enterprise | MITRE ATT&CK
- Listing Open Handles and Finding Kernel Object Addresses from Userland | Red Team Notes (ired.team)
- Journey Into the Object Manager Executive Subsystem: Handles | ntamonsec
Memory Management Internals
Objective:
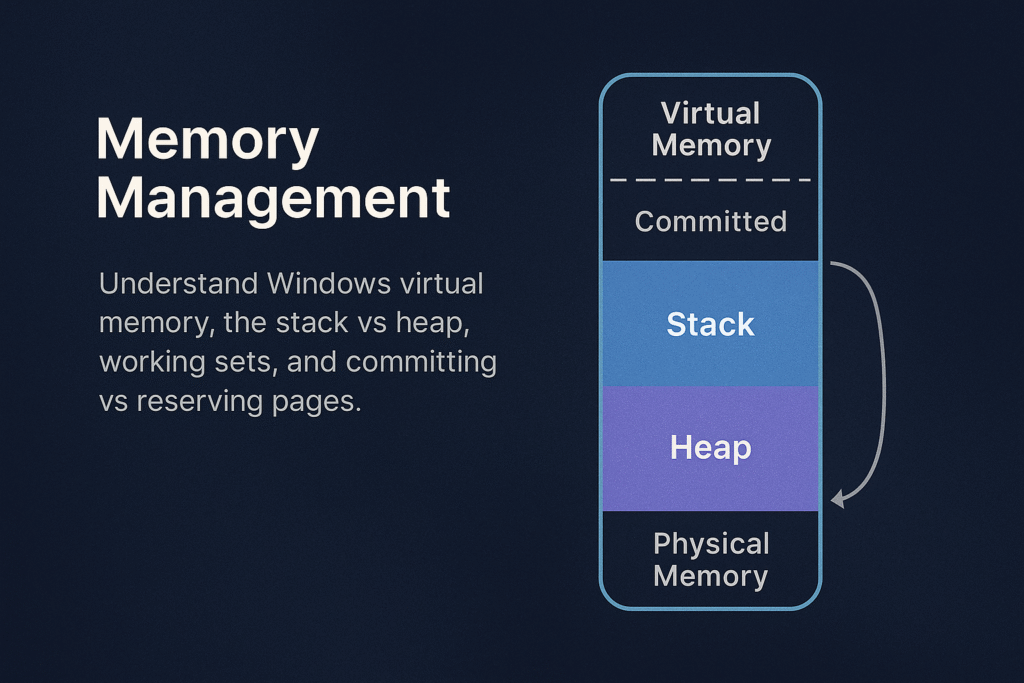
Understand the internal architecture and functionality of Windows memory management, including virtual memory, physical memory mappings, distinctions between stack and heap allocations, and memory management concepts such as working sets, committed versus reserved memory. This knowledge is essential for reverse engineering, exploit development, malware analysis, and system performance optimization.
Introduction
Windows uses advanced virtual memory management to efficiently handle application and system memory. Understanding how Windows manages memory—from virtual addresses to physical memory mappings—enables better performance tuning, troubleshooting memory leaks, analyzing malware behaviors, and performing memory-based exploit development.
Memory Management Overview
Windows memory management involves:
- Virtual Address Space (VAS)
- Physical Memory (RAM)
- Paging and Page Tables
- Heap and Stack allocations
- Working Sets
- Commit and Reserve
Virtual Memory Layout
Each Windows process has a unique virtual address space, typically:
- User-mode space: Lower addresses (e.g., 0x00000000–0x7FFFFFFF on 32-bit; 0x0000000000000000–0x00007FFFFFFF on 64-bit)
- Kernel-mode space: Higher addresses (e.g., 0x80000000–0xFFFFFFFF on 32-bit; 0xFFFF800000000000–0xFFFFFFFFFFFFFFFF on 64-bit)
x64 Windows Layout:
+------------------------------+ 0xFFFFFFFFFFFFFFFF
| Kernel-mode space |
+------------------------------+ 0xFFFF800000000000
| Unused |
+------------------------------+ 0x00007FFFFFFFFFFF
| User-mode space |
+------------------------------+ 0x0000000000000000
Stack vs Heap
Applications allocate memory using two main methods: Stack and Heap.
Stack
- LIFO (Last In, First Out) data structure.
- Used for function calls, local variables, return addresses.
- Fixed-size, determined at thread creation (default ~1MB/thread).
- Stack overflow occurs when usage exceeds allocated stack space.
Example stack allocation (automatic):
int foo() {
 int a = 10; // Stack allocated
 return a;
}
Heap
- Flexible, dynamically-sized region.
- Managed explicitly by
malloc(),HeapAlloc(),new,VirtualAlloc(). - Fragmentation can occur over time.
Example heap allocation (manual):
int* arr = (int*)malloc(10 * sizeof(int));Working Sets
The Working Set is a set of physical memory pages currently used by a process.
- Windows tracks per-process working sets.
- Working sets dynamically change based on usage.
- Windows trims working sets under memory pressure.
Use Task Manager or Process Explorer to examine Working Sets:
- Private Working Set: memory exclusive to a process.
- Shareable Working Set: memory shared between processes.
Inspect via PowerShell:
Get-Process | Select Name, WorkingSet, PagedMemorySize, PrivateMemorySizeCommit vs Reserve
When an application allocates virtual memory, Windows allows two different states:
Reserved Memory
- Reservation of virtual address range without allocating physical memory or paging file.
- Not usable until committed.
- Used to ensure contiguous memory availability for future use.
Committed Memory
- Backed by physical RAM or paging file.
- Usable immediately by applications.
- Counts against system commit limit.
Example (C++):
// Reserve virtual memory
LPVOID reserved = VirtualAlloc(NULL, 4096, MEM_RESERVE, PAGE_READWRITE);

// Commit reserved memory
LPVOID committed = VirtualAlloc(reserved, 4096, MEM_COMMIT, PAGE_READWRITE);
Paging and Page Tables
Windows uses paging to map virtual addresses to physical addresses.
- Page size typically 4KB.
- Uses Multi-level page tables (x64: PML4 → PDPT → PD → PT).
- On access violation (page fault), Windows loads the requested page from disk if available (paging).
Example of Page Fault Handling:
- A program references an address not in RAM.
- CPU raises a page fault.
- Windows kernel fetches the page from disk or allocates memory.
- Instruction is retried.
Memory Protection & Permissions
Each page has memory protection attributes:
PAGE_EXECUTE_READWRITE: executable, readable, writable (often abused by malware)PAGE_READONLY: read-onlyPAGE_NOACCESS: no access permitted
Example memory permission change:
DWORD oldProtect;
VirtualProtect(address, size, PAGE_EXECUTE_READWRITE, &oldProtect);
Heap Internals
Windows provides several heaps per process:
- Default Process Heap: created automatically at startup (
GetProcessHeap()). - Private Heaps: created explicitly (
HeapCreate()).
Heap allocations are tracked via internal heap structures:
- Heap headers: track size, flags.
- Heap fragmentation: caused by frequent allocations/deallocations.
Tools like WinDbg or !heap extension allow analysis of heap internals:
!heap -s ; Summary of heaps
!heap -h 0xAddr ; Analyze specific heap
Stack Internals
- Each thread gets its own stack.
- Stack grows downward (high → low addresses).
- Stack Pointer (
ESP/RSP) tracks current stack top.
Typical stack frame (x64):
+------------------------+
| Local Variables |
+------------------------+
| Saved Registers |
+------------------------+
| Return Address |
+------------------------+
| Function Parameters |
+------------------------+
Memory Management APIs & Tools
Common Memory APIs:
| Function | Purpose |
|---|---|
VirtualAlloc | Reserve/commit virtual pages |
VirtualFree | Release/decommit memory |
HeapAlloc | Allocate heap memory |
HeapFree | Free heap memory |
RtlAllocateHeap | NT heap allocation API |
Memory Analysis Tools:
- VMMap: Detailed virtual memory analysis.
- RAMMap: Physical memory usage inspection.
- Process Hacker: Real-time memory allocation inspection.
- WinDbg: In-depth debugging and analysis.
Malware and Exploit Use Cases
| Technique | Abuse Scenario |
|---|---|
| Heap Spray | Preparing predictable memory layout for exploitation |
| Stack Overflow | Overwriting return addresses for RCE |
| ROP Gadgets | Executing chained snippets of legitimate code in stack |
| Code Injection | Allocating executable memory (PAGE_EXECUTE_READWRITE) |
| Shellcode Loading | Using VirtualAlloc/VirtualProtect to execute payloads |
Memory Forensics & Detection
- Use Volatility Framework for memory forensics:
volatility -f memory.dmp pslist
volatility -f memory.dmp malfind- Monitor abnormal allocations (
PAGE_EXECUTE_READWRITEpages) with Sysmon:
Sysmon Event ID 10 (ProcessAccess)Summary
- Windows manages memory through complex virtual-to-physical mapping.
- Stack is used for automatic, function-local allocations.
- Heap handles dynamic memory, manually managed by developers.
- Working Sets optimize performance and memory efficiency.
- Commit and Reserve control memory usage strategy.
- Understanding these internals enables effective memory forensics, exploit development, and performance tuning.
Related Tutorials
- Access Tokens and Privileges: The Kernel’s Security Context
- SIDs and Security Descriptors: Identity in Windows Security
- Fibers: User-Mode Cooperative Threads
- Jobs and Silos: Process Grouping and Resource Limits
- Windows Scheduler Internals: Priority Levels, Quantum, and Thread Selection
References
- Memory Management (Win32 Apps) — Microsoft Learn
- Windows Kernel-Mode Memory Manager — Microsoft Learn (Windows Drivers)
- Virtual Memory Functions — Microsoft Learn (Win32 Apps)
- Memory Management for Windows Drivers — Microsoft Learn
- Process Injection (T1055) — MITRE ATT&CK Enterprise
- OS Credential Dumping: LSASS Memory (T1003.001) — MITRE ATT&CK Enterprise
Threads and the TEB (Thread Environment Block)
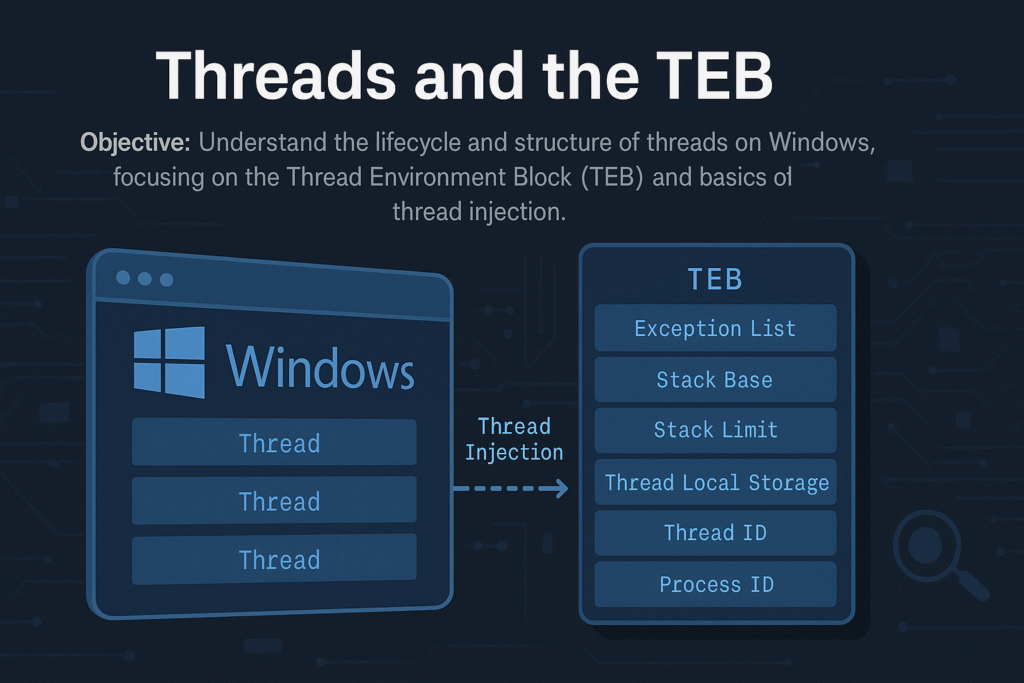
Objective: Understand the internal workings of threads on Windows, the lifecycle of a thread from creation to termination, the critical role of the Thread Environment Block (TEB), and fundamentals of thread injection techniques. This foundational knowledge is crucial for system developers, reverse engineers, malware analysts, and red teamers.
Introduction
A thread is the smallest execution unit within a process on Windows, scheduled independently by the OS kernel. Every process contains at least one thread, but often many more. Each thread maintains its own state, CPU registers, stack, and local storage.
Central to each thread’s operation is the Thread Environment Block (TEB), a user-mode structure containing thread-specific data critical for thread execution, error handling, exception handling, and system call interfacing.
Thread Lifecycle
A typical thread undergoes these stages:
Creation → Scheduling → Execution → Waiting/Blocking → TerminationDetailed Steps:
- Creation:
Initiated via APIs like:CreateThread()RtlCreateUserThread()NtCreateThreadEx()
- Scheduling (Kernel):
Windows uses priority-based preemptive scheduling:- Quantum: Thread time-slice allocated for execution.
- Threads can have different priority levels (
0to31).
- Execution (User-Mode):
Execution starts at thread entry function (LPTHREAD_START_ROUTINE). - Waiting/Blocking:
Threads often enter waiting states (WaitForSingleObject(),Sleep(), I/O waits). - Termination:
Ends via:- Returning from thread function
- Calling
ExitThread() - Termination by another thread (
TerminateThread()– unsafe)
Thread Environment Block (TEB)
Each thread has a unique TEB, accessed quickly via the FS:[0x18] register on x86 or GS:[0x30] on x64.
Key TEB fields:
typedef struct _TEB {
 NT_TIB NtTib;
 PVOID EnvironmentPointer;
 CLIENT_ID ClientId; // Unique Thread ID and Process ID
 PVOID ActiveRpcHandle;
 PVOID ThreadLocalStoragePointer;
 PPEB ProcessEnvironmentBlock; // Pointer to the PEB
 ULONG LastErrorValue;
 ULONG CountOfOwnedCriticalSections;
 PVOID Win32ThreadInfo;
 ULONG CurrentLocale;
 ULONG FpSoftwareStatusRegister;
 // ... (more fields)
} TEB;
Notable Fields Explained:
ClientId: Contains the thread’s TID and owning PID.ProcessEnvironmentBlock(PEB): Points to the process-wide PEB structure.ThreadLocalStoragePointer: Points to thread-local storage (TLS).LastErrorValue: Stores the last error value (GetLastError()).NtTib: Contains:- Stack Base (
StackBase) - Stack Limit (
StackLimit) - Exception handler list
- Stack Base (
Accessing the TEB (x64):
mov rax, gs:[0x30] ; RAX now contains TEB pointerThread Creation APIs (Detailed)
1. CreateThread()
Commonly used high-level API:
HANDLE CreateThread(
 LPSECURITY_ATTRIBUTES lpThreadAttributes,
 SIZE_T dwStackSize,
 LPTHREAD_START_ROUTINE lpStartAddress,
 LPVOID lpParameter,
 DWORD dwCreationFlags,
 LPDWORD lpThreadId
);
2. NtCreateThreadEx() (Native)
Lower-level, flexible NTAPI:
NTSTATUS NtCreateThreadEx(
 PHANDLE ThreadHandle,
 ACCESS_MASK DesiredAccess,
 POBJECT_ATTRIBUTES ObjectAttributes,
 HANDLE ProcessHandle,
 PVOID StartRoutine,
 PVOID Argument,
 ULONG CreateFlags,
 SIZE_T ZeroBits,
 SIZE_T StackSize,
 SIZE_T MaximumStackSize,
 PVOID AttributeList
);- Powerful for cross-process thread injection.
Thread Injection Basics
Thread injection is a fundamental technique in malware development and red teaming, allowing execution of code in a remote process.
Thread Injection Workflow:
- Obtain Handle:
OpenProcess(PROCESS_ALL_ACCESS, FALSE, pid); - Allocate Memory:
VirtualAllocEx(hProc, ...) - Write Payload:
WriteProcessMemory(hProc, remoteMemory, ...) - Create Remote Thread:
CreateRemoteThread(hProc, ..., remoteMemory, ...)
Simplified Example (Remote Thread Injection):
// Open handle to target process
HANDLE hProcess = OpenProcess(PROCESS_ALL_ACCESS, FALSE, pid);

// Allocate memory
LPVOID remoteMemory = VirtualAllocEx(hProcess, NULL, payloadSize, MEM_COMMIT | MEM_RESERVE, PAGE_EXECUTE_READWRITE);

// Write payload (shellcode or DLL loader)
WriteProcessMemory(hProcess, remoteMemory, payload, payloadSize, NULL);

// Start remote thread execution
CreateRemoteThread(hProcess, NULL, 0, (LPTHREAD_START_ROUTINE)remoteMemory, NULL, 0, NULL);
Common Thread Injection Techniques
| Technique | Description |
|---|---|
CreateRemoteThread | Direct injection of threads into another process |
NtCreateThreadEx | More advanced version of CreateRemoteThread |
QueueUserAPC | Injecting asynchronous procedure calls |
SetThreadContext | Hijacking an existing thread’s execution context |
Detection and Analysis of Thread Injection
Indicators:
- Suspicious
CreateRemoteThread()calls targeting unexpected processes - Memory allocated (
VirtualAllocEx) with execute permissions (PAGE_EXECUTE_READWRITE) - Threads created by processes other than expected parent processes
Tools for Detection:
- Sysmon (
Event ID 8: CreateRemoteThread) - Process Hacker, Process Monitor
- API hooking (EDR solutions)
- Memory scanners (Volatility, Rekall)
Thread Hijacking via TEB Manipulation (Advanced)
Malware can directly manipulate the TEB to hijack threads:
- Overwrite TEB’s stack pointers or exception handlers
- Intercept thread execution flow
Example (x64 Assembly):
mov rax, gs:[0x30] ; TEB base
mov [rax+0x8], myStackBase ; overwrite StackBase
mov [rax+0x10], myStackLimit ; overwrite StackLimit
This is advanced and dangerous but illustrates TEB exploitation potential.
Forensics and Incident Response Tips
- Collect thread information during IR investigations:
Get-Process -Id $PID | Select -Expand Threads- Dump TEB structures and thread contexts with WinDbg or volatility.
- Watch for abnormal thread creations in unexpected processes or sudden thread terminations.
Summary
- Threads are fundamental units of execution managed by Windows.
- Each thread maintains critical data in the TEB structure.
- Threads can be created, injected, and manipulated by advanced APIs.
- Injection techniques are commonly abused by malware and red teams.
- Detection relies on system-level monitoring (Sysmon, API hooks).
Related Tutorials
- Fibers: User-Mode Cooperative Threads
- Windows Scheduler Internals: Priority Levels, Quantum, and Thread Selection
- APCs: Asynchronous Procedure Calls and Thread Hijacking Surface
- Access Tokens and Privileges: The Kernel’s Security Context
- SIDs and Security Descriptors: Identity in Windows Security
References
- Thread Environment Block (Debugging Notes) – Win32 Apps | Microsoft Learn
- !teb (WinDbg Debugger Command) – Windows Drivers | Microsoft Learn
- TEB – Geoff Chappell, Software Analyst (Detailed Field-by-Field Reference)
- Win32 Thread Information Block (TIB / TEB) – Wikipedia
- Process Injection: Thread Local Storage (T1055.005) – MITRE ATT&CK
Windows Process Creation Internals & PEB
Objective: Deeply understand how Windows creates new processes, detailing the internal workings of the
CreateProcessAPI, kernel object management, memory mapping, and the structure and role of the Process Environment Block (PEB). This is essential knowledge for analyzing and understanding malware behavior, reverse engineering, and advanced debugging.
Introduction
Process creation on Windows is a sophisticated, multi-step procedure involving extensive kernel and user-mode coordination. At the center of this operation is the CreateProcess() API, which initializes process structures, allocates memory, maps executables, and prepares environment variables.
Each Windows process also maintains a Process Environment Block (PEB), a crucial data structure that contains runtime information about the loaded modules, command-line arguments, and more. The PEB is frequently leveraged by attackers and defenders for various advanced techniques.
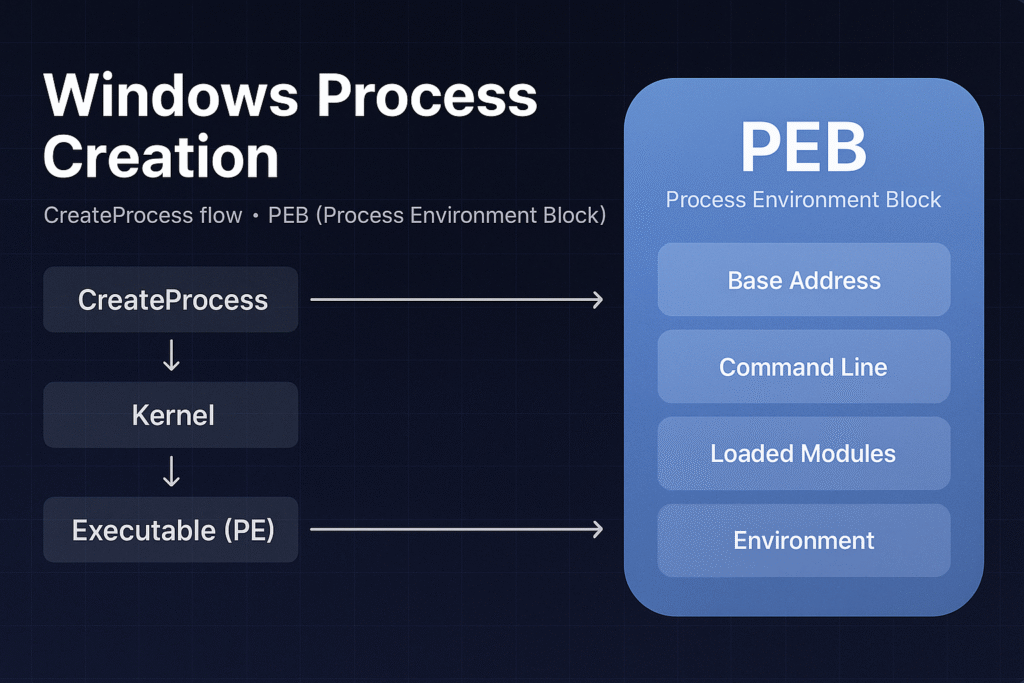
High-Level CreateProcess Flow
The general steps when calling CreateProcess():
- User-mode API Call:
Application invokeskernel32!CreateProcessWor similar. - Kernel Transition (ntdll):
CreateProcessWinvokesntdll!NtCreateUserProcess. - Kernel Mode Initialization (ntoskrnl):
- Kernel creates EPROCESS object.
- Initializes Virtual Address Descriptor (VAD) structures.
- Maps
ntdll.dllinto new process address space.
- PE File Loading:
- PE loader maps executable image sections.
- Resolves imports and relocations.
- Sets initial execution context (thread, stack, registers).
- Subsystem Notification (CSRSS):
- Subsystem server creates structures for console/GUI.
- Initial Thread Execution:
- Execution begins at the
AddressOfEntryPoint.
- Execution begins at the
Detailed Step-by-Step Flow
Step 1: User-mode API Invocation
When an application wants to start a new process, it uses:
BOOL CreateProcessW(
 LPCWSTR lpApplicationName,
 LPWSTR lpCommandLine,
 LPSECURITY_ATTRIBUTES lpProcessAttributes,
 LPSECURITY_ATTRIBUTES lpThreadAttributes,
 BOOL bInheritHandles,
 DWORD dwCreationFlags,
 LPVOID lpEnvironment,
 LPCWSTR lpCurrentDirectory,
 LPSTARTUPINFO lpStartupInfo,
 LPPROCESS_INFORMATION lpProcessInformation
);
This call eventually resolves down to an NTDLL syscall:
NtCreateUserProcess(&ProcessHandle, &ThreadHandle, ..., &ProcessParameters, ...);Step 2: Kernel-side Initialization
Kernel (ntoskrnl) creates key kernel structures:
- EPROCESS: Process kernel object
- ETHREAD: Initial thread kernel object
- VAD Tree: Virtual Address Descriptors for memory management
- Initializes security tokens and handles
Step 3: PE Image Loading
Kernel PE loader:
- Maps PE executable sections (
.text,.data, etc.) into memory. - Handles relocations and import resolutions (
IATresolution). - Initializes the stack, heap, and default libraries (
ntdll.dll).
Step 4: User-mode initialization (ntdll)
Upon kernel returning control, ntdll.dll runs user-mode initializations:
- Executes TLS (Thread Local Storage) callbacks
- Sets up user-mode stack and heap structures
- Runs CRT (C Runtime) initialization (
mainCRTStartup)
Step 5: Subsystem Initialization (CSRSS)
- Windows subsystem (
csrss.exe) notified to handle GUI or console session management.
Step 6: Main Thread Execution
- Execution control transferred to the PE file’s
AddressOfEntryPoint.
Process Environment Block (PEB)
The PEB is a crucial process structure located in user mode memory (fs:[0x30] on 32-bit, gs:[0x60] on 64-bit Windows).
typedef struct _PEB {
 BYTE Reserved1[2];
 BYTE BeingDebugged;
 BYTE Reserved2[1];
 PVOID Reserved3[2];
 PPEB_LDR_DATA Ldr; // Loaded modules
 PRTL_USER_PROCESS_PARAMETERS ProcessParameters; // Command-line, env
 BYTE Reserved4[104];
 PVOID Reserved5[52];
 PPS_POST_PROCESS_INIT_ROUTINE PostProcessInitRoutine;
 BYTE Reserved6[128];
 ULONG SessionId;
} PEB, *PPEB;
Key Fields:
- BeingDebugged: Indicates if a debugger is attached.
- Ldr: Contains loaded module information (
PEB_LDR_DATA). - ProcessParameters: Command line, environment variables, startup directory, window settings.
PEB_LDR_DATA Structure
This structure points to the loaded modules (DLLs) in the process:
typedef struct _PEB_LDR_DATA {
 ULONG Length;
 BYTE Initialized;
 PVOID SsHandle;
 LIST_ENTRY InLoadOrderModuleList;
 LIST_ENTRY InMemoryOrderModuleList;
 LIST_ENTRY InInitializationOrderModuleList;
 PVOID EntryInProgress;
} PEB_LDR_DATA, *PPEB_LDR_DATA;
These linked lists (InLoadOrderModuleList, etc.) contain information about every DLL mapped into the process memory, crucial for module enumeration.
RTL_USER_PROCESS_PARAMETERS Structure
Contains the runtime parameters of the process:
typedef struct _RTL_USER_PROCESS_PARAMETERS {
 ULONG MaximumLength;
 ULONG Length;
 ULONG Flags;
 ULONG DebugFlags;
 HANDLE ConsoleHandle;
 ULONG ConsoleFlags;
 HANDLE StandardInput;
 HANDLE StandardOutput;
 HANDLE StandardError;
 UNICODE_STRING CurrentDirectoryPath;
 HANDLE CurrentDirectoryHandle;
 UNICODE_STRING DllPath;
 UNICODE_STRING ImagePathName; // Path to the executable
 UNICODE_STRING CommandLine; // Process arguments
 PVOID Environment; // Environment block
 ULONG StartingX;
 ULONG StartingY;
 ULONG CountX;
 ULONG CountY;
 ULONG CountCharsX;
 ULONG CountCharsY;
 ULONG FillAttribute;
 ULONG WindowFlags;
 ULONG ShowWindowFlags;
 UNICODE_STRING WindowTitle;
 UNICODE_STRING DesktopInfo;
 UNICODE_STRING ShellInfo;
 UNICODE_STRING RuntimeData;
 RTL_DRIVE_LETTER_CURDIR CurrentDirectories[32];
 ULONG EnvironmentSize;
} RTL_USER_PROCESS_PARAMETERS, *PRTL_USER_PROCESS_PARAMETERS;
Common Malware & Defense Uses of PEB
Malware Uses:
- Anti-debugging: Check
BeingDebuggedflag. - Module hiding: Manipulate
PEB_LDR_DATAto hide loaded DLLs from tools like Process Explorer or debuggers. - Process injection: Read remote process PEB to locate modules and perform injection.
Defense Uses:
- Forensics: Analyzing PEB structures to detect hidden modules or unusual command-line arguments.
- Behavioral detection: Monitoring PEB accesses can indicate stealthy operations (like hiding loaded modules).
Practical Inspection of PEB
WinDbg Commands:
- Inspect PEB:
!peb- View loaded modules:
lm- Dump PEB structure directly:
dt _PEB @$pebSummary
- Process creation (
CreateProcess) is complex, involving kernel and user-mode coordination. - Key kernel objects (
EPROCESS,ETHREAD) manage process lifecycle and resources. - The PEB contains vital runtime details and is heavily utilized by both malware and security tools.
- Deep understanding aids in reverse engineering, malware analysis, and debugging.
Related Tutorials
- Jobs and Silos: Process Grouping and Resource Limits
- Windows Boot Process
- Access Tokens and Privileges: The Kernel’s Security Context
- SIDs and Security Descriptors: Identity in Windows Security
- Fibers: User-Mode Cooperative Threads
References
- CreateProcess function (processthreadsapi.h) — Win32 Apps | Microsoft Learn
- Creating Processes — Win32 Apps | Microsoft Learn
- PEB_LDR_DATA structure (winternl.h) — Win32 Apps | Microsoft Learn
- !peb — WinDbg PEB Extension | Microsoft Learn (Windows Drivers)
- Process Injection, Technique T1055 — Enterprise | MITRE ATT&CK
- Process Injection: Process Hollowing, Sub-technique T1055.012 — Enterprise | MITRE ATT&CK