Setting Up Your Exploit Development Lab (VMs, Debuggers, Tools)
Objective: Build an isolated, fully-functional Windows exploit development lab from scratch — selecting and configuring VMs, installing and tuning debuggers, deploying exploit-assistance tooling, and understanding why each component exists — so you can safely study user-mode and kernel-mode exploitation without risking production systems.
Contents
- 1 1. Lab Philosophy and Safety
- 2 2. Choosing a Hypervisor and VM Configuration
- 3 3. The Debugger/Debuggee Model
- 4 4. Installing WinDbg and Configuring Symbols
- 5 5. Configuring Kernel Debug Transport
- 6 6. Installing x64dbg and Visual Debuggers
- 7 7. Disassemblers: IDA and Ghidra
- 8 8. Exploit Assistance: mona.py, PyKD, and boofuzz
- 9 9. Vulnerable Practice Targets
- 10 10. Understanding and Controlling Mitigations
- 11 11. PEB Debugging Awareness and Heap Behaviour
- 12 12. Common Attacker Techniques This Lab Lets You Study
- 13 13. Defensive Strategies & Detection
- 14 14. Tools for Lab Setup and Analysis
- 15 Summary
- 16 Related Tutorials
- 17 References
1. Lab Philosophy and Safety
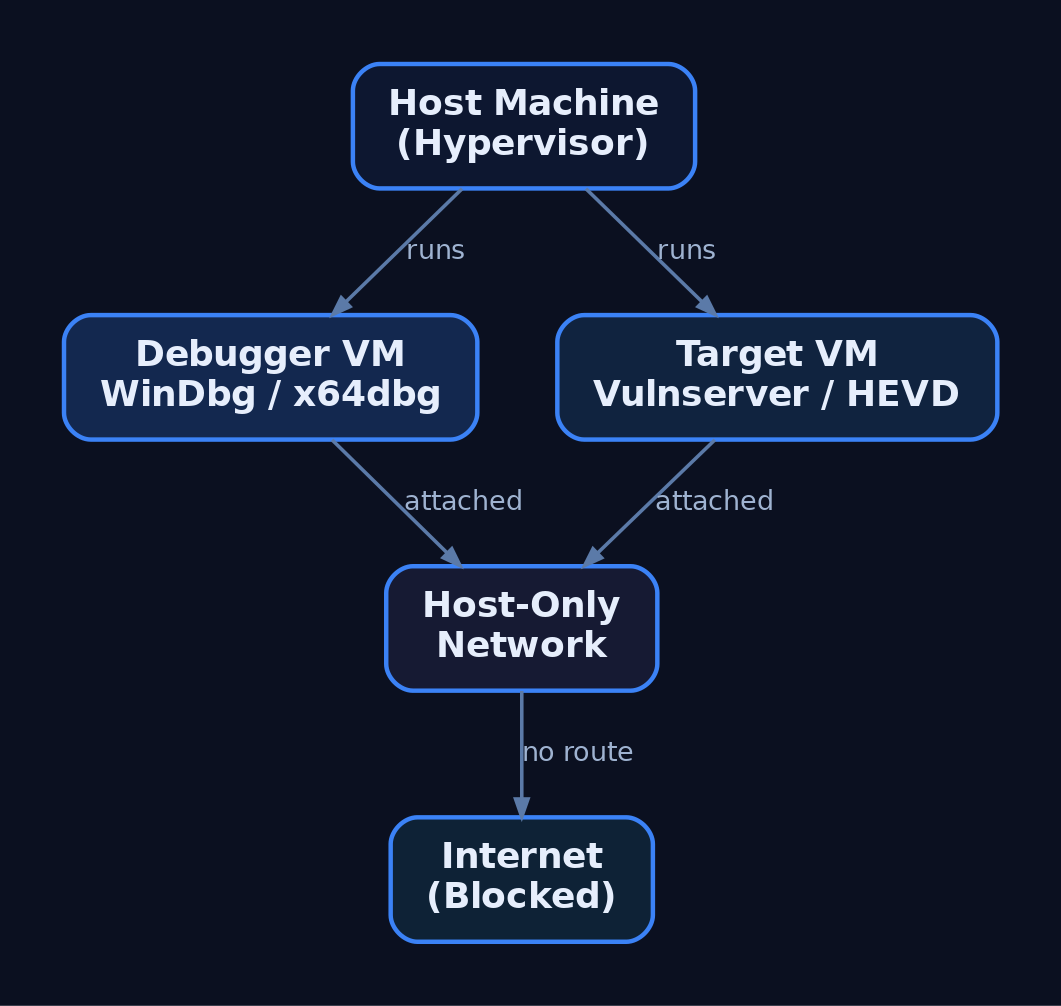
Exploit development is destructive by nature. You will corrupt memory, crash services, and intentionally bypass security controls. None of that is acceptable on a production host or a network with real users. The first rule of the lab is isolation: every target lives inside a virtual machine on a Host-Only network with no route to the internet or to your corporate LAN.
Treat the lab as authorized-research-only space. The techniques you practise here map to real adversary behaviour; the difference between research and intrusion is authorization and scope. Never point fuzzers, shellcode, or debuggers at systems you do not own or have written permission to test.
Two disciplines make or break a lab: network isolation and snapshot hygiene. Snapshot before each exercise so a corrupted kernel or a hung service is a 10-second revert, not a rebuild.
2. Choosing a Hypervisor and VM Configuration
Either VMware Workstation or VirtualBox is sufficient. VMware’s virtual serial/named-pipe handling is slightly smoother for kernel debugging; VirtualBox is free and adequate. The canonical lab is two VMs:
| Role | Recommended OS | Purpose |
|---|---|---|
| Debugger VM | Windows 10 x64 | Runs WinDbg Preview, x64dbg, disassemblers |
| User-mode target | Windows 10 x64 | Mitigations toggled per-exercise |
| Kernel target | Windows 7 x64 | Fewer protections, beginner-friendly |
Windows 7 x64 is common for early kernel work because it lacks many modern protections. Move to Windows 10/11 targets once you understand the fundamentals — modern exploitation research demands them.
Hardware guidance: allocate 2 vCPU / 4 GB RAM per VM minimum, and give the host enough headroom to run both target and debugger simultaneously. Set the lab adapters to Host-Only so the two VMs see each other but nothing else.
3. The Debugger/Debuggee Model
User-mode and kernel-mode debugging behave differently.
| Feature | User-Mode Debugging | Kernel-Mode Debugging |
|---|---|---|
| Target | A single process | The entire OS kernel |
| Location | Same machine as debugger | Remote (second VM) |
| Failure blast radius | One process crashes | Whole OS becomes unusable |
| Transport | Direct attach | Virtual serial (COM) or KDNET |
For user-mode work you can debug locally. Kernel debugging is done remotely — corrupting kernel memory typically bricks the running OS, so the debugger must live on a separate machine. This is why the two-VM split is non-negotiable for kernel exploitation.
4. Installing WinDbg and Configuring Symbols
WinDbg is the best fit for Windows exploitation because it handles both user-mode and kernel-mode, and it is free as part of the Windows SDK, the Windows Driver Kit (WDK), and Debugging Tools for Windows. During SDK setup, deselect everything except Debugging Tools for Windows.
| Tool | Role |
|---|---|
WinDbg Classic | Kernel + user-mode; command-line-centric; ships with SDK/WDK |
WinDbg Preview (WinDbgX) | Modern UI, Time Travel Debugging (TTD), JavaScript API |
WinDbg Preview requires Windows 10 build 1607 (RS1) or newer. Its TTD and modern UI make early learning far less painful than the basic Classic GUI, where newcomers often fight the debugger as much as the target.
Symbols turn raw addresses into named functions. Point WinDbg at Microsoft’s public symbol server via _NT_SYMBOL_PATH or inside the debugger:
.sympath SRV*C:\SymCache*https://msdl.microsoft.com/download/symbols
.reload /f
dt nt!_PEB @$peb
This caches all downloaded PDBs in C:\SymCache. Vendors can supply private PDBs for their own applications; everything else resolves against Microsoft’s public store.
5. Configuring Kernel Debug Transport
Kernel debugging is off by default and must be explicitly enabled on the target. First, add a virtual serial (COM) port to the target VM in your hypervisor, backed by a named pipe. Then create a dedicated debug boot entry with bcdedit.exe so you never alter the clean boot configuration:
bcdedit.exe /copy {current} /d "LabDebug"
bcdedit.exe /debug {<GUID from above>} on
bcdedit.exe /dbgsettings serial debugport:1 baudrate:115200
bcdedit.exe /copy clones the current boot entry; /debug ... on enables kernel debugging for that entry; /dbgsettings selects the serial transport and baud rate. View global settings any time with bcdedit.exe /dbgsettings.
In WinDbg Preview choose Attach to kernel → COM, match the port and baud rate, then boot the target into the LabDebug entry. Verify the connection and symbols:
.reload
x /f nt!NtCreateProcess*
lm m nt
If nt!NtCreateProcess* resolves and lm m nt shows the kernel module with symbols, the pipe is live. Note that local kernel debugging exists but cannot set breakpoints on drivers — only the remote two-VM model gives you live kernel control.

6. Installing x64dbg and Visual Debuggers
For user-mode work, x64dbg is an excellent open-source visual debugger, shipping as x32dbg (32-bit) and x64dbg (64-bit). Its four-pane layout — disassembly, registers, stack, and memory dump — makes control flow and corruption visible at a glance, which is invaluable before you are fluent in WinDbg’s command language.
A typical first session against a practice target looks like this:
# x64dbg walkthrough (narrative)
1. File -> Attach -> select vulnserver.exe
2. Navigate to the target function in the disassembly pane
3. Press F2 to set a software breakpoint (INT3)
4. Press F9 to run; trigger the command from the client
5. Execution halts; inspect EAX/RIP, the stack pane, and dump
Watching RIP land on attacker-controlled bytes in the stack pane teaches the core idea of control-flow hijack faster than any text dump.
7. Disassemblers: IDA and Ghidra
Debuggers are dynamic (running process); disassemblers are static (the binary at rest). You need both.
| Tool | Role |
|---|---|
IDA Free / IDA Pro | Industry-standard static disassembly; Free edition has feature limits |
Ghidra | NSA open-source disassembler/decompiler; free IDA Pro alternative |
Use Ghidra or IDA to map a binary’s functions, locate parsing routines, and identify candidate vulnerable code paths before you ever attach a debugger. Ghidra’s decompiler output is free and good enough for most lab work; IDA Pro’s analysis depth justifies its cost in professional research.
8. Exploit Assistance: mona.py, PyKD, and boofuzz
mona.py automates the tedious parts of exploit development — cyclic pattern creation, bad-character identification, and ROP gadget discovery. It was born in Immunity Debugger but runs inside WinDbg through two shims.
| Tool | Description |
|---|---|
mona.py | Automates pattern/bad-char/ROP tasks inside WinDbg or Immunity |
PyKD | WinDbg Python bindings; lets mona.py execute inside WinDbg |
windbglib.py | Compatibility layer bridging the ImmLib API gap for WinDbg |
boofuzz | Network fuzzer; the maintained successor to Sulley |
Drop pykd.pyd, windbglib.py, and mona.py where WinDbg can load them, then:
.load pykd.pyd
!py mona
!py mona config -set workingfolder C:\MonaLogs\%p_%i
The %p_%i tokens give each process/instance its own log folder, keeping artifacts from different targets separated.
For crash discovery, install boofuzz with pip install boofuzz. Its bundled process_monitor.py watches the target and reports which input produced a crash, which you then reproduce under the debugger. A minimal structural skeleton against Vulnserver:
from boofuzz import Session, Target, SocketConnection, s_initialize, s_string, s_static

session = Session(target=Target(connection=SocketConnection("192.168.x.x", 9999, proto="tcp")))
# define request blocks (s_initialize / s_static / s_string) here
session.connect(s_get("request_name"))
session.fuzz()
This wires the transport and session only — no weaponised payloads. The fuzzer’s job is to find the crash; the debugger’s job is to understand it.

9. Vulnerable Practice Targets
You need intentionally broken software to practise against.
| Target | Type |
|---|---|
Vulnserver | Multi-threaded Windows TCP server on port 9999 with multiple vulnerable commands |
HEVD (HackSysExtreme Vulnerable Driver) | Vulnerable kernel driver exposing many kernel primitives |
exploit.education / protostar | Linux 32-bit stack fundamentals before moving to Windows |
Vulnserver is the standard introduction to Windows user-mode exploitation — its commands map cleanly to overflow, SEH, and bad-character exercises. HEVD is the kernel counterpart, exposing stack overflows, use-after-free, type confusion, and arbitrary write primitives in a controlled driver. Verify the current HEVD release against the HackSysExtreme GitHub repository before deploying.
10. Understanding and Controlling Mitigations
Modern Windows ships layered exploit mitigations. To learn progressively, you disable them on the lab target VM only and re-enable them one at a time to feel each control’s effect.
| Mitigation | Mechanism | Toggle |
|---|---|---|
| ASLR | Randomises image/stack/heap base addresses | MoveImages=0 in Memory Management; per-PE /DYNAMICBASE |
| DEP / NX | Marks stack/heap non-executable | bcdedit.exe /set nx AlwaysOff |
| SafeSEH | Validates SEH handlers against a table | Compile-time /SAFESEH |
| SEHOP | Runtime SEH chain integrity check | DisableExceptionChainValidation=1 |
| Stack Canaries (GS) | Compiler stack cookie | /GS MSVC flag |
| CFG | Validates indirect call targets | MitigationOptions under kernel |
To disable image ASLR system-wide on the practice target:
:: LAB TARGET VM ONLY — never run this on a production or internet-connected host
reg add "HKLM\SYSTEM\CurrentControlSet\Control\Session Manager\Memory Management" /v MoveImages /t REG_DWORD /d 0 /f
This applies to the lab target VM only. On real systems these mitigations are the defense — you are removing them solely to study the underlying primitive. The Windows Security Exploit Protection panel (and Get-ProcessMitigation / Set-ProcessMitigation) provides per-process and system-wide control. Verify ASLR/SEHOP/DEP key paths against current Microsoft documentation before relying on them.
11. PEB Debugging Awareness and Heap Behaviour
A subtle trap: the debugger changes the target’s behaviour. WinDbg does not write a registry key for heap debug flags — it updates the NtGlobalFlag field in the Process Environment Block (PEB) directly. Loading an executable under a debugger also sets PEB flags that reveal the process is being debugged.
| PEB Field | Offset | Size |
|---|---|---|
BeingDebugged | +0x002 | BYTE |
NtGlobalFlag | +0x068 (x86) / +0x0BC (x64) | ULONG |
Anti-debug logic reads BeingDebugged or NtGlobalFlag to detect you trivially. More dangerously, heap behaviour — chunk sizes, layout, relative distances — differs under a debugger. You can build an exploit that works perfectly attached and fails completely in the wild because the heap state was an artifact of debugging. Always validate final exploits in a non-debugged run. Independently confirm the 32-bit vs. 64-bit PEB offsets against live symbols.

12. Common Attacker Techniques This Lab Lets You Study
This environment exists to study real adversary exploitation primitives safely.
| Technique | Description |
|---|---|
| Stack buffer overflow | Overwrite saved return address to redirect execution |
| SEH overwrite | Corrupt the exception handler chain to gain control |
| ROP chaining | Bypass DEP by reusing executable gadgets |
| Kernel pool corruption | Abuse driver bugs (HEVD) for privilege escalation |
| Bad-character / encoder evasion | Survive input filtering and produce clean shellcode |
MITRE ATT&CK Mapping
| Technique | MITRE ID | Detection |
|---|---|---|
| Exploitation for Client Execution | T1203 | WER crash events; anomalous child processes |
| Exploitation for Privilege Escalation | T1068 | Driver load + token changes; Sysmon EID 6/10 |
| Exploitation for Defense Evasion | T1211 | Unexpected mitigation-policy changes |
| Exploitation for Credential Access | T1212 | Abnormal access to credential stores |
| Exploitation of Remote Services | T1210 | Service crashes; Sysmon EID 1 on spawned shells |
| Exploit Public-Facing Application | T1190 | WAF/IDS alerts; service restart loops |
This tutorial sets up the research environment that lets the series study each of these techniques under controlled conditions.
13. Defensive Strategies & Detection
What This Looks Like to a Defender
Lab tooling generates noisy, recognisable telemetry. Knowing it helps you spot the same activity on a monitored production host.
| Event ID | Description |
|---|---|
| Sysmon EID 1 | Process Create — windbg.exe, x64dbg.exe, bcdedit.exe, msfvenom, Python exploit scripts |
| Sysmon EID 7 | Image Loaded — pykd.pyd loaded into WinDbg; debugger DLL loads |
| Sysmon EID 10 | ProcessAccess — debugger opening a target with PROCESS_VM_READ/WRITE, PROCESS_SUSPEND_RESUME |
| Sysmon EID 13 | RegistryValue Set — bcdedit.exe BCD edits; ASLR/DEP registry changes |
| Sysmon EID 25 | ProcessTampering — memory manipulation context for later tutorials |
A starting Sigma sketch for a debugger attaching to a target process:
title: Debugger Attaching to Vulnerable Practice Target
logsource:
  product: windows
  service: sysmon
detection:
  selection:
    EventID: 10
    TargetImage|endswith: '\vulnserver.exe'
    GrantedAccess:
      - '0x1fffff'   # PROCESS_ALL_ACCESS
      - '0x1010'     # PROCESS_VM_READ | PROCESS_QUERY_LIMITED_INFORMATION
  filter:
    CallTrace|contains: 'UNKNOWN'   # execution from non-mapped memory
  condition: selection and filter
level: medium
Correlate with ETW providers: Microsoft-Windows-Kernel-Process (process/thread lifecycle), Microsoft-Windows-Kernel-Audit-API-Calls (OpenProcess with specific access masks), and Microsoft-Windows-WER (crash events from Vulnserver/HEVD that flag unexpected terminations).
Hardening for production hosts:
- Disable kernel debugging:
bcdedit.exe /debug off; confirm withbcdedit.exe /enum all. - Enforce mitigations via
Set-ProcessMitigationand the Exploit Protection GUI. - Enable VBS / Credential Guard — it blocks kernel-mode code injection on modern Windows, which is exactly why lab kernel targets are older and unpatched.
- Use WDAC to block unsigned debug tools (which is why the lab disables or excepts it).
- Keep the lab adapter Host-Only with no internet routing.
14. Tools for Lab Setup and Analysis
| Tool | Description | Link |
|---|---|---|
| WinDbg / WinDbg Preview | Kernel + user-mode debugging, TTD | microsoft.com |
| x64dbg | Visual open-source user-mode debugger | x64dbg.com |
| Ghidra | Free disassembler/decompiler | ghidra-sre.org |
| IDA Free / Pro | Static disassembly and analysis | hex-rays.com |
| mona.py | Pattern/bad-char/ROP automation | github.com |
| boofuzz | Network fuzzer (Sulley successor) | github.com |
| Vulnserver | Vulnerable TCP practice server | github.com |
| HEVD | Vulnerable kernel driver | github.com |
| Metasploit / MSFVenom | Shellcode generation and testing | metasploit.com |
Summary
- An exploit development lab is two isolated VMs — a debugger and a debuggee — on a Host-Only network, snapshotted before every exercise.
- WinDbg covers both user-mode and kernel-mode; kernel debugging must be enabled with
bcdedit.exeover a virtual serial port and is always done remotely. - mona.py (via PyKD/windbglib), boofuzz, x64dbg, and disassemblers like Ghidra automate discovery and analysis against Vulnserver and HEVD.
- Mitigations (ASLR, DEP, SafeSEH, SEHOP, GS, CFG) are disabled on the lab target only for progressive learning, and the PEB’s
BeingDebugged/NtGlobalFlagfields remind you that debuggers alter target behaviour. - Defenders see this activity through Sysmon EID 1/7/10/13/25, WER crashes, and
OpenProcessaudit ETW — and harden production hosts withbcdedit.exe /debug off, VBS/Credential Guard, and WDAC.
Related Tutorials
- What is Exploit Development?
- Building a Red Team Lab: Infrastructure, VMs, and C2 Setup
- WinDbg Crash Course: Navigation, Commands, and Workflow for Exploit Devs
- Egghunters: Staged Payload Delivery When Buffer Space Is Tight
- Shellcode Encoders: XOR Encoding, Custom Decoders, and Avoiding Bad Chars
References
- MITRE ATT&CK: Develop Capabilities – Exploits (T1587.004)
- Get Started with Windows Debugging (WinDbg) – Microsoft Learn
- Debugging Tools for Windows SDK and WDK (WinDbg Download) – Microsoft Learn
- Corelan Exploit Writing Tutorial Part 1: Stack Based Overflows
- Metasploit Framework – Getting Started (Official Rapid7 Docs)
- Writing an Exploit Module – Metasploit Official Documentation
Get new drops in your inbox
Windows internals, exploit dev, and red-team write-ups — no spam, unsubscribe anytime.