WinDbg Crash Course: Navigation, Commands, and Workflow for Exploit Devs
Objective: Learn to drive WinDbg against a crashing Windows target — configure symbols, attach in all three modes, read a fault from first principles, master every breakpoint type, inspect the heap, and use the
dxdata model and Time Travel Debugging — so you can triage crashes and build the workflow exploitation labs depend on.
1. WinDbg Classic vs. WinDbg Preview — Choosing Your Tool
Two editions share the same dbgeng.dll engine but differ in shell and capabilities.
| Feature | WinDbg Classic | WinDbg Preview (WinDbgX) |
|---|---|---|
| Distribution | Windows SDK / WDK | Microsoft Store (UWP) |
| Layout model | Workspace .wsp files | Modern ribbon UI |
| Time Travel Debugging | No | Yes |
| Underlying engine | dbgeng.dll | dbgeng.dll |
Use WinDbg Preview as your daily driver — the ribbon, source overlay, and Time Travel Debugging (TTD) make crash triage faster. Keep Classic available for headless scripting on stripped-down lab VMs where the Store runtime is unavailable. Kernel debugging over serial/network (bcdedit /debug on) is a separate discipline; this tutorial stays user-mode.
2. Symbol Configuration Done Right
Without symbols, every other command degrades to raw addresses. A PDB (.pdb) file maps human-readable source elements — function names, struct layouts, locals — to addresses in the compiled binary. Symbols are generated at build/link time.
Set the symbol path before you launch via the _NT_SYMBOL_PATH environment variable, or in-session with .sympath.
0:000> .sympath cache*C:\Symbols;srv*https://msdl.microsoft.com/download/symbols
0:000> .reload /f
0:000> lm
.reload loads symbols lazily; .reload /f forces immediate load. When a module shows (deferred) or (export symbols) in lm, symbol resolution failed. Diagnose with !sym noisy, which prints every path the loader probes, then silence it with !sym quiet.
| Command | Purpose |
|---|---|
.sympath | Display / set / append the symbol path |
.reload /f | Force immediate symbol load |
!sym noisy | Verbose symbol-loader trace |
lm | List modules and symbol-load state |
x module!pattern | Resolve a symbol name to an address |
ln address | Find the nearest named symbol to an address |
3. Attaching to a Target: Three Modes
| Mode | How | Use case |
|---|---|---|
| Launch | windbg.exe target.exe | Debug from process start |
| Attach | windbg.exe -p <PID> | Inspect a running process |
| Open dump | windbg.exe -z crash.dmp | Post-mortem analysis |
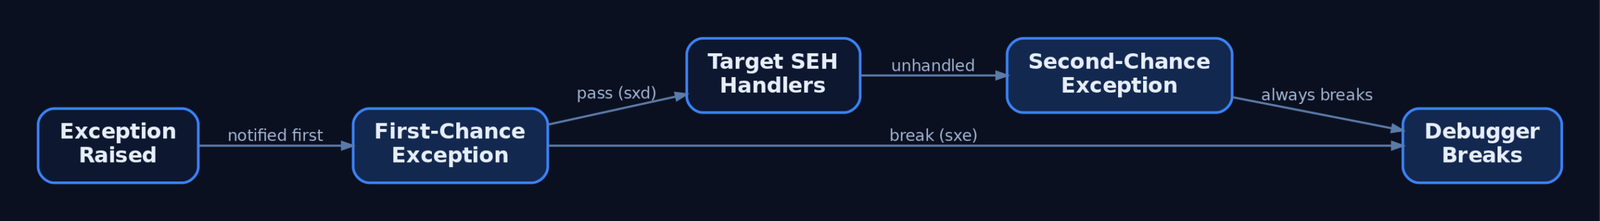
On launch and attach the debugger stops at an initial break before user code runs. The exception model is two-stage: the debugger sees a first-chance exception first, and only if the target’s own handlers do not resolve it does the second-chance exception fire. Control which exceptions break execution with sxe (enable / break), sxd (disable), and sxi (ignore).
0:000> sxe av          ; break on first-chance access violations
0:000> sxe ld:user32   ; break when user32 loads
0:000> g
The sxe ld / g idiom is the canonical way to break exactly when a target module maps into the address space — essential for setting breakpoints on code that is not yet present.
4. The Essential Command Vocabulary
Execution control, register/stack inspection, and memory display form the core loop.
| Command | What it does |
|---|---|
g (F5) | Continue execution of the debuggee |
p / t | Step over / step into |
gu | Execute until the current function returns |
pt / wt | Step to next ret / trace-and-watch a call tree |
r | Display all general-purpose registers |
k / kb / kp | Stack trace; kb adds first 3 args; kp adds typed parameters |
lm / u / uf | List modules / disassemble / disassemble full function |
Memory display and edit commands follow a consistent type-suffix grammar:
| Command | What it does |
|---|---|
db / dw / dd / dq | Display bytes / words / DWORDs / QWORDs |
da / du | Display ASCII / Unicode string |
dp / dv | Display pointer-sized values / local variables |
dt module!Type [addr] | Dump a typed struct (e.g. dt ntdll!_PEB @$peb) |
!peb / !teb | Dump the Process / Thread Environment Block |
eb / ew / ed / eq | Edit byte / word / DWORD / QWORD |
ea / eu | Write ASCII / Unicode characters to an address |
s -d start end value | Search memory for a pattern over a range |
!address | Show virtual mapping, permissions, and region type |
A typical inspection sequence at a fault reads registers, walks the stack, then dumps memory at the stack pointer:
0:000> r
0:000> k
0:000> dd esp L8
0:000> dt ntdll!_EXCEPTION_RECORD @$exr
5. Crash Triage: Reading a Fault from First Principles
When a target faults, the debugger lands on the faulting instruction with an exception record describing the cause. !analyze -v automates first-pass triage, emitting the faulting IP, the decoded exception, the stack, and a probable root cause.
0:000> !analyze -v
FAULTING_IP:
 vuln!process_packet+0x4a
0040124a 8801            mov     byte ptr [ecx],al
EXCEPTION_RECORD:  (.exr -1)
ExceptionCode: c0000005 (Access violation)
ExceptionAddress: 0040124a
EXCEPTION_PARAMETER[1]: 41414141     ; attacker-controlled write target
STACK_TEXT:
0019f7c0 41414141 41414141 41414141 vuln!process_packet+0x4a
Read it methodically: FAULTING_IP is the instruction that trapped; the [ecx] write target of 41414141 (“AAAA”) signals attacker-controlled memory. A corrupted STACK_TEXT full of 41414141 indicates a saved-return-address overwrite. Decode any NTSTATUS with !error 0xC0000005. The MSEC !exploitable extension applies heuristics to estimate exploitability classification — load it with .load msec.dll first.
For Structured Exception Handler overwrites, !exchain walks the handler chain:
0:000> !exchain
0019ffdc: 41414141     ; handler overwritten with attacker bytes
Invalid exception stack at 41414141
A handler pointer of 41414141 confirms an SEH overwrite primitive.
6. Breakpoint Mastery
WinDbg distinguishes software breakpoints (bp, patch an int 3) from hardware breakpoints (ba, debug registers — they trap reads/writes/executes without modifying code).
| Command | What it does |
|---|---|
bp module!func | Software breakpoint, resolved immediately |
bu module!func | Unresolved — arms when the module loads |
bm module!pattern* | Breakpoint on all symbols matching a pattern |
ba r4 addr | Hardware breakpoint: read 4 bytes (ba e1 = execute, ba w4 = write) |
bp /1 addr | One-shot breakpoint, auto-clears after firing |
bl / bd N / be N / bc * | List / disable / enable / clear all breakpoints |
Attach a command string that runs automatically on each break, chaining with ;:
0:000> bu kernel32!WriteFile "k; r eax; g"
0:000> ba w4 0019f7c0 "!address @rip; g"
Use hit-count throttling to avoid output floods on hot paths, and dx query expressions for true conditional breakpoints:
0:000> bp /5 `vuln!net.c:385` "!teb; k; g"
0:000> bp /w "dx ((int)@ecx) == 0x41414141" vuln!process_packet
The bp /w form breaks only when the expression evaluates true — far cheaper than breaking and manually re-continuing.
7. Heap Internals Inspection
Heap corruption — use-after-free, overflow into adjacent chunks — is where most modern exploitation lives. The !heap extension family exposes chunk headers and allocation state.
| Command | What it does |
|---|---|
!heap -s | Summary of all heaps |
!heap -flt s 0x80 | Show all allocations of size 0x80 |
!heap -p -all | Walk all allocations in all heaps |
!heap -l | Detect leaked heap blocks |
0:000> !heap -s
0:000> !heap -flt s 0x80      ; isolate chunks of a target size class
0:000> !heap -p -all          ; correlate chunks to allocation call sites
Filtering by size class isolates the chunks an attacker grooms; !heap -p -all ties each block back to its allocation stack, which is how you identify the object straddling a corrupted boundary.
8. The dx Data Model and Scripting
The dx (Debugger Object Model) command exposes debugger state as queryable objects with a LINQ-style syntax — ideal for filtering large outputs and building conditions.
0:000> dx @$curprocess.Modules
0:000> dx @$curthread.Stack.Frames.Select(f => f.Attributes.InstructionOffset)
0:000> dx Debugger.Utility.Control.ExecuteCommand("k")
Debugger.Utility.Control.ExecuteCommand runs any legacy command from inside a dx query, enabling hybrid scripts that mix object queries with classic extensions. Load JavaScript automation with .scriptload script.js and invoke it with .scriptrun.
9. Time Travel Debugging for Exploit Devs
TTD records a full execution trace you can replay forward and backward, then query as data. It is the single biggest accelerator for root-causing memory corruption, because you can step backward from the crash to the write that caused it. WinDbgX must run as Administrator, and TTD is user-mode only in the current public build.
Recording produces a .run trace file. Open it and navigate with the reverse-execution commands:
| Command | What it does |
|---|---|
!tt 0:0 | Jump to a trace position (here, rewind to start) |
g- / p- / t- | Reverse continue / step / trace |
dx @$cursession.TTD.Calls("module!func") | Query every call to a function across the trace |
0:000> !tt 0:0
0:000> dx @$cursession.TTD.Calls("ntdll!RtlAllocateHeap")
0:000> g-     ; reverse-continue to the write that preceded the corruption
The workflow for a heap-corruption case: record to crash, query RtlAllocateHeap/RtlFreeHeap calls to find the freed chunk, set a write watchpoint on it, and g- backward to the exact instruction that wrote out of bounds.

10. Automation and Crash Triage Pipelines
For fuzzer integration, drive WinDbg headlessly with -c startup commands and -logo logging. A minimal triage script:
sxe av; g; !analyze -v; .logclose; qWrap it from any orchestrator:
import subprocess, re

cmds = 'sxe av; g; !analyze -v; .logclose; q'
subprocess.run(['windbg.exe', '-c', cmds, '-logo', 'out.txt', 'target.exe'])

log = open('out.txt', encoding='utf-8', errors='ignore').read()
m = re.search(r'FAULTING_IP:\s*\n(.+)', log)
print('Fault:', m.group(1).strip() if m else 'no crash')
.logopen / .logclose tee session output to disk for later parsing, turning every fuzzer crash into a structured triage record.
11. Common Attacker Techniques
WinDbg is a defensive and authorized-testing tool, but the APIs it relies on overlap heavily with adversary tradecraft — which is precisely why studying it teaches you the telemetry attackers generate.
| Technique | Description |
|---|---|
| Process attach | OpenProcess(PROCESS_ALL_ACCESS) + DebugActiveProcess mirror injection-stager behavior |
| Memory read/write | ReadProcessMemory / WriteProcessMemory underpin both debugging and code patching |
| Module enumeration | lm, !peb, !teb mirror malware’s runtime module/OS reconnaissance |
| Exploitability triage | !analyze -v, !exploitable, !exchain are used to weaponize crashes |
| TTD trace harvesting | .run files capture sensitive in-memory data during analysis |
An attacker reading LSASS or another process under the same primitives that WinDbg uses generates near-identical handle and memory-access telemetry — so the defender who understands WinDbg understands the indicators.
12. Defensive Strategies & Detection
Debugger activity is observable through process-creation, handle-access, and named-pipe telemetry.
| Sysmon Event ID | Relevance |
|---|---|
| Event ID 1 (Process Create) | windbg.exe / windbgx.exe launch; command line reveals -p PID attach or -z dump |
| Event ID 10 (ProcessAccess) | Attach yields OpenProcess with GrantedAccess: 0x1fffff; SourceImage is windbg.exe |
| Event ID 8 (CreateRemoteThread) | Debugger-injection / anti-anti-debug patterns |
| Event ID 17/18 (Pipe Create/Connect) | Kernel debugging over \\.\pipe\... |
Behavioral indicators for blue teams: windbg.exe -p <PID> on the command line (live attach), presence of dbgsrv.exe / ntsd.exe (remote/headless debug server), msec.dll loaded into a session (active exploitability assessment), and .run TTD trace files written to disk.
A Sigma rule for full-access process attach by a debugger:
title: Debugger Full-Access Attach to Process
logsource:
  product: windows
  service: sysmon
detection:
  selection:
    EventID: 10
    SourceImage|endswith:
      - '\windbg.exe'
      - '\windbgx.exe'
    GrantedAccess: '0x1fffff'
  condition: selection
level: medium
Pair Sysmon with the Microsoft-Windows-Kernel-Process ETW provider and Security Event 4688 (enable Audit Process Creation with command-line capture). Restrict SeDebugPrivilege on production hosts so non-admins cannot attach to other users’ or SYSTEM processes, and never expose kernel-debug ports on networked machines.
MITRE ATT&CK Mapping
| Technique | MITRE ID | Detection |
|---|---|---|
| Native API | T1106 | EDR hooks on OpenProcess / ReadProcessMemory |
| Process Injection | T1055 | Sysmon Event ID 10, GrantedAccess masks |
| Process Injection: DLL Injection | T1055.001 | LdrLoadDll / .load activity in traces |
| Debugger Evasion | T1622 | IsDebuggerPresent / heap-flag / timing probes |
| OS Credential Dumping | T1003 | Handle access to lsass.exe (authorized DFIR only) |
| System Information Discovery | T1082 | !peb / !teb / lm-equivalent runtime recon |
13. Tools for WinDbg Analysis
| Tool | Description | Link |
|---|---|---|
| WinDbg Preview | Modern debugger with TTD | microsoft.com |
| WinDbg Classic | SDK/WDK debugger for headless scripting | microsoft.com |
| Process Hacker | Live handle / memory inspection | processhacker.sourceforge.io |
| Process Monitor | File / registry / process tracing | live.sysinternals.com |
| x64dbg | User-mode disassembler-debugger | x64dbg.com |
| Ghidra | Static reverse engineering | ghidra-sre.org |
| Volatility | Memory-forensics framework | volatilityfoundation.org |
msec.dll (!exploitable) | Heuristic exploitability triage | MSEC release |
14. Summary
- WinDbg is the exploit developer’s primary lens into a faulting Windows process — and mastering it means mastering the telemetry attackers generate.
- Correct symbol configuration (
.sympath,.reload /f,!sym noisy) is the prerequisite that makes every other command meaningful. !analyze -v,!exchain, and!heapturn a raw access violation into a root-caused, classified crash;dxqueries and TTD let you step backward to the exact corrupting write.- Master all breakpoint types —
bp,bu,bm, hardwareba, one-shot/1, command anddx-conditional breaks — to control execution precisely. - Detect debugger and attach activity via Sysmon Event ID 1 and 10 (
GrantedAccess: 0x1fffff), Event 4688 command-line auditing, and restrictedSeDebugPrivilegeon production hosts.
Related Tutorials
- Setting Up Your Exploit Development Lab (VMs, Debuggers, Tools)
- What is Exploit Development?
- Egghunters: Staged Payload Delivery When Buffer Space Is Tight
- Shellcode Encoders: XOR Encoding, Custom Decoders, and Avoiding Bad Chars
- Position-Independent Code: Writing PIC Shellcode Without Hardcoded Addresses
References
- Get Started with WinDbg User-Mode Debugger – Microsoft Learn
- Using Debugger Commands (WinDbg) – Microsoft Learn
- bp, bu, bm (Set Breakpoint) – Microsoft Learn
- Processor Breakpoints (ba Breakpoints) – Microsoft Learn
- MITRE ATT&CK T1587.004 – Develop Capabilities: Exploits
- Debugging – WinDBG & WinDBGX Fundamentals – Corelan Exploit Development & Vulnerability Research