Introduction to Atomic Red Team: Installation, Structure, and Running Your First Atomic Test
Most detection content ships on faith. Someone writes a Sigma rule for base64-encoded PowerShell, it clears review, it lands in the SIEM — and then nobody ever fires the technique at it to confirm the alert actually triggers. The gap between “the rule exists” and “the rule works” is where breaches live.
Atomic Red Team (ART) closes it. It’s a library of small, single-technique tests mapped to MITRE ATT&CK, plus a PowerShell harness that runs them on demand. You execute one technique, watch your telemetry, confirm the alert — or discover its absence — and tune. For a detection engineer it’s the highest-leverage tool on the shelf: cheap to run, fast to iterate, honest about coverage.
This walkthrough takes you from an empty Windows lab VM to a clean install, through how the project is laid out on disk, to a full run of your first atomic — execute, observe, clean up — with blue-team validation wired into every step.
Contents
- 1 1. What Atomic Red Team Is and Why Blue Teams Use It
- 2 2. Lab Environment and Safety Requirements
- 3 3. Installing the Execution Framework (invoke-atomicredteam)
- 4 4. Installing the Atomics Folder
- 5 5. Anatomy of an Atomic Test (YAML Deep-Dive)
- 6 6. Discovering and Inspecting Atomic Tests
- 7 7. Running Your First Atomic Test (Step-by-Step)
- 8 8. Reading and Correlating Telemetry
- 9 9. Customising Tests: -InputArgs, GUIDs, and Names
- 10 10. Execution Logging and the Attire Logger
- 11 11. The Detection Engineering Feedback Loop
- 12 Recap
- 13 Related Tutorials
- 14 References
1. What Atomic Red Team Is and Why Blue Teams Use It
Adversary emulation and red teaming both exercise your defenses, but they aren’t the same job. A red team operates like an opponent — open-ended objectives, stealth, whatever path works. Emulation is narrower and repeatable: you reproduce specific, documented attacker behaviors, usually pinned to ATT&CK, to measure whether your controls see them. ART lives firmly on the emulation side, at the most granular end of it.
Compare it to Caldera, which chains techniques into autonomous full-attack operations. ART does the opposite on purpose — each test is atomic: one technique, few dependencies, run and done. That granularity is the whole value. When an alert fails to fire, you know exactly which technique slipped past, because you only ran one.
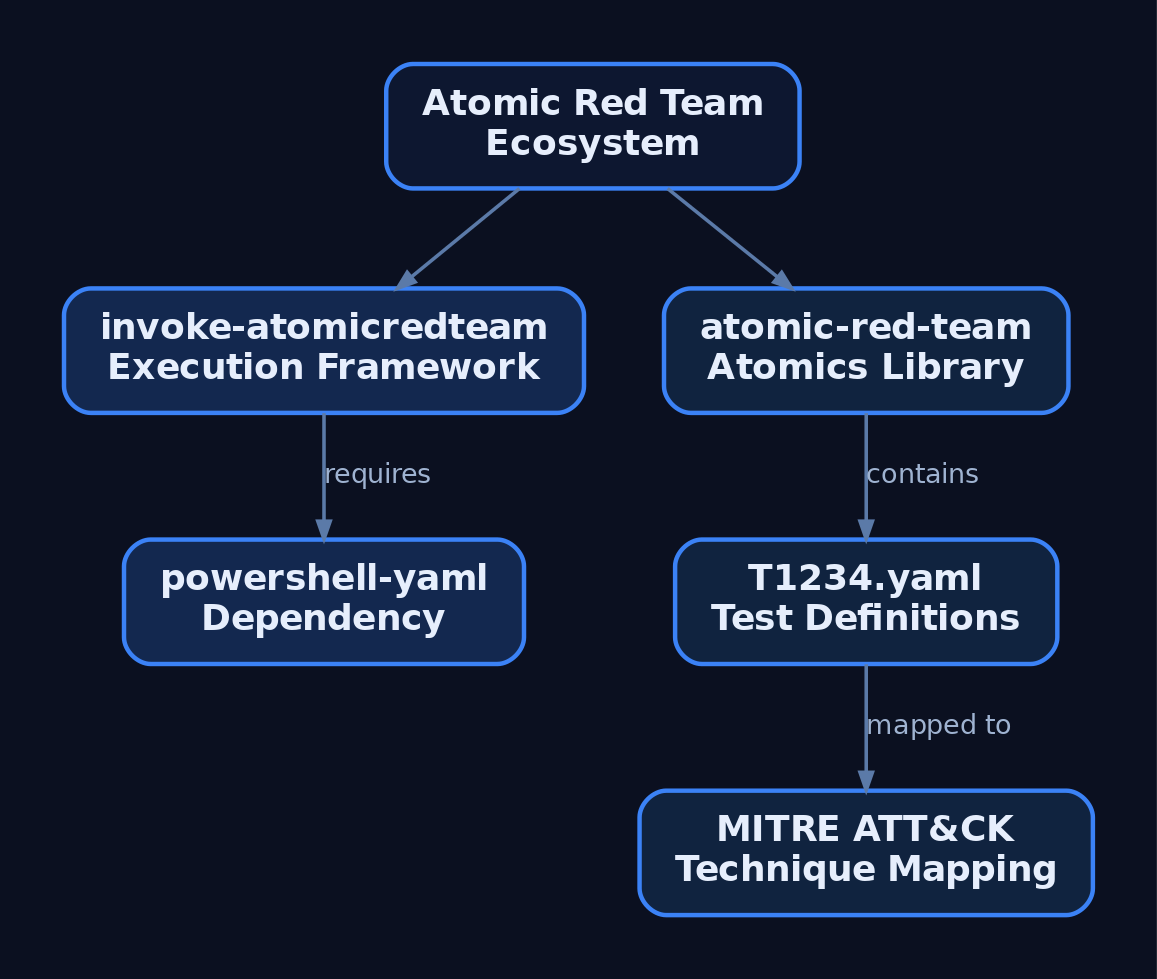
The project ships as two independent GitHub repositories that install separately by default.
| Repository | Role |
|---|---|
invoke-atomicredteam | The execution framework — a PowerShell module that runs tests defined in the atomics library |
atomic-red-team | The atomics library — focused, low-dependency tests in a structured YAML format consumed by automation frameworks |
You install the framework first, then the atomics. There’s a deliberate reason they’re decoupled, and it has to do with antivirus — covered in §4.
2. Lab Environment and Safety Requirements
Read this before the install command. Many atomics perform genuinely malicious actions — dumping LSASS, writing Run keys, spawning encoded shells. These are real TTPs, executed for real. Run them only on an isolated VM you can roll back. Never on production, never on a domain you care about.
| Requirement | Why |
|---|---|
| Isolated Windows 10/11 VM (Hyper-V, VMware, or VirtualBox) | A disposable target you can snapshot before each run and roll back after |
| Sysmon deployed (SwiftOnSecurity or Olaf Hartong config) | Primary telemetry layer for validating ART behavior |
| Winlogbeat / NXLog forwarding to Splunk / ELK / Wazuh (or Event Viewer for intro-level work) | A place to actually observe the telemetry your tests generate |
AV / Defender exclusion for C:\AtomicRedTeam\ on the lab VM only | The atomics folder contains many files that trigger AV; exclusion prevents quarantine |
| No internet-facing exposure; no domain production systems | Many tests perform real malicious actions and must be contained |
Snapshot the VM before each test run, and run -Cleanup after every test. Confirm your collection/EDR is in place and the endpoint is checking in before you fire anything — the point is to validate detection, not just to execute.
3. Installing the Execution Framework (invoke-atomicredteam)
There are two install paths. The PowerShell Gallery route is cleanest; the direct-install one-liner is handy when you also want the atomics in a single step.
Option A — PowerShell Gallery (run PowerShell as Administrator):
Install-Module -Name invoke-atomicredteam,powershell-yaml -Scope CurrentUser -Force
This pulls the execution framework and the powershell-yaml dependency, which parses the YAML test definitions. The framework cannot read tests without it.
Option B — Direct install (framework + atomics in one shot):
IEX (IWR 'https://raw.githubusercontent.com/redcanaryco/invoke-atomicredteam/master/install-atomicredteam.ps1' -UseBasicParsing)
Install-AtomicRedTeam -getAtomics -Force
If you import the module and hit an error saying it “cannot be loaded because running scripts is disabled on this system,” your execution policy is blocking it. Restart with powershell -exec bypass or otherwise relax the policy on the lab VM.
Configure the session (add this to your PowerShell profile for persistence):
Import-Module "C:\AtomicRedTeam\invoke-atomicredteam\Invoke-AtomicRedTeam.psd1" -Force
$PSDefaultParameterValues = @{
    "Invoke-AtomicTest:PathToAtomicsFolder" = "C:\AtomicRedTeam\atomics"
}
Setting $PSDefaultParameterValues means you never have to pass -PathToAtomicsFolder on every call.
4. Installing the Atomics Folder
Installing the framework does not download the atomics by default. That decoupling is intentional: the atomics folder contains many files likely to trigger AV alerts on the endpoint, so Red Canary leaves it as a separate, deliberate step.
If you didn’t use the -getAtomics flag in Option B, pull the atomics on their own:
Install-AtomicsFolder
The recommended approach is to whitelist the install directory — C:\AtomicRedTeam\ by default — so files aren’t quarantined or removed.
Once installed, the C:\AtomicRedTeam folder contains three folders: atomics, ExternalPayloads, and invoke-atomicredteam.
C:\AtomicRedTeam\
├── atomics\
│   ├── T1059.001\
│   │   ├── T1059.001.yaml      ← machine-readable test definitions
│   │   ├── T1059.001.md        ← human-readable mirror
│   │   ├── src\                ← human-readable payloads
│   │   └── bin\                ← compiled/binary payloads
│   ├── Indexes\                ← index.yaml, CSV, Navigator layers
│   └── used_guids.txt
├── invoke-atomicredteam\
│   └── Invoke-AtomicRedTeam.psd1
└── ExternalPayloads\           ← prereq downloads land here
The layout is rigidly predictable: one directory per ATT&CK technique named T1234, with all atomic tests for that technique in a T1234.yaml file inside it, alongside any payloads and supporting material. External dependencies fetched via the prereq_commands YAML key land in the ExternalPayloads directory.
5. Anatomy of an Atomic Test (YAML Deep-Dive)
Open C:\AtomicRedTeam\atomics\T1059.001\T1059.001.yaml. Every atomic test is defined in a structured YAML format that includes everything needed to understand and execute it.
The top-level keys:
| YAML Field | Purpose |
|---|---|
attack_technique | The MITRE ATT&CK technique ID (e.g., T1059.001) |
display_name | Human-readable name of the technique |
atomic_tests | An array of individual test implementations |
Each element of atomic_tests contains:
| YAML Field | Purpose |
|---|---|
name | Human-readable test name |
auto_generated_guid | Unique UUID per test (auto-generated by GitHub Actions on PR merge) |
description | What the test simulates |
supported_platforms | List: windows, linux, macos |
input_arguments | Named parameters with description, type, default |
dependency_executor_name | Executor for prereq commands (powershell, sh, cmd) |
dependencies | Array of { description, prereq_command, get_prereq_command } |
executor | Object: { name, command, cleanup_command, elevation_required } |
Valid executor.name values are powershell, cmd, sh, bash, and manual. For the powershell executor, all commands run as a script block, and that script block must return 0 for the test to be counted as a success. The parallel T1059.001.md file is just a human-readable mirror of the same data — useful for reading, not for automation.
6. Discovering and Inspecting Atomic Tests
Nothing here executes anything — these switches only read metadata.
# List ALL tests available for this platform (brief)
Invoke-AtomicTest All -ShowDetailsBrief

# Inspect all tests for T1059.001 in detail (no execution)
Invoke-AtomicTest T1059.001 -ShowDetails

# List just test names/numbers for T1059.001
Invoke-AtomicTest T1059.001 -ShowDetailsBrief
-ShowDetailsBrief lists test names and numbers; -ShowDetails prints full metadata including commands and prereqs. The Indexes\ folder also ships an ATT&CK Navigator layer you can load to visualize your coverage.
Key parameters you’ll lean on throughout:
| Parameter | Behavior |
|---|---|
-ShowDetailsBrief | Lists test names/numbers for a technique without executing |
-ShowDetails | Prints full test metadata without executing |
-CheckPrereqs | Evaluates prereq_command for each dependency; reports pass/fail |
-GetPrereqs | Runs get_prereq_command to satisfy dependencies automatically |
-TestNumbers | Targets specific test number(s) within a technique |
-TestNames | Targets test(s) by exact name string |
-TestGuids | Targets test(s) by GUID |
-InputArgs | Overrides default input_arguments values (hashtable) |
-Cleanup | Runs the test’s cleanup_command |
-ExecutionLogPath | Writes execution log to a specified path |
-Session | Runs the test on a remote machine via PowerShell Remoting |
7. Running Your First Atomic Test (Step-by-Step)
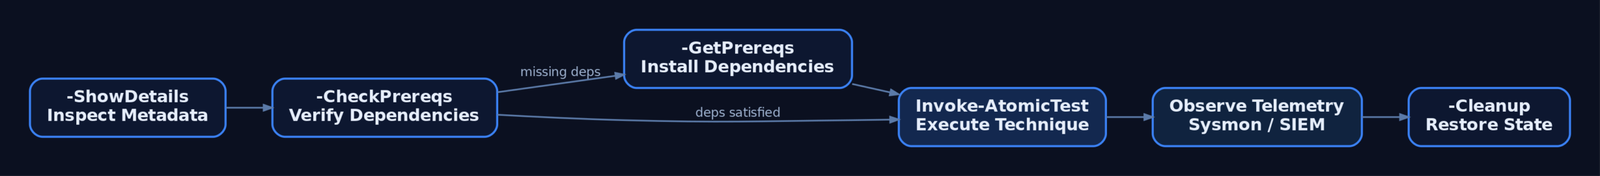
We’ll run T1059.001 test #1 — PowerShell encoded command execution, a real adversary TTP. The workflow is always: inspect → check prereqs → get prereqs → execute → observe telemetry → clean up.
Pre-flight: check and satisfy prerequisites.
Invoke-AtomicTest T1059.001 -TestNumbers 1 -CheckPrereqs
Invoke-AtomicTest T1059.001 -TestNumbers 1 -GetPrereqs
-CheckPrereqs evaluates each dependency’s prereq_command and reports pass/fail; -GetPrereqs runs the get_prereq_command to install anything missing.
Execute the atomic:
Invoke-AtomicTest T1059.001 -TestNumbers 1
Clean up afterward:
Invoke-AtomicTest T1059.001 -TestNumbers 1 -Cleanup
One crucial detail: execution is only logged when the attack commands actually run — not when you use the -ShowDetails, -CheckPrereqs, -GetPrereqs, or -Cleanup switches.
8. Reading and Correlating Telemetry
The instant the test runs, pivot to your telemetry. This is the half of the exercise that matters.
For the T1059.001 encoded-command test, look for:
- Sysmon Event ID 1 (Process Create) —
powershell.exewith-EncodedCommandin theCommandLinefield. Key fields:Image,CommandLine,ParentImage,User. - Windows Security Event ID 4688 (Process Creation) — requires “Audit Process Creation” plus command-line auditing enabled via GPO.
- PowerShell Script Block Logging (Event ID 4104) from the
Microsoft-Windows-PowerShellprovider (GUIDA0C1853B-5C40-4B15-8766-3CF1C58F985A) — captures the decoded/obfuscated script content.
Different technique classes light up different Sysmon IDs. For the registry persistence atomic T1547.001-3, three Sysmon event IDs fire: 1 (process create), 11 (file create), and 13 (registry value set). That process-create + file-create + registry-value-set pattern is typical of persistence-class atomics, and it’s why Sysmon is the primary telemetry layer for ART validation.
| Sysmon Event ID | Name | ART Relevance |
|---|---|---|
| 1 | Process Create | powershell.exe/cmd.exe and child processes |
| 3 | Network Connect | C2/download atomics (DestinationIp, DestinationPort) |
| 7 | Image Loaded | DLL-load atomics |
| 10 | Process Access | LSASS-access atomics (T1003.001) |
| 11 | File Create | Dropped payloads / dumps |
| 12 / 13 | Registry Add-Delete / Value Set | Registry persistence (T1547.001), TargetObject |
Audit policy prerequisites (GPO): enable Audit Process Creation (Success) under Detailed Tracking, and enable Include command line in process creation events under Administrative Templates → System → Audit Process Creation.
9. Customising Tests: -InputArgs, GUIDs, and Names
Override a test’s default input_arguments to make it look more like a real intrusion:
Invoke-AtomicTest T1059.001 -TestNumbers 1 -InputArgs @{
    "encoded_command" = "<your_base64_string>"
}
For reproducibility across teams, target a test by its auto_generated_guid rather than by number (numbers can shift as tests are added):
Invoke-AtomicTest T1059.001 -TestGuids <guid>
Invoke-AtomicTest T1059.001 -TestNames "Mimikatz"
You can also drive execution onto a separate lab VM over PowerShell Remoting (WinRM enabled on the target):
$session = New-PSSession -ComputerName "LabVM02"
Invoke-AtomicTest T1059.001 -TestNumbers 1 -Session $session
10. Execution Logging and the Attire Logger
By default, execution details are written to Invoke-AtomicTest-ExecutionLog.csv in the temp directory ($env:TEMP). Override it with -ExecutionLogPath:
Import-Csv $env:TEMP\Invoke-AtomicTest-ExecutionLog.csv | Out-GridView

Invoke-AtomicTest T1059.001 -TestNumbers 1 -ExecutionLogPath "C:\Temp\art-T1059.001.csv"
For richer, machine-consumable output, select an alternate logger with -LoggingModule — the Attire JSON logger feeds purple-team tooling like Vectr:
Invoke-AtomicTest T1059.001 -TestNumbers 1 -LoggingModule "Attire-ExecutionLogger"
There’s also a "WinEvent-ExecutionLogger" that writes to the Windows Event Log, and -NoExecutionLog to suppress disk logging entirely.
11. The Detection Engineering Feedback Loop
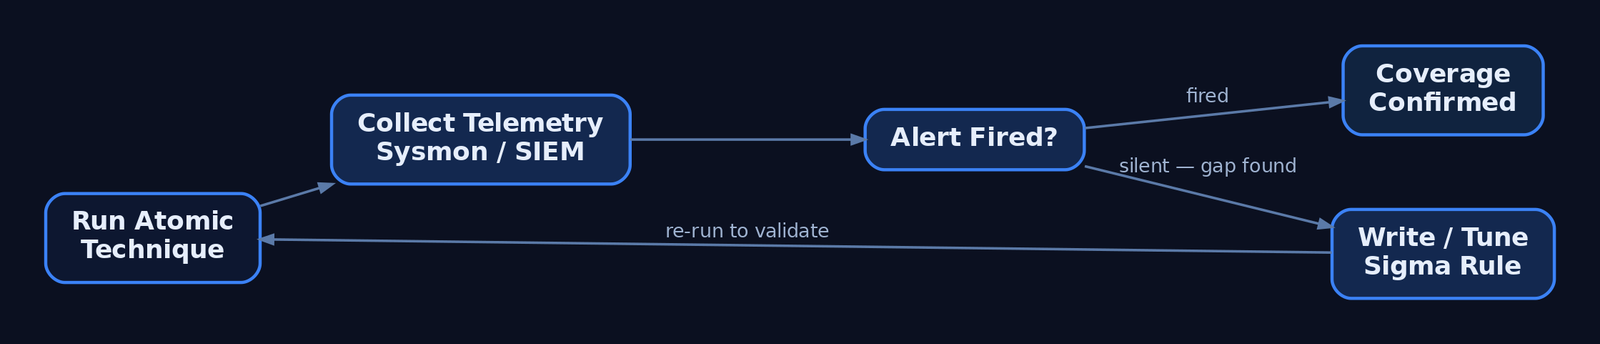
This is where ART pays off. You ran T1059.001, you watched Sysmon EID 1, and you asked one question: did my detection fire?
If it didn’t, you’ve found a coverage gap. Write or tighten a Sigma rule against the exact fields the test exercised:
detection:
  selection:
    EventID: 1
    Image|endswith: '\powershell.exe'
    CommandLine|contains:
      - '-EncodedCommand'
      - '-enc '
      - '-ec '
  condition: selection
logsource:
  category: process_creation
  product: windows
Key Sigma fields you’ll reach for: Image, CommandLine, ParentImage, ParentCommandLine, User, TargetObject (registry), TargetFilename (file).
Deploy the rule, re-run the atomic, confirm the alert fires. That run → observe → tune → re-run cycle is purple teaming. The atomics that map cleanly to ATT&CK make it easy to track coverage technique by technique.
Relevant ATT&CK techniques for early practice:
| Technique ID | Name |
|---|---|
| T1059.001 | Command and Scripting Interpreter: PowerShell |
| T1059.003 | Command and Scripting Interpreter: Windows Command Shell |
| T1547.001 | Boot or Logon Autostart Execution: Registry Run Keys / Startup Folder |
| T1053.005 | Scheduled Task/Job: Scheduled Task |
| T1003.001 | OS Credential Dumping: LSASS Memory |
| T1566.001 | Phishing: Spearphishing Attachment |
Recap
You installed the two decoupled repositories — the invoke-atomicredteam execution framework and the atomic-red-team atomics library — into C:\AtomicRedTeam\ on an isolated VM, with powershell-yaml for parsing and an AV exclusion to keep the atomics intact. You learned the disk layout (T1234\T1234.yaml per technique), dissected an atomic’s YAML (attack_technique, auto_generated_guid, input_arguments, dependencies, executor), and ran a full workflow against T1059.001: inspect with -ShowDetails, pre-flight with -CheckPrereqs/-GetPrereqs, execute, correlate Sysmon EID 1 and Security EID 4688, then -Cleanup.
The execution is the easy half. The discipline is the feedback loop: every test run is a question to your detections, and the honest answer — fired or silent — is the whole reason ART earns its place on the shelf. Snapshot, run one technique, watch the telemetry, tune, repeat.
Related Tutorials
- Introduction to MITRE ATT&CK: Structure, Tactics, Techniques, and Sub-Techniques
- Building a Red Team Lab: Infrastructure, VMs, and C2 Setup
- APT Profiling: How to Build a Comprehensive Adversary Profile from Open-Source Intelligence
- Writing Your First Shellcode: x86 Reverse Shell from Scratch
- Mapping CTI Reports to ATT&CK TTPs: A Step-by-Step Methodology
References
- [Sysmon deployed with a SwiftOnSecurity
- raw.githubusercontent.com
- github.com
- github.com
- github.com
- www.atomicredteam.io
- www.atomicredteam.io
- github.com
Get new drops in your inbox
Windows internals, exploit dev, and red-team write-ups — no spam, unsubscribe anytime.