WinDbg Crash Course: Navigation, Commands, and Workflow for Exploit Devs
Objective: Learn to drive WinDbg against a crashing Windows target — configure symbols, attach in all three modes, read a fault from first principles, master every breakpoint type, inspect the heap, and use the
dxdata model and Time Travel Debugging — so you can triage crashes and build the workflow exploitation labs depend on.
1. WinDbg Classic vs. WinDbg Preview — Choosing Your Tool
Two editions share the same dbgeng.dll engine but differ in shell and capabilities.
| Feature | WinDbg Classic | WinDbg Preview (WinDbgX) |
|---|---|---|
| Distribution | Windows SDK / WDK | Microsoft Store (UWP) |
| Layout model | Workspace .wsp files | Modern ribbon UI |
| Time Travel Debugging | No | Yes |
| Underlying engine | dbgeng.dll | dbgeng.dll |
Use WinDbg Preview as your daily driver — the ribbon, source overlay, and Time Travel Debugging (TTD) make crash triage faster. Keep Classic available for headless scripting on stripped-down lab VMs where the Store runtime is unavailable. Kernel debugging over serial/network (bcdedit /debug on) is a separate discipline; this tutorial stays user-mode.
2. Symbol Configuration Done Right
Without symbols, every other command degrades to raw addresses. A PDB (.pdb) file maps human-readable source elements — function names, struct layouts, locals — to addresses in the compiled binary. Symbols are generated at build/link time.
Set the symbol path before you launch via the _NT_SYMBOL_PATH environment variable, or in-session with .sympath.
0:000> .sympath cache*C:\Symbols;srv*https://msdl.microsoft.com/download/symbols
0:000> .reload /f
0:000> lm
.reload loads symbols lazily; .reload /f forces immediate load. When a module shows (deferred) or (export symbols) in lm, symbol resolution failed. Diagnose with !sym noisy, which prints every path the loader probes, then silence it with !sym quiet.
| Command | Purpose |
|---|---|
.sympath | Display / set / append the symbol path |
.reload /f | Force immediate symbol load |
!sym noisy | Verbose symbol-loader trace |
lm | List modules and symbol-load state |
x module!pattern | Resolve a symbol name to an address |
ln address | Find the nearest named symbol to an address |
3. Attaching to a Target: Three Modes
| Mode | How | Use case |
|---|---|---|
| Launch | windbg.exe target.exe | Debug from process start |
| Attach | windbg.exe -p <PID> | Inspect a running process |
| Open dump | windbg.exe -z crash.dmp | Post-mortem analysis |
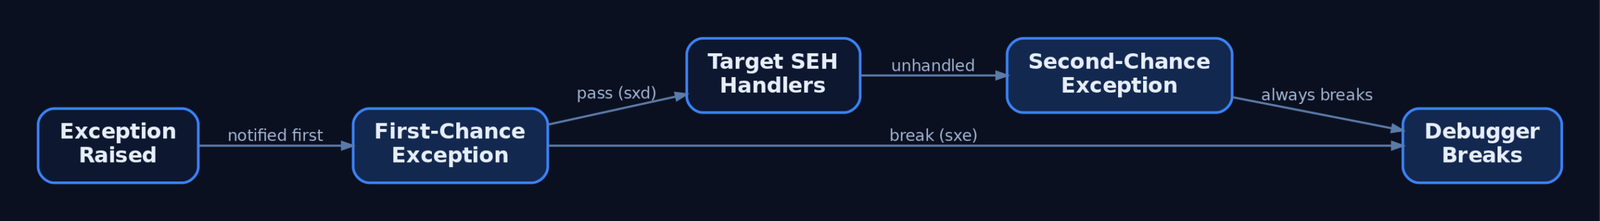
On launch and attach the debugger stops at an initial break before user code runs. The exception model is two-stage: the debugger sees a first-chance exception first, and only if the target’s own handlers do not resolve it does the second-chance exception fire. Control which exceptions break execution with sxe (enable / break), sxd (disable), and sxi (ignore).
0:000> sxe av          ; break on first-chance access violations
0:000> sxe ld:user32   ; break when user32 loads
0:000> g
The sxe ld / g idiom is the canonical way to break exactly when a target module maps into the address space — essential for setting breakpoints on code that is not yet present.
4. The Essential Command Vocabulary
Execution control, register/stack inspection, and memory display form the core loop.
| Command | What it does |
|---|---|
g (F5) | Continue execution of the debuggee |
p / t | Step over / step into |
gu | Execute until the current function returns |
pt / wt | Step to next ret / trace-and-watch a call tree |
r | Display all general-purpose registers |
k / kb / kp | Stack trace; kb adds first 3 args; kp adds typed parameters |
lm / u / uf | List modules / disassemble / disassemble full function |
Memory display and edit commands follow a consistent type-suffix grammar:
| Command | What it does |
|---|---|
db / dw / dd / dq | Display bytes / words / DWORDs / QWORDs |
da / du | Display ASCII / Unicode string |
dp / dv | Display pointer-sized values / local variables |
dt module!Type [addr] | Dump a typed struct (e.g. dt ntdll!_PEB @$peb) |
!peb / !teb | Dump the Process / Thread Environment Block |
eb / ew / ed / eq | Edit byte / word / DWORD / QWORD |
ea / eu | Write ASCII / Unicode characters to an address |
s -d start end value | Search memory for a pattern over a range |
!address | Show virtual mapping, permissions, and region type |
A typical inspection sequence at a fault reads registers, walks the stack, then dumps memory at the stack pointer:
0:000> r
0:000> k
0:000> dd esp L8
0:000> dt ntdll!_EXCEPTION_RECORD @$exr
5. Crash Triage: Reading a Fault from First Principles
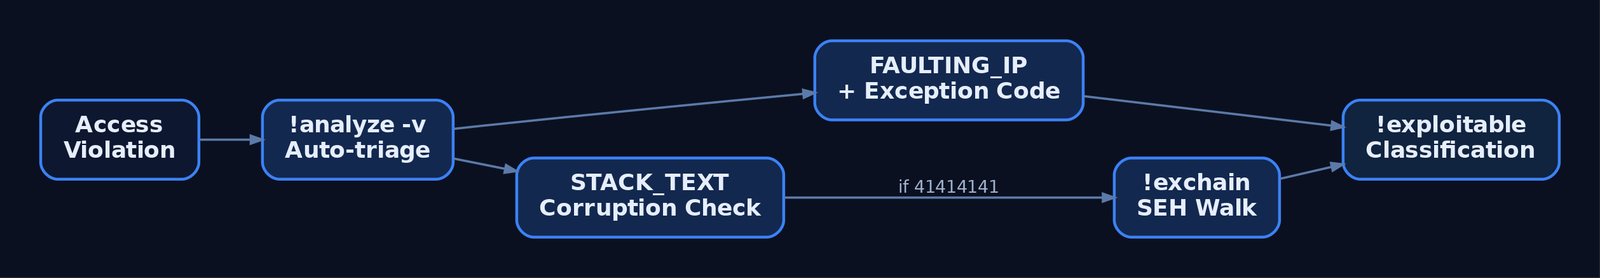
When a target faults, the debugger lands on the faulting instruction with an exception record describing the cause. !analyze -v automates first-pass triage, emitting the faulting IP, the decoded exception, the stack, and a probable root cause.
0:000> !analyze -v
FAULTING_IP:
 vuln!process_packet+0x4a
0040124a 8801            mov     byte ptr [ecx],al
EXCEPTION_RECORD:  (.exr -1)
ExceptionCode: c0000005 (Access violation)
ExceptionAddress: 0040124a
EXCEPTION_PARAMETER[1]: 41414141     ; attacker-controlled write target
STACK_TEXT:
0019f7c0 41414141 41414141 41414141 vuln!process_packet+0x4a
Read it methodically: FAULTING_IP is the instruction that trapped; the [ecx] write target of 41414141 (“AAAA”) signals attacker-controlled memory. A corrupted STACK_TEXT full of 41414141 indicates a saved-return-address overwrite. Decode any NTSTATUS with !error 0xC0000005. The MSEC !exploitable extension applies heuristics to estimate exploitability classification — load it with .load msec.dll first.
For Structured Exception Handler overwrites, !exchain walks the handler chain:
0:000> !exchain
0019ffdc: 41414141     ; handler overwritten with attacker bytes
Invalid exception stack at 41414141
A handler pointer of 41414141 confirms an SEH overwrite primitive.
6. Breakpoint Mastery
WinDbg distinguishes software breakpoints (bp, patch an int 3) from hardware breakpoints (ba, debug registers — they trap reads/writes/executes without modifying code).
| Command | What it does |
|---|---|
bp module!func | Software breakpoint, resolved immediately |
bu module!func | Unresolved — arms when the module loads |
bm module!pattern* | Breakpoint on all symbols matching a pattern |
ba r4 addr | Hardware breakpoint: read 4 bytes (ba e1 = execute, ba w4 = write) |
bp /1 addr | One-shot breakpoint, auto-clears after firing |
bl / bd N / be N / bc * | List / disable / enable / clear all breakpoints |
Attach a command string that runs automatically on each break, chaining with ;:
0:000> bu kernel32!WriteFile "k; r eax; g"
0:000> ba w4 0019f7c0 "!address @rip; g"
Use hit-count throttling to avoid output floods on hot paths, and dx query expressions for true conditional breakpoints:
0:000> bp /5 `vuln!net.c:385` "!teb; k; g"
0:000> bp /w "dx ((int)@ecx) == 0x41414141" vuln!process_packet
The bp /w form breaks only when the expression evaluates true — far cheaper than breaking and manually re-continuing.
7. Heap Internals Inspection
Heap corruption — use-after-free, overflow into adjacent chunks — is where most modern exploitation lives. The !heap extension family exposes chunk headers and allocation state.
| Command | What it does |
|---|---|
!heap -s | Summary of all heaps |
!heap -flt s 0x80 | Show all allocations of size 0x80 |
!heap -p -all | Walk all allocations in all heaps |
!heap -l | Detect leaked heap blocks |
0:000> !heap -s
0:000> !heap -flt s 0x80      ; isolate chunks of a target size class
0:000> !heap -p -all          ; correlate chunks to allocation call sites
Filtering by size class isolates the chunks an attacker grooms; !heap -p -all ties each block back to its allocation stack, which is how you identify the object straddling a corrupted boundary.
8. The dx Data Model and Scripting
The dx (Debugger Object Model) command exposes debugger state as queryable objects with a LINQ-style syntax — ideal for filtering large outputs and building conditions.
0:000> dx @$curprocess.Modules
0:000> dx @$curthread.Stack.Frames.Select(f => f.Attributes.InstructionOffset)
0:000> dx Debugger.Utility.Control.ExecuteCommand("k")
Debugger.Utility.Control.ExecuteCommand runs any legacy command from inside a dx query, enabling hybrid scripts that mix object queries with classic extensions. Load JavaScript automation with .scriptload script.js and invoke it with .scriptrun.
9. Time Travel Debugging for Exploit Devs
TTD records a full execution trace you can replay forward and backward, then query as data. It is the single biggest accelerator for root-causing memory corruption, because you can step backward from the crash to the write that caused it. WinDbgX must run as Administrator, and TTD is user-mode only in the current public build.
Recording produces a .run trace file. Open it and navigate with the reverse-execution commands:
| Command | What it does |
|---|---|
!tt 0:0 | Jump to a trace position (here, rewind to start) |
g- / p- / t- | Reverse continue / step / trace |
dx @$cursession.TTD.Calls("module!func") | Query every call to a function across the trace |
0:000> !tt 0:0
0:000> dx @$cursession.TTD.Calls("ntdll!RtlAllocateHeap")
0:000> g-     ; reverse-continue to the write that preceded the corruption
The workflow for a heap-corruption case: record to crash, query RtlAllocateHeap/RtlFreeHeap calls to find the freed chunk, set a write watchpoint on it, and g- backward to the exact instruction that wrote out of bounds.

10. Automation and Crash Triage Pipelines
For fuzzer integration, drive WinDbg headlessly with -c startup commands and -logo logging. A minimal triage script:
sxe av; g; !analyze -v; .logclose; qWrap it from any orchestrator:
import subprocess, re

cmds = 'sxe av; g; !analyze -v; .logclose; q'
subprocess.run(['windbg.exe', '-c', cmds, '-logo', 'out.txt', 'target.exe'])

log = open('out.txt', encoding='utf-8', errors='ignore').read()
m = re.search(r'FAULTING_IP:\s*\n(.+)', log)
print('Fault:', m.group(1).strip() if m else 'no crash')
.logopen / .logclose tee session output to disk for later parsing, turning every fuzzer crash into a structured triage record.
11. Common Attacker Techniques
WinDbg is a defensive and authorized-testing tool, but the APIs it relies on overlap heavily with adversary tradecraft — which is precisely why studying it teaches you the telemetry attackers generate.
| Technique | Description |
|---|---|
| Process attach | OpenProcess(PROCESS_ALL_ACCESS) + DebugActiveProcess mirror injection-stager behavior |
| Memory read/write | ReadProcessMemory / WriteProcessMemory underpin both debugging and code patching |
| Module enumeration | lm, !peb, !teb mirror malware’s runtime module/OS reconnaissance |
| Exploitability triage | !analyze -v, !exploitable, !exchain are used to weaponize crashes |
| TTD trace harvesting | .run files capture sensitive in-memory data during analysis |
An attacker reading LSASS or another process under the same primitives that WinDbg uses generates near-identical handle and memory-access telemetry — so the defender who understands WinDbg understands the indicators.
12. Defensive Strategies & Detection
Debugger activity is observable through process-creation, handle-access, and named-pipe telemetry.
| Sysmon Event ID | Relevance |
|---|---|
| Event ID 1 (Process Create) | windbg.exe / windbgx.exe launch; command line reveals -p PID attach or -z dump |
| Event ID 10 (ProcessAccess) | Attach yields OpenProcess with GrantedAccess: 0x1fffff; SourceImage is windbg.exe |
| Event ID 8 (CreateRemoteThread) | Debugger-injection / anti-anti-debug patterns |
| Event ID 17/18 (Pipe Create/Connect) | Kernel debugging over \\.\pipe\... |
Behavioral indicators for blue teams: windbg.exe -p <PID> on the command line (live attach), presence of dbgsrv.exe / ntsd.exe (remote/headless debug server), msec.dll loaded into a session (active exploitability assessment), and .run TTD trace files written to disk.
A Sigma rule for full-access process attach by a debugger:
title: Debugger Full-Access Attach to Process
logsource:
  product: windows
  service: sysmon
detection:
  selection:
    EventID: 10
    SourceImage|endswith:
      - '\windbg.exe'
      - '\windbgx.exe'
    GrantedAccess: '0x1fffff'
  condition: selection
level: medium
Pair Sysmon with the Microsoft-Windows-Kernel-Process ETW provider and Security Event 4688 (enable Audit Process Creation with command-line capture). Restrict SeDebugPrivilege on production hosts so non-admins cannot attach to other users’ or SYSTEM processes, and never expose kernel-debug ports on networked machines.
MITRE ATT&CK Mapping
| Technique | MITRE ID | Detection |
|---|---|---|
| Native API | T1106 | EDR hooks on OpenProcess / ReadProcessMemory |
| Process Injection | T1055 | Sysmon Event ID 10, GrantedAccess masks |
| Process Injection: DLL Injection | T1055.001 | LdrLoadDll / .load activity in traces |
| Debugger Evasion | T1622 | IsDebuggerPresent / heap-flag / timing probes |
| OS Credential Dumping | T1003 | Handle access to lsass.exe (authorized DFIR only) |
| System Information Discovery | T1082 | !peb / !teb / lm-equivalent runtime recon |
13. Tools for WinDbg Analysis
| Tool | Description | Link |
|---|---|---|
| WinDbg Preview | Modern debugger with TTD | microsoft.com |
| WinDbg Classic | SDK/WDK debugger for headless scripting | microsoft.com |
| Process Hacker | Live handle / memory inspection | processhacker.sourceforge.io |
| Process Monitor | File / registry / process tracing | live.sysinternals.com |
| x64dbg | User-mode disassembler-debugger | x64dbg.com |
| Ghidra | Static reverse engineering | ghidra-sre.org |
| Volatility | Memory-forensics framework | volatilityfoundation.org |
msec.dll (!exploitable) | Heuristic exploitability triage | MSEC release |
14. Summary
- WinDbg is the exploit developer’s primary lens into a faulting Windows process — and mastering it means mastering the telemetry attackers generate.
- Correct symbol configuration (
.sympath,.reload /f,!sym noisy) is the prerequisite that makes every other command meaningful. !analyze -v,!exchain, and!heapturn a raw access violation into a root-caused, classified crash;dxqueries and TTD let you step backward to the exact corrupting write.- Master all breakpoint types —
bp,bu,bm, hardwareba, one-shot/1, command anddx-conditional breaks — to control execution precisely. - Detect debugger and attach activity via Sysmon Event ID 1 and 10 (
GrantedAccess: 0x1fffff), Event 4688 command-line auditing, and restrictedSeDebugPrivilegeon production hosts.
Related Tutorials
- Setting Up Your Exploit Development Lab (VMs, Debuggers, Tools)
- What is Exploit Development?
- Egghunters: Staged Payload Delivery When Buffer Space Is Tight
- Shellcode Encoders: XOR Encoding, Custom Decoders, and Avoiding Bad Chars
- Position-Independent Code: Writing PIC Shellcode Without Hardcoded Addresses
References
- Get Started with WinDbg User-Mode Debugger – Microsoft Learn
- Using Debugger Commands (WinDbg) – Microsoft Learn
- bp, bu, bm (Set Breakpoint) – Microsoft Learn
- Processor Breakpoints (ba Breakpoints) – Microsoft Learn
- MITRE ATT&CK T1587.004 – Develop Capabilities: Exploits
- Debugging – WinDBG & WinDBGX Fundamentals – Corelan Exploit Development & Vulnerability Research
Setting Up Your Exploit Development Lab (VMs, Debuggers, Tools)
Objective: Build an isolated, fully-functional Windows exploit development lab from scratch — selecting and configuring VMs, installing and tuning debuggers, deploying exploit-assistance tooling, and understanding why each component exists — so you can safely study user-mode and kernel-mode exploitation without risking production systems.
1. Lab Philosophy and Safety
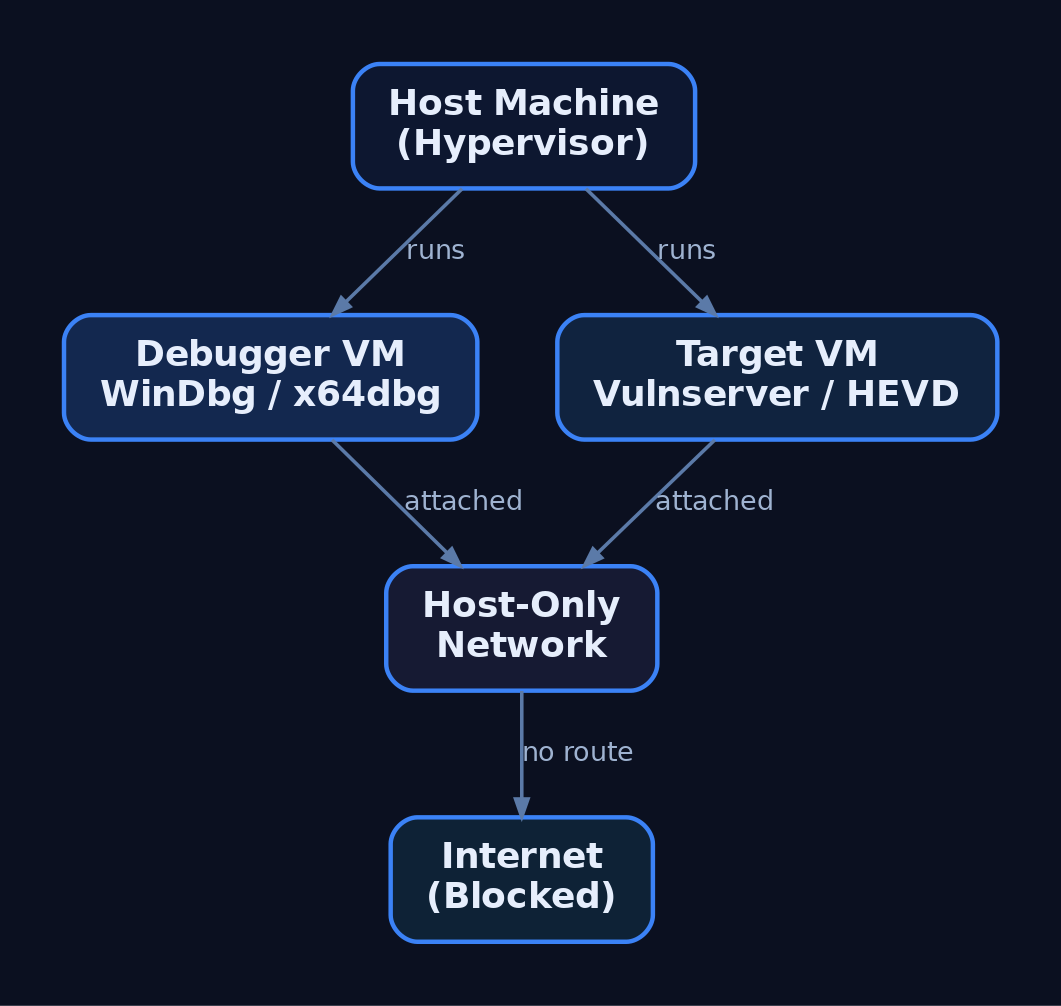
Exploit development is destructive by nature. You will corrupt memory, crash services, and intentionally bypass security controls. None of that is acceptable on a production host or a network with real users. The first rule of the lab is isolation: every target lives inside a virtual machine on a Host-Only network with no route to the internet or to your corporate LAN.
Treat the lab as authorized-research-only space. The techniques you practise here map to real adversary behaviour; the difference between research and intrusion is authorization and scope. Never point fuzzers, shellcode, or debuggers at systems you do not own or have written permission to test.
Two disciplines make or break a lab: network isolation and snapshot hygiene. Snapshot before each exercise so a corrupted kernel or a hung service is a 10-second revert, not a rebuild.
2. Choosing a Hypervisor and VM Configuration
Either VMware Workstation or VirtualBox is sufficient. VMware’s virtual serial/named-pipe handling is slightly smoother for kernel debugging; VirtualBox is free and adequate. The canonical lab is two VMs:
| Role | Recommended OS | Purpose |
|---|---|---|
| Debugger VM | Windows 10 x64 | Runs WinDbg Preview, x64dbg, disassemblers |
| User-mode target | Windows 10 x64 | Mitigations toggled per-exercise |
| Kernel target | Windows 7 x64 | Fewer protections, beginner-friendly |
Windows 7 x64 is common for early kernel work because it lacks many modern protections. Move to Windows 10/11 targets once you understand the fundamentals — modern exploitation research demands them.
Hardware guidance: allocate 2 vCPU / 4 GB RAM per VM minimum, and give the host enough headroom to run both target and debugger simultaneously. Set the lab adapters to Host-Only so the two VMs see each other but nothing else.
3. The Debugger/Debuggee Model
User-mode and kernel-mode debugging behave differently.
| Feature | User-Mode Debugging | Kernel-Mode Debugging |
|---|---|---|
| Target | A single process | The entire OS kernel |
| Location | Same machine as debugger | Remote (second VM) |
| Failure blast radius | One process crashes | Whole OS becomes unusable |
| Transport | Direct attach | Virtual serial (COM) or KDNET |
For user-mode work you can debug locally. Kernel debugging is done remotely — corrupting kernel memory typically bricks the running OS, so the debugger must live on a separate machine. This is why the two-VM split is non-negotiable for kernel exploitation.
4. Installing WinDbg and Configuring Symbols
WinDbg is the best fit for Windows exploitation because it handles both user-mode and kernel-mode, and it is free as part of the Windows SDK, the Windows Driver Kit (WDK), and Debugging Tools for Windows. During SDK setup, deselect everything except Debugging Tools for Windows.
| Tool | Role |
|---|---|
WinDbg Classic | Kernel + user-mode; command-line-centric; ships with SDK/WDK |
WinDbg Preview (WinDbgX) | Modern UI, Time Travel Debugging (TTD), JavaScript API |
WinDbg Preview requires Windows 10 build 1607 (RS1) or newer. Its TTD and modern UI make early learning far less painful than the basic Classic GUI, where newcomers often fight the debugger as much as the target.
Symbols turn raw addresses into named functions. Point WinDbg at Microsoft’s public symbol server via _NT_SYMBOL_PATH or inside the debugger:
.sympath SRV*C:\SymCache*https://msdl.microsoft.com/download/symbols
.reload /f
dt nt!_PEB @$peb
This caches all downloaded PDBs in C:\SymCache. Vendors can supply private PDBs for their own applications; everything else resolves against Microsoft’s public store.
5. Configuring Kernel Debug Transport
Kernel debugging is off by default and must be explicitly enabled on the target. First, add a virtual serial (COM) port to the target VM in your hypervisor, backed by a named pipe. Then create a dedicated debug boot entry with bcdedit.exe so you never alter the clean boot configuration:
bcdedit.exe /copy {current} /d "LabDebug"
bcdedit.exe /debug {<GUID from above>} on
bcdedit.exe /dbgsettings serial debugport:1 baudrate:115200
bcdedit.exe /copy clones the current boot entry; /debug ... on enables kernel debugging for that entry; /dbgsettings selects the serial transport and baud rate. View global settings any time with bcdedit.exe /dbgsettings.
In WinDbg Preview choose Attach to kernel → COM, match the port and baud rate, then boot the target into the LabDebug entry. Verify the connection and symbols:
.reload
x /f nt!NtCreateProcess*
lm m nt
If nt!NtCreateProcess* resolves and lm m nt shows the kernel module with symbols, the pipe is live. Note that local kernel debugging exists but cannot set breakpoints on drivers — only the remote two-VM model gives you live kernel control.

6. Installing x64dbg and Visual Debuggers
For user-mode work, x64dbg is an excellent open-source visual debugger, shipping as x32dbg (32-bit) and x64dbg (64-bit). Its four-pane layout — disassembly, registers, stack, and memory dump — makes control flow and corruption visible at a glance, which is invaluable before you are fluent in WinDbg’s command language.
A typical first session against a practice target looks like this:
# x64dbg walkthrough (narrative)
1. File -> Attach -> select vulnserver.exe
2. Navigate to the target function in the disassembly pane
3. Press F2 to set a software breakpoint (INT3)
4. Press F9 to run; trigger the command from the client
5. Execution halts; inspect EAX/RIP, the stack pane, and dump
Watching RIP land on attacker-controlled bytes in the stack pane teaches the core idea of control-flow hijack faster than any text dump.
7. Disassemblers: IDA and Ghidra
Debuggers are dynamic (running process); disassemblers are static (the binary at rest). You need both.
| Tool | Role |
|---|---|
IDA Free / IDA Pro | Industry-standard static disassembly; Free edition has feature limits |
Ghidra | NSA open-source disassembler/decompiler; free IDA Pro alternative |
Use Ghidra or IDA to map a binary’s functions, locate parsing routines, and identify candidate vulnerable code paths before you ever attach a debugger. Ghidra’s decompiler output is free and good enough for most lab work; IDA Pro’s analysis depth justifies its cost in professional research.
8. Exploit Assistance: mona.py, PyKD, and boofuzz
mona.py automates the tedious parts of exploit development — cyclic pattern creation, bad-character identification, and ROP gadget discovery. It was born in Immunity Debugger but runs inside WinDbg through two shims.
| Tool | Description |
|---|---|
mona.py | Automates pattern/bad-char/ROP tasks inside WinDbg or Immunity |
PyKD | WinDbg Python bindings; lets mona.py execute inside WinDbg |
windbglib.py | Compatibility layer bridging the ImmLib API gap for WinDbg |
boofuzz | Network fuzzer; the maintained successor to Sulley |
Drop pykd.pyd, windbglib.py, and mona.py where WinDbg can load them, then:
.load pykd.pyd
!py mona
!py mona config -set workingfolder C:\MonaLogs\%p_%i
The %p_%i tokens give each process/instance its own log folder, keeping artifacts from different targets separated.
For crash discovery, install boofuzz with pip install boofuzz. Its bundled process_monitor.py watches the target and reports which input produced a crash, which you then reproduce under the debugger. A minimal structural skeleton against Vulnserver:
from boofuzz import Session, Target, SocketConnection, s_initialize, s_string, s_static

session = Session(target=Target(connection=SocketConnection("192.168.x.x", 9999, proto="tcp")))
# define request blocks (s_initialize / s_static / s_string) here
session.connect(s_get("request_name"))
session.fuzz()
This wires the transport and session only — no weaponised payloads. The fuzzer’s job is to find the crash; the debugger’s job is to understand it.

9. Vulnerable Practice Targets
You need intentionally broken software to practise against.
| Target | Type |
|---|---|
Vulnserver | Multi-threaded Windows TCP server on port 9999 with multiple vulnerable commands |
HEVD (HackSysExtreme Vulnerable Driver) | Vulnerable kernel driver exposing many kernel primitives |
exploit.education / protostar | Linux 32-bit stack fundamentals before moving to Windows |
Vulnserver is the standard introduction to Windows user-mode exploitation — its commands map cleanly to overflow, SEH, and bad-character exercises. HEVD is the kernel counterpart, exposing stack overflows, use-after-free, type confusion, and arbitrary write primitives in a controlled driver. Verify the current HEVD release against the HackSysExtreme GitHub repository before deploying.
10. Understanding and Controlling Mitigations
Modern Windows ships layered exploit mitigations. To learn progressively, you disable them on the lab target VM only and re-enable them one at a time to feel each control’s effect.
| Mitigation | Mechanism | Toggle |
|---|---|---|
| ASLR | Randomises image/stack/heap base addresses | MoveImages=0 in Memory Management; per-PE /DYNAMICBASE |
| DEP / NX | Marks stack/heap non-executable | bcdedit.exe /set nx AlwaysOff |
| SafeSEH | Validates SEH handlers against a table | Compile-time /SAFESEH |
| SEHOP | Runtime SEH chain integrity check | DisableExceptionChainValidation=1 |
| Stack Canaries (GS) | Compiler stack cookie | /GS MSVC flag |
| CFG | Validates indirect call targets | MitigationOptions under kernel |
To disable image ASLR system-wide on the practice target:
:: LAB TARGET VM ONLY — never run this on a production or internet-connected host
reg add "HKLM\SYSTEM\CurrentControlSet\Control\Session Manager\Memory Management" /v MoveImages /t REG_DWORD /d 0 /f
This applies to the lab target VM only. On real systems these mitigations are the defense — you are removing them solely to study the underlying primitive. The Windows Security Exploit Protection panel (and Get-ProcessMitigation / Set-ProcessMitigation) provides per-process and system-wide control. Verify ASLR/SEHOP/DEP key paths against current Microsoft documentation before relying on them.
11. PEB Debugging Awareness and Heap Behaviour
A subtle trap: the debugger changes the target’s behaviour. WinDbg does not write a registry key for heap debug flags — it updates the NtGlobalFlag field in the Process Environment Block (PEB) directly. Loading an executable under a debugger also sets PEB flags that reveal the process is being debugged.
| PEB Field | Offset | Size |
|---|---|---|
BeingDebugged | +0x002 | BYTE |
NtGlobalFlag | +0x068 (x86) / +0x0BC (x64) | ULONG |
Anti-debug logic reads BeingDebugged or NtGlobalFlag to detect you trivially. More dangerously, heap behaviour — chunk sizes, layout, relative distances — differs under a debugger. You can build an exploit that works perfectly attached and fails completely in the wild because the heap state was an artifact of debugging. Always validate final exploits in a non-debugged run. Independently confirm the 32-bit vs. 64-bit PEB offsets against live symbols.

12. Common Attacker Techniques This Lab Lets You Study
This environment exists to study real adversary exploitation primitives safely.
| Technique | Description |
|---|---|
| Stack buffer overflow | Overwrite saved return address to redirect execution |
| SEH overwrite | Corrupt the exception handler chain to gain control |
| ROP chaining | Bypass DEP by reusing executable gadgets |
| Kernel pool corruption | Abuse driver bugs (HEVD) for privilege escalation |
| Bad-character / encoder evasion | Survive input filtering and produce clean shellcode |
MITRE ATT&CK Mapping
| Technique | MITRE ID | Detection |
|---|---|---|
| Exploitation for Client Execution | T1203 | WER crash events; anomalous child processes |
| Exploitation for Privilege Escalation | T1068 | Driver load + token changes; Sysmon EID 6/10 |
| Exploitation for Defense Evasion | T1211 | Unexpected mitigation-policy changes |
| Exploitation for Credential Access | T1212 | Abnormal access to credential stores |
| Exploitation of Remote Services | T1210 | Service crashes; Sysmon EID 1 on spawned shells |
| Exploit Public-Facing Application | T1190 | WAF/IDS alerts; service restart loops |
This tutorial sets up the research environment that lets the series study each of these techniques under controlled conditions.
13. Defensive Strategies & Detection
What This Looks Like to a Defender
Lab tooling generates noisy, recognisable telemetry. Knowing it helps you spot the same activity on a monitored production host.
| Event ID | Description |
|---|---|
| Sysmon EID 1 | Process Create — windbg.exe, x64dbg.exe, bcdedit.exe, msfvenom, Python exploit scripts |
| Sysmon EID 7 | Image Loaded — pykd.pyd loaded into WinDbg; debugger DLL loads |
| Sysmon EID 10 | ProcessAccess — debugger opening a target with PROCESS_VM_READ/WRITE, PROCESS_SUSPEND_RESUME |
| Sysmon EID 13 | RegistryValue Set — bcdedit.exe BCD edits; ASLR/DEP registry changes |
| Sysmon EID 25 | ProcessTampering — memory manipulation context for later tutorials |
A starting Sigma sketch for a debugger attaching to a target process:
title: Debugger Attaching to Vulnerable Practice Target
logsource:
  product: windows
  service: sysmon
detection:
  selection:
    EventID: 10
    TargetImage|endswith: '\vulnserver.exe'
    GrantedAccess:
      - '0x1fffff'   # PROCESS_ALL_ACCESS
      - '0x1010'     # PROCESS_VM_READ | PROCESS_QUERY_LIMITED_INFORMATION
  filter:
    CallTrace|contains: 'UNKNOWN'   # execution from non-mapped memory
  condition: selection and filter
level: medium
Correlate with ETW providers: Microsoft-Windows-Kernel-Process (process/thread lifecycle), Microsoft-Windows-Kernel-Audit-API-Calls (OpenProcess with specific access masks), and Microsoft-Windows-WER (crash events from Vulnserver/HEVD that flag unexpected terminations).
Hardening for production hosts:
- Disable kernel debugging:
bcdedit.exe /debug off; confirm withbcdedit.exe /enum all. - Enforce mitigations via
Set-ProcessMitigationand the Exploit Protection GUI. - Enable VBS / Credential Guard — it blocks kernel-mode code injection on modern Windows, which is exactly why lab kernel targets are older and unpatched.
- Use WDAC to block unsigned debug tools (which is why the lab disables or excepts it).
- Keep the lab adapter Host-Only with no internet routing.
14. Tools for Lab Setup and Analysis
| Tool | Description | Link |
|---|---|---|
| WinDbg / WinDbg Preview | Kernel + user-mode debugging, TTD | microsoft.com |
| x64dbg | Visual open-source user-mode debugger | x64dbg.com |
| Ghidra | Free disassembler/decompiler | ghidra-sre.org |
| IDA Free / Pro | Static disassembly and analysis | hex-rays.com |
| mona.py | Pattern/bad-char/ROP automation | github.com |
| boofuzz | Network fuzzer (Sulley successor) | github.com |
| Vulnserver | Vulnerable TCP practice server | github.com |
| HEVD | Vulnerable kernel driver | github.com |
| Metasploit / MSFVenom | Shellcode generation and testing | metasploit.com |
Summary
- An exploit development lab is two isolated VMs — a debugger and a debuggee — on a Host-Only network, snapshotted before every exercise.
- WinDbg covers both user-mode and kernel-mode; kernel debugging must be enabled with
bcdedit.exeover a virtual serial port and is always done remotely. - mona.py (via PyKD/windbglib), boofuzz, x64dbg, and disassemblers like Ghidra automate discovery and analysis against Vulnserver and HEVD.
- Mitigations (ASLR, DEP, SafeSEH, SEHOP, GS, CFG) are disabled on the lab target only for progressive learning, and the PEB’s
BeingDebugged/NtGlobalFlagfields remind you that debuggers alter target behaviour. - Defenders see this activity through Sysmon EID 1/7/10/13/25, WER crashes, and
OpenProcessaudit ETW — and harden production hosts withbcdedit.exe /debug off, VBS/Credential Guard, and WDAC.
Related Tutorials
- What is Exploit Development?
- Building a Red Team Lab: Infrastructure, VMs, and C2 Setup
- WinDbg Crash Course: Navigation, Commands, and Workflow for Exploit Devs
- Egghunters: Staged Payload Delivery When Buffer Space Is Tight
- Shellcode Encoders: XOR Encoding, Custom Decoders, and Avoiding Bad Chars
References
- MITRE ATT&CK: Develop Capabilities – Exploits (T1587.004)
- Get Started with Windows Debugging (WinDbg) – Microsoft Learn
- Debugging Tools for Windows SDK and WDK (WinDbg Download) – Microsoft Learn
- Corelan Exploit Writing Tutorial Part 1: Stack Based Overflows
- Metasploit Framework – Getting Started (Official Rapid7 Docs)
- Writing an Exploit Module – Metasploit Official Documentation
IRQL Levels: Interrupt Request Priorities Explained
Objective: Understand the Windows kernel’s Interrupt Request Level (IRQL) priority system — what each level means numerically and symbolically, how the HAL arbitrates hardware and software interrupts, which APIs query and change the IRQL, what kernel operations are legal at each level, and how malicious kernel code abuses IRQL semantics to evade defenders.
1. What Is an IRQL?
An Interrupt Request Level (IRQL) is a per-processor priority value that determines which kernel-mode support routines the currently executing code may legally call. It is an integer in the range 0–31, stored as type KIRQL (a typedef for UCHAR). Three levels — PASSIVE_LEVEL, APC_LEVEL, and DISPATCH_LEVEL — are referred to symbolically; the rest are usually named by value.
IRQL is per-processor, not per-thread. On x86 it lives in the Irql field of the _KPCR (Kernel Processor Control Region); on x64 it is mapped to the CR8 register (Task Priority Register). When the processor raises its IRQL, all interrupts at or below that level are masked. Higher-numbered interrupts preempt all lower-IRQL processing; once handled, the processor returns to the previous level. Raising and lowering must follow strict stack discipline — you only lower back to a level you previously raised from.
2. The IRQL Hierarchy
The Hardware Abstraction Layer (HAL) maps physical interrupt vectors to software IRQLs. The count of levels is architecture-dependent: x64 and Itanium expose 16 IRQLs; x86 exposes 32, owing to differences in interrupt-controller hardware. The canonical wdm.h symbolic definitions differ across architectures.
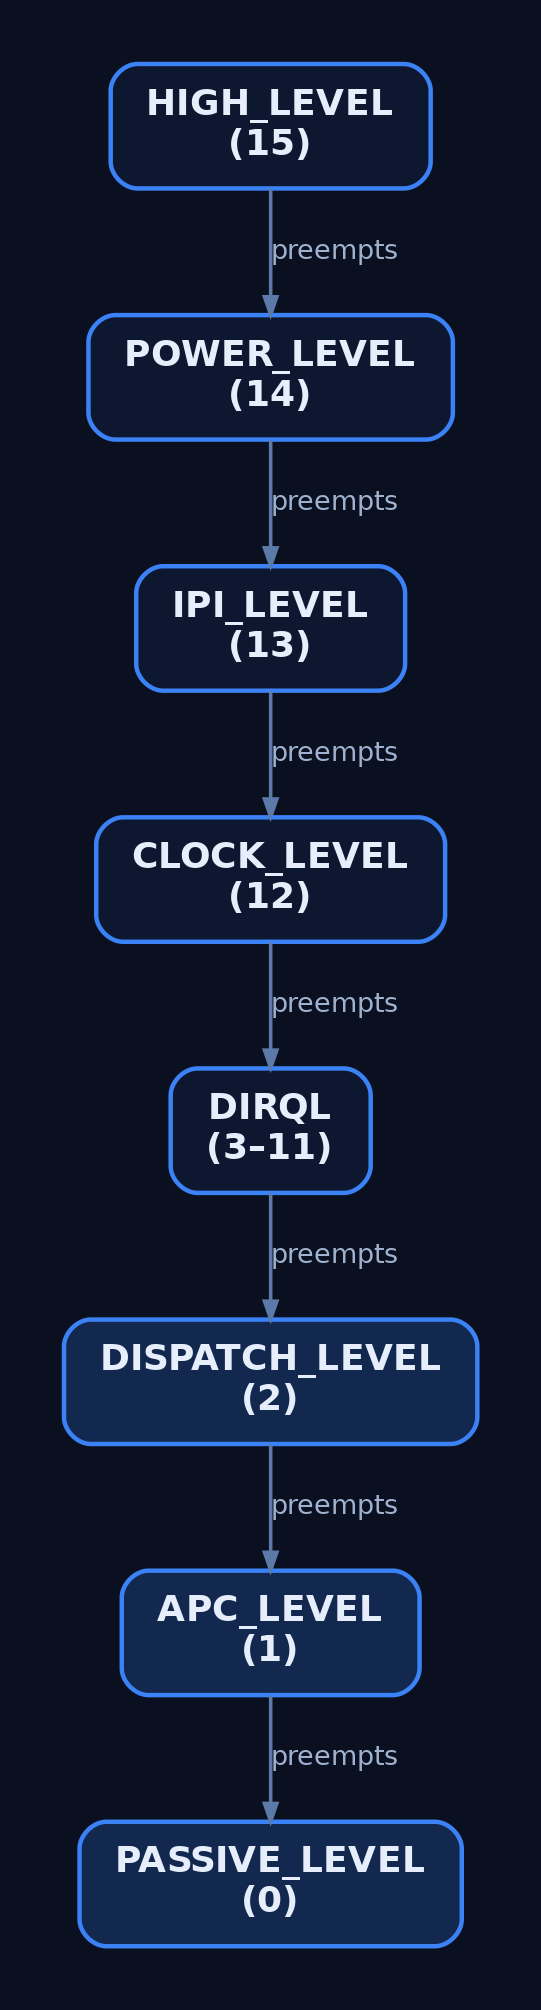
| Symbolic Name | x64 Value | x86 Value | Description |
|---|---|---|---|
PASSIVE_LEVEL / LOW_LEVEL | 0 | 0 | Normal thread execution; nothing masked |
APC_LEVEL | 1 | 1 | APC delivery and page-fault handling |
DISPATCH_LEVEL | 2 | 2 | Thread scheduler / DPC queue |
CMC_LEVEL | 3 | — | Correctable Machine Check |
| Device IRQLs (DIRQL) | 4–11 | 3–26 | Hardware device interrupts |
CLOCK_LEVEL | 13 | 28 | System clock timer |
IPI_LEVEL / DRS_LEVEL | 14 | 29 | Inter-Processor Interrupt |
POWER_LEVEL | 15 | 30 | Power failure |
PROFILE_LEVEL / HIGH_LEVEL | 15 | 31 | Profiling / highest maskable |
Higher value = higher priority. A device interrupt at DIRQL 8 preempts a DPC at DISPATCH_LEVEL (2), which itself preempts ordinary thread code at PASSIVE_LEVEL (0).
3. Software IRQLs: PASSIVE, APC, and DISPATCH
The lowest three levels are software IRQLs — the kernel raises and lowers them without involving the interrupt controller.
PASSIVE_LEVEL (0) masks nothing. This is where normal kernel-mode thread code runs: DriverEntry, AddDevice, Unload, most dispatch routines, and driver-created worker threads. All blocking, paging, and synchronization primitives are available.
APC_LEVEL (1) masks Asynchronous Procedure Call interrupts only. The sole functional difference from PASSIVE_LEVEL is that APCs cannot interrupt the running code. Both levels imply a valid thread context and both permit access to pageable memory. Page-fault handling itself runs at APC_LEVEL.
DISPATCH_LEVEL (2) masks DISPATCH_LEVEL and APC_LEVEL. Critically, the thread scheduler is disabled — code here owns the processor until it lowers IRQL. Routines such as StartIo, DpcForIsr, IoTimer, Cancel (holding the cancel spin lock), and all DPC callbacks run here. Two hard rules apply: no access to paged memory, and no blocking waits.
| Feature | PASSIVE_LEVEL | APC_LEVEL | DISPATCH_LEVEL |
|---|---|---|---|
| Thread context | Yes | Yes | Not guaranteed |
| Scheduler active | Yes | Yes | No |
| Paged pool access | Yes | Yes | No |
| Blocking waits allowed | Yes | Yes | No |
4. Hardware IRQLs: DIRQL and Above
Levels at or above the device range are hardware IRQLs driven by the interrupt controller. A driver’s Device IRQL (DIRQL) is the SynchronizeIrql stored in its _KINTERRUPT object. When a device fires, the processor raises to that DIRQL and invokes the Interrupt Service Routine (ISR), a KSERVICE_ROUTINE.
At DIRQL, all interrupts at or below the driver’s level are masked, but higher-DIRQL devices, the clock, and power-failure interrupts may still preempt. Because the scheduler and lower-priority interrupts are blocked, ISRs must be minimal — they acknowledge the hardware, capture volatile state, and queue a DPC for the heavy lifting at DISPATCH_LEVEL.
Above DIRQL sit CLOCK_LEVEL, IPI_LEVEL (used by one processor to interrupt another), POWER_LEVEL, and HIGH_LEVEL. The general principle: the higher the IRQL, the shorter the code must run. Sustained work at high IRQL starves the entire processor.
// KSERVICE_ROUTINE - runs at DIRQL; must be minimal
BOOLEAN MyInterruptServiceRoutine(
    PKINTERRUPT Interrupt, PVOID ServiceContext) {
    // Acknowledge hardware, then defer heavy work to a DPC.
    // Do NOT touch paged memory here.
    IoRequestDpc(MyDeviceObject, MyDeviceObject->CurrentIrp, ServiceContext);
    return TRUE;
}
5. Kernel APIs for IRQL Management
Drivers query and adjust IRQL through a small, exported API surface in wdm.h.
| API Function | Purpose |
|---|---|
KeGetCurrentIrql() | Returns the current processor IRQL; callable at any IRQL |
KeRaiseIrql(NewIrql, &OldIrql) | Raises to NewIrql; saves prior level. NewIrql must be ≥ current |
KeLowerIrql(OldIrql) | Restores a previously saved IRQL — only after a matching raise |
KeRaiseIrqlToDpcLevel() | Raises to DISPATCH_LEVEL, returns old IRQL |
KeAcquireSpinLock(&Lock, &OldIrql) | Acquires spin lock, raising to DISPATCH_LEVEL |
KeReleaseSpinLock(&Lock, OldIrql) | Releases lock, restoring saved IRQL |
KeAcquireSpinLockAtDpcLevel(&Lock) | Acquires lock without raising (caller already at DISPATCH_LEVEL) |
The exact signatures:
KIRQL KeGetCurrentIrql(void);

void KeRaiseIrql(
  _In_  KIRQL  NewIrql,
  _Out_ PKIRQL OldIrql
);

void KeLowerIrql(_In_ KIRQL NewIrql);   // restore saved old IRQL

KIRQL KeRaiseIrqlToDpcLevel(void);
The raise/lower discipline is enforced: calling KeRaiseIrql with a value lower than the current IRQL is a fatal error, and KeLowerIrql may only restore the level a prior KeRaiseIrql saved.
// Demonstrates the raise/lower stack discipline
VOID MyFunctionNeedingDispatchLevel(VOID) {
    KIRQL oldIrql;
    KeRaiseIrql(DISPATCH_LEVEL, &oldIrql);
    // --- Critical section: no paged pool access here ---
    KeLowerIrql(oldIrql);
}
Spin locks couple mutual exclusion with IRQL: acquiring one raises to DISPATCH_LEVEL so the holder cannot be preempted by the scheduler on its processor.
KSPIN_LOCK MySpinLock;
KIRQL oldIrql;

KeInitializeSpinLock(&MySpinLock);
// KeAcquireSpinLock raises to DISPATCH_LEVEL internally
KeAcquireSpinLock(&MySpinLock, &oldIrql);
// ... protected shared-data access (non-paged only) ...
KeReleaseSpinLock(&MySpinLock, oldIrql); // restores oldIrql
A driver inspecting its own context queries the level directly:
// Demonstrates KeGetCurrentIrql() usage and KIRQL type
NTSTATUS DriverDispatchCreate(PDEVICE_OBJECT DeviceObject, PIRP Irp) {
    KIRQL currentIrql = KeGetCurrentIrql();
    // Expected: PASSIVE_LEVEL (0) in a dispatch routine
    DbgPrint("[MyDriver] Current IRQL: %u\n", (ULONG)currentIrql);
    // ...complete IRP...
}
6. Memory Access Rules at Each IRQL
The single most consequential IRQL rule concerns paged memory. Any routine running above APC_LEVEL that touches paged pool causes a fatal page fault. Resolving a page fault requires the file-system driver to read from disk — an operation that needs a context switch, which is impossible once the scheduler is disabled at DISPATCH_LEVEL.
| Memory Pool | PASSIVE_LEVEL | APC_LEVEL | DISPATCH_LEVEL+ |
|---|---|---|---|
| Paged pool | Accessible | Accessible | Fatal page fault |
| Non-paged pool | Accessible | Accessible | Accessible |
Code at or above DISPATCH_LEVEL must therefore allocate from non-paged pool and operate only on locked or non-pageable memory (for example, buffers locked with MmProbeAndLockPages). Violating this rule produces the most common driver bug check — IRQL_NOT_LESS_OR_EQUAL (0x0000000A), or its driver-attributed variant 0x000000D1.
7. DPCs: The DISPATCH_LEVEL Workhorses
A Deferred Procedure Call (DPC) moves work out of the time-critical ISR into DISPATCH_LEVEL. The ISR queues a _KDPC object (via IoRequestDpc or KeInsertQueueDpc); the kernel drains the DPC queue as IRQL drops below DISPATCH_LEVEL. DpcForIsr handles per-IRP completion; CustomDpc and CustomTimerDpc serve driver-specific needs.
// KDEFERRED_ROUTINE - runs at DISPATCH_LEVEL
VOID MyDpcRoutine(
    PKDPC Dpc, PVOID DeferredContext,
    PVOID SystemArgument1, PVOID SystemArgument2) {
    // Safe: non-paged pool only.
    // Do NOT call KeWaitForSingleObject with a nonzero timeout.
    DbgPrint("[MyDpc] Running at DISPATCH_LEVEL\n");
}
A DPC that runs too long throttles the whole system and triggers DPC_WATCHDOG_VIOLATION (0x00000133) once sustained execution exceeds the watchdog threshold.

8. APCs: The APC_LEVEL Mechanism
An Asynchronous Procedure Call (APC) executes a function in the context of a specific thread. Kernel APCs run at APC_LEVEL; user APCs are delivered when a thread returns to PASSIVE_LEVEL in a user-mode alertable wait. Drivers initialize them with KeInitializeApc and queue them with KeInsertQueueApc. Because APC_LEVEL still implies a valid thread context and permits paged access, certain dispatch routines raise to APC_LEVEL to serialize against APC delivery while remaining able to page in data.
9. Debugging IRQL With WinDbg
WinDbg exposes IRQL state on both live kernels and crash dumps.
; Check current IRQL on each processor
!irql

; Examine the KPCR for processor 0
!pcr 0

; List pending DPCs
!dpcs

; Analyze a 0x0000000A bugcheck
!analyze -v
On x64 the IRQL is the CR8 register; you can read it and the _KPCR directly:
; dt = display type; shows _KPCR struct at GS base
dt nt!_KPCR @$pcr
; On x64, IRQL maps to CR8 (Task Priority Register)
r cr8
The IRQL contract is also expressed statically through SAL annotations in wdm.h, which static-analysis tooling verifies at build time:
// Illustrates IRQL annotation macros from wdm.h
_IRQL_requires_max_(DISPATCH_LEVEL)
VOID MyRoutineSafeAtOrBelowDispatch(VOID);

_IRQL_requires_(PASSIVE_LEVEL)
VOID MyRoutineRequiresPassive(VOID);

_IRQL_raises_(DISPATCH_LEVEL)
_IRQL_saves_
KIRQL MyRaiseRoutine(VOID);
10. IRQL in a Security Context
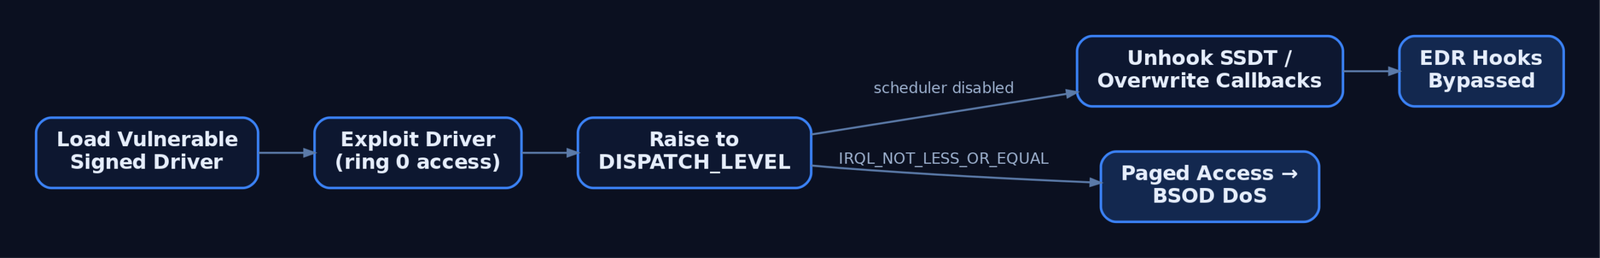
IRQL semantics become a security concern the moment attacker code reaches ring 0. Code running at DISPATCH_LEVEL owns its processor and is invisible to user-mode EDR hooks — an ideal vantage point for unhooking the SSDT, overwriting kernel callbacks, or hiding objects before defensive software can react. Because paged access above APC_LEVEL is fatal, IRQL violations also serve as a crude denial-of-service primitive: a single bad page touch produces an IRQL_NOT_LESS_OR_EQUAL blue screen.
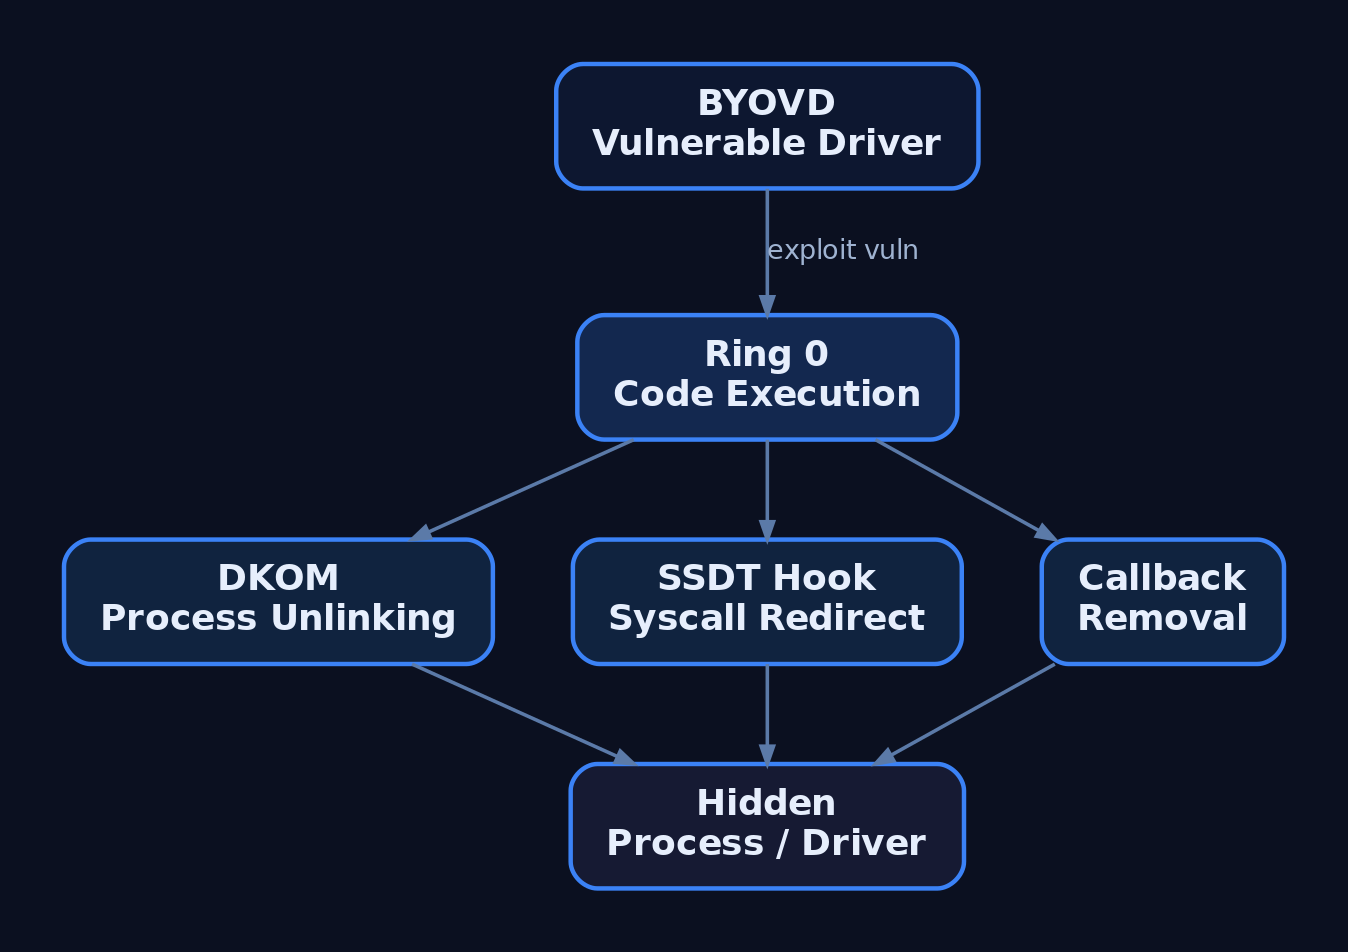
The dominant delivery vector is Bring Your Own Vulnerable Driver (BYOVD) — loading a legitimately signed but exploitable driver to obtain kernel-IRQL execution without writing a new signed driver. Missing or incorrect IRQL SAL annotations frequently mask the very bugs these attacks exploit.
11. Common Attacker Techniques
| Technique | Description |
|---|---|
| BYOVD kernel execution | Load a signed-but-vulnerable driver (e.g. RTCore64.sys, dbutil_2_3.sys) to run code at kernel IRQL |
EDR unhooking at DISPATCH_LEVEL | Patch SSDT entries or kernel callbacks while the scheduler is disabled, beating re-hook races |
| Rootkit concealment | Hide processes, files, and connections from DIRQL/DISPATCH_LEVEL, below user-mode visibility |
| Spin-lock starvation | Hold a spin lock at DISPATCH_LEVEL to monopolize a processor — driver-stack DoS |
| Deliberate IRQL fault | Force paged access above APC_LEVEL to bug-check the host (0x0000000A DoS) |
| DSE downgrade | Flip test-signing or pre-release flags to load unsigned kernel code |
12. Defensive Strategies & Detection
Driver loads are the chokepoint. Sysmon Event ID 6 (Driver Loaded) records ImageLoaded, Hashes, Signed, Signature, and SignatureStatus — the fields that expose unsigned or anomalously signed drivers and known-vulnerable BYOVD payloads. Event ID 7045 (and System log 7036/7040) surface drivers registered as services. PatchGuard violations of _KPCR/IDT/SSDT raise bug check 0x00000109 (CRITICAL_STRUCTURE_CORRUPTION); HVCI/Code-Integrity blocks land in Microsoft-Windows-CodeIntegrity/Operational (Event IDs 3001–3089) and Security Event ID 5038.
A starting Sigma rule for vulnerable-driver loads:
title: Suspicious Vulnerable Driver Load (Possible BYOVD)
logsource:
  product: windows
  service: sysmon
detection:
  selection_unsigned:
    EventID: 6
    Signed: 'false'
  selection_known_vuln:
    EventID: 6
    ImageLoaded|endswith:
      - '\RTCore64.sys'
      - '\dbutil_2_3.sys'
  condition: selection_unsigned or selection_known_vuln
level: high
ISR/DPC behavior can be traced through the NT Kernel Logger ETW provider with interrupt and DPC flags enabled:
xperf -on Base+Interrupt+DPC
xperf -d trace.etl
Hardening layers: enforce Driver Signature Enforcement and HVCI (M1048) so unsigned or tampered drivers cannot load even on a compromised kernel; enable the Microsoft Vulnerable Driver Blocklist (HKLM\SYSTEM\CurrentControlSet\Control\CI\Config\VulnerableDriverBlocklistEnable); restrict SeLoadDriverPrivilege to administrators (M1026); and run suspect drivers under Driver Verifier in a VM to force IRQL checks. Monitor bcdedit test-signing changes and the CI\Config registry path for downgrade attempts.
MITRE ATT&CK Mapping
| Technique | MITRE ID | Detection |
|---|---|---|
| Rootkit | T1014 | Sysmon EID 6 unsigned/anomalous drivers; HVCI logs |
| Create System Process: Service | T1543.003 | EID 7045 / System 7036 driver-service install |
| Impair Defenses: Disable Tools | T1562.001 | EDR callback integrity, PatchGuard 0x109 |
| Impair Defenses: Downgrade | T1562.010 | CI\Config registry + bcdedit test-signing audit |
| Exploitation for Priv-Esc | T1068 | BYOVD load (EID 6) preceding kernel-write activity |
| Escape to Host | T1611 | Kernel-IRQL execution from container context |
13. Tools for IRQL Analysis
| Tool | Description | Link |
|---|---|---|
| WinDbg | !irql, !pcr, !dpcs, !analyze -v on bug checks | microsoft.com |
| Driver Verifier | Forces IRQL/pool/deadlock checks on a target driver | microsoft.com |
| Sysmon | Driver-load (EID 6) and service (7045) telemetry | microsoft.com |
| xperf / WPA | ETW interrupt and DPC tracing | microsoft.com |
| Process Hacker | Live driver and kernel-module enumeration | processhacker.sourceforge.io |
| Volatility | Memory-forensic driver and callback inspection | volatilityfoundation.org |
| Ghidra | Static analysis of suspect driver binaries | ghidra-sre.org |
Summary
- IRQL is a per-processor priority register that gates which kernel routines code may legally call and which interrupts are masked.
- The HAL maps hardware vectors onto 16 IRQLs on x64 and 32 on x86; higher value preempts lower, and raising/lowering must follow strict stack discipline.
- Above
APC_LEVELthe scheduler is disabled and paged memory is off-limits — touching it triggersIRQL_NOT_LESS_OR_EQUAL(0x0000000A). - Attackers reach kernel IRQL through BYOVD to unhook EDR, conceal rootkits, or bug-check the host as a DoS — mapped to
T1014,T1543.003,T1562.001, andT1068. - Detect via Sysmon Event ID 6, the vulnerable-driver blocklist, HVCI/DSE enforcement, and
SeLoadDriverPrivilegerestriction.
Related Tutorials
- Windows Scheduler Internals: Priority Levels, Quantum, and Thread Selection
- DPCs: Deferred Procedure Calls and Interrupt Deferral
- Access Tokens and Privileges: The Kernel’s Security Context
- SIDs and Security Descriptors: Identity in Windows Security
- Fibers: User-Mode Cooperative Threads
References
- Managing Hardware Priorities (IRQL Levels) — Windows Kernel Driver Docs | Microsoft Learn
- Always Preemptible and Always Interruptible — Windows Kernel Driver Docs | Microsoft Learn
- IRQL Annotations for Drivers — Windows Driver Testing | Microsoft Learn
- !irql Extension Command (WinDbg Kernel Debugger) | Microsoft Learn
- Dispatch Routines and IRQLs — Windows Kernel Driver Docs | Microsoft Learn
- Guidelines for Writing DPC Routines (DISPATCH_LEVEL IRQL) | Microsoft Learn
HAL and Ntoskrnl: The Kernel Core Components
Objective: Understand the architecture and division of labor between
hal.dll(the Hardware Abstraction Layer) andntoskrnl.exe(the NT kernel and Executive), how they are loaded during boot, the structures and routines each exposes, and how defenders inspect, detect tampering against, and harden these Ring 0 core components.
1. HAL and Ntoskrnl Overview
Two binaries sit at the bottom of Windows kernel mode and everything else builds on them. ntoskrnl.exe is the NT kernel plus the Executive — the policy and service layer of the OS. hal.dll is the Hardware Abstraction Layer — a thin platform shim that hides interrupt controllers, bus topology, timers, and DMA behind a uniform interface so the rest of the kernel stays hardware-independent.
| Binary | Full name | Loaded by | Ring |
|---|---|---|---|
ntoskrnl.exe | NT OS Kernel + Executive | winload.efi | Ring 0 |
hal.dll | Hardware Abstraction Layer | winload.efi | Ring 0 |
Both reside in %SystemRoot%\System32\. On multiprocessor systems the SMP-aware image ntkrnlmp.exe is selected by the loader and presented as ntoskrnl.exe; modern Windows 10/11 ships only the SMP variant. Verify image identity and signature on a live host with sigcheck, dumpbin /headers, or the WinDbg lm command. The separation exists for portability (HAL absorbs platform differences) and layering (the kernel implements scheduling and policy, not chipset quirks).
2. Boot Handoff: From Bootloader to KiSystemStartup
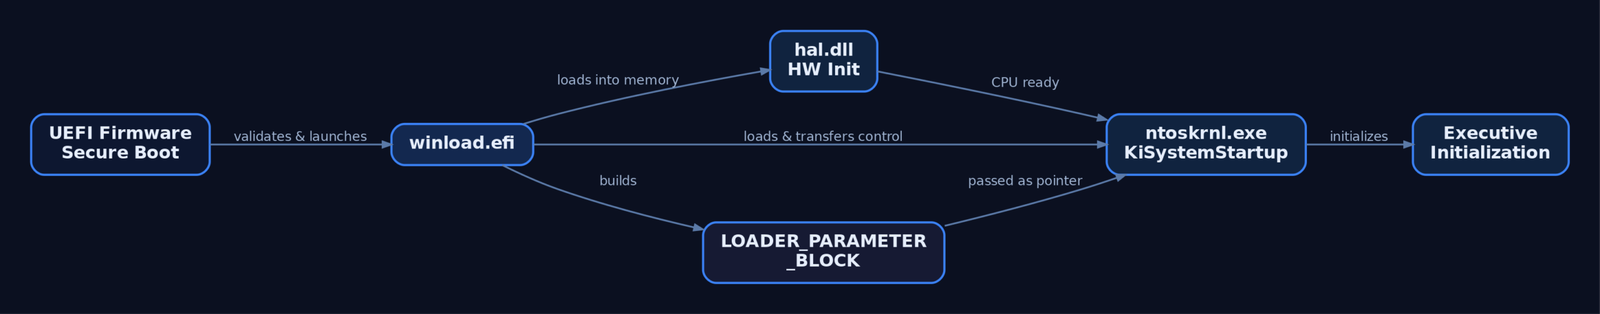
winload.efi loads ntoskrnl.exe and hal.dll into memory, then transfers control to the kernel entry point KiSystemStartup, passing a pointer to a LOADER_PARAMETER_BLOCK. That structure carries the memory descriptor list, the ARC hardware tree, NLS data, and other boot-time state the kernel needs before it can manage its own memory.
winload.efi
  └─ loads ntoskrnl.exe + hal.dll
       └─ ntoskrnl!KiSystemStartup(PLOADER_PARAMETER_BLOCK)
            ├─ HalInitializeProcessor()    ; HAL brings up per-CPU hardware
            ├─ KiInitializeKernel()        ; KPCR/KPRCB, IDT, GDT
            ├─ Executive phase init:
            │    Mm/Ob/Se/Io/Cm/Ps InitSystem()
            └─ PsInitialSystemProcess()    ; System process (PID 4)
                 └─ Phase 1: smss.exe launched
HAL initializes the processor before the Executive runs a single line of policy code. Secure Boot validates the winload.efi → ntoskrnl.exe / hal.dll chain in firmware, so tampering with either binary on disk breaks the boot chain on a properly configured machine.
3. The HAL: Abstracting the Hardware
The HAL translates abstract requests into platform-specific operations: programming the APIC, translating bus-relative addresses, allocating DMA-coherent buffers, and calibrating the stall timer. Drivers and the kernel call HAL routines instead of touching hardware registers directly.
| Routine | Purpose |
|---|---|
HalGetInterruptVector | Translate a bus IRQ to a system interrupt vector and required IRQL |
HalTranslateBusAddress | Convert a bus-relative address to a logical address |
HalAllocateCommonBuffer | Allocate DMA-coherent memory visible to CPU and device |
KeStallExecutionProcessor | Calibrated busy-wait (HAL-implemented on most platforms) |
HalRequestSoftwareInterrupt | Request a software interrupt at a given IRQL to trigger DPC delivery |
On modern ACPI systems the HAL is far thinner than in the NT 4 era. Many classic Hal* exports such as HalGetInterruptVector are deprecated; the PnP/ACPI stack and IoConnectInterruptEx now handle interrupt wiring. Since Windows 8, HAL Extensions (halextpcat.dll, halextintc.dll, and similar PE images loaded by HAL itself) carry SoC- and OEM-specific code without replacing the whole HAL.
4. IRQL: The Kernel’s Preemption Ladder
Interrupt Request Level (IRQL) is the central arbitration mechanism shared by HAL and the kernel. The HAL programs the interrupt controller to enforce IRQL in hardware; running at an IRQL masks all interrupts at or below that level on the current CPU.
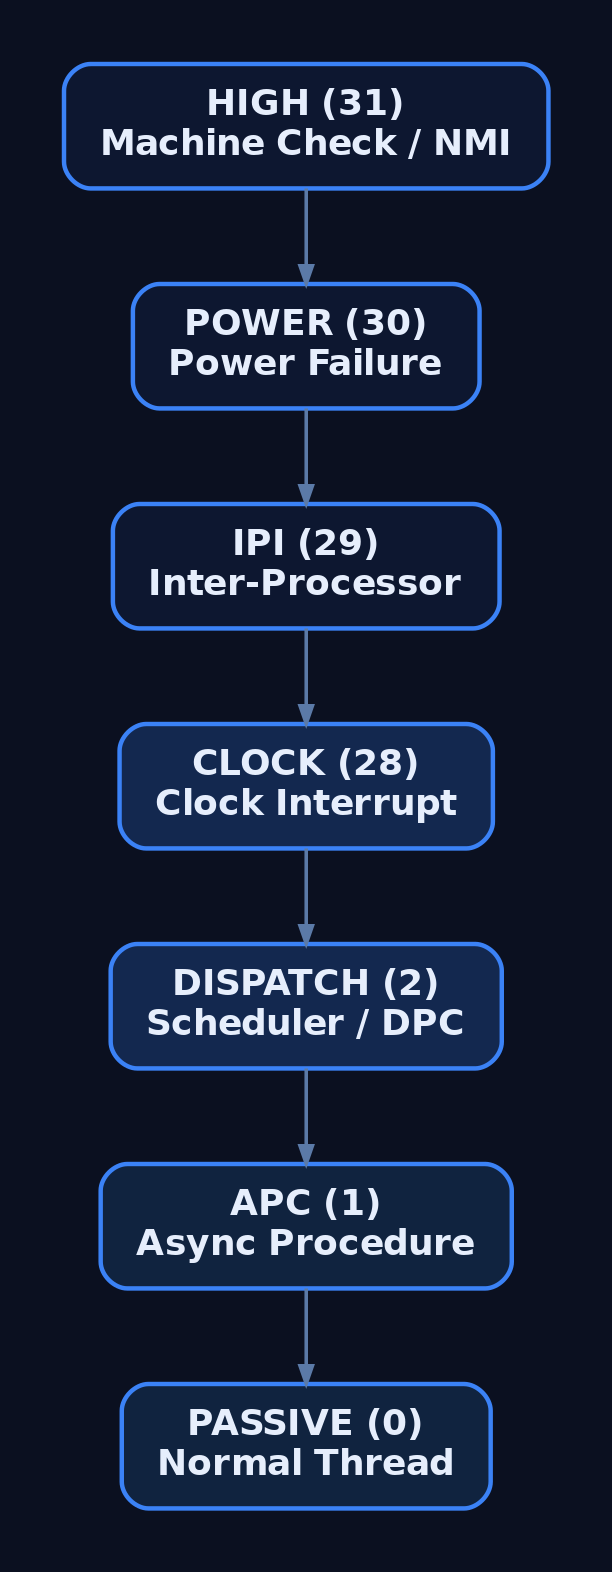
| IRQL (x64) | Symbolic name | Used for |
|---|---|---|
| 0 | PASSIVE_LEVEL | Normal thread execution |
| 1 | APC_LEVEL | APC delivery; paging allowed |
| 2 | DISPATCH_LEVEL | Scheduler, spin locks; no paging, no blocking |
| 3–12 | Device IRQLs | Hardware ISRs |
| 13 | CLOCK_LEVEL | Clock interrupt |
| 14 | PROFILE_LEVEL | Profiling interrupt |
| 15 | HIGH_LEVEL | NMI, machine check |
The cardinal rule: at DISPATCH_LEVEL or above you may not touch pageable memory or block, because the scheduler and page fault handler cannot run. A driver that dereferences paged-out memory at elevated IRQL produces the classic IRQL_NOT_LESS_OR_EQUAL bug check. Query the current level with KeGetCurrentIrql(). IRQL numeric values are architecture-specific; the table above is the canonical x64 mapping.
5. The Kernel Layer (Ke): Scheduling and Synchronization
The Ke layer sits directly above HAL and implements thread scheduling, interrupt and exception dispatch, and the low-level synchronization primitives the rest of the system depends on.
| Routine | What it does |
|---|---|
KeInitializeSpinLock | Initialize a spin-lock object |
KeAcquireSpinLock | Raise IRQL to DISPATCH_LEVEL and acquire the lock |
KeReleaseSpinLock | Release the lock and restore the saved IRQL |
KeInsertQueueDpc | Queue a Deferred Procedure Call |
KeWaitForSingleObject | Wait on a dispatcher object (event, mutex, timer, thread) |
KeSetEvent | Set a kernel event to the signaled state |
Dispatcher objects — events, mutexes, semaphores, timers, threads — share a common DISPATCHER_HEADER carrying Type, SignalState, and WaitListHead. The wait machinery keys off that header. The synchronization pattern below runs at PASSIVE_LEVEL, where blocking is legal:
KEVENT readyEvent;
KeInitializeEvent(&readyEvent, NotificationEvent, FALSE);

// ... another thread eventually calls KeSetEvent(&readyEvent, IO_NO_INCREMENT, FALSE);

NTSTATUS status = KeWaitForSingleObject(
    &readyEvent,        // dispatcher object
    Executive,          // wait reason
    KernelMode,         // processor mode
    FALSE,              // non-alertable
    NULL);              // no timeout
Per-CPU scheduler state lives in the KPCR (Kernel Processor Control Region), reachable via gs:[0] on x64, with an embedded KPRCB holding CurrentThread, NextThread, IdleThread, and the DPC queue.
6. The Executive Layer (Ex and Friends)
The Executive comprises the higher-level managers, each identified by a two-letter prefix. They build on Ke primitives and HAL services.
| Manager | Prefix | Responsibilities |
|---|---|---|
| Object Manager | Ob | Object lifecycle, handles, reference counting |
| Process/Thread Manager | Ps | EPROCESS/ETHREAD creation and teardown |
| Memory Manager | Mm | VAD trees, PTEs, page faults, pool |
| I/O Manager | Io | IRP lifecycle, driver loading |
| Security Reference Monitor | Se | Access checks, tokens, privileges |
| Configuration Manager | Cm | Registry hive management |
| Executive Support | Ex | Pool allocation, lookaside lists, callbacks |
Correct pool usage on modern Windows uses ExAllocatePool2 (the successor to ExAllocatePoolWithTag, deprecated starting Windows 10 build 19041) paired with ExFreePoolWithTag:
// Allocate non-paged pool with a 4-byte tag (read in WinDbg as 'XgAT').
PVOID buffer = ExAllocatePool2(POOL_FLAG_NON_PAGED, 0x1000, 'TAgX');
if (buffer != NULL) {
    // ... use buffer at IRQL <= DISPATCH_LEVEL ...
    ExFreePoolWithTag(buffer, 'TAgX');
}
The Object Manager exposes ObReferenceObjectByHandle to convert a handle into a referenced kernel object pointer — the gateway every component crosses when validating access.
7. Key Kernel Structures
A handful of structures are the backbone of process, thread, and CPU state. Defenders and rootkit authors alike walk these every day.
| Structure | Key fields |
|---|---|
EPROCESS | UniqueProcessId, ActiveProcessLinks, Token, VadRoot, Peb, ImageFileName[15], ThreadListHead |
ETHREAD | Cid (CLIENT_ID), ThreadListEntry, Win32StartAddress, embedded KTHREAD |
KTHREAD | Header (DISPATCHER_HEADER), KernelStack, State, WaitIrql, Teb |
KPCR | Per-CPU; IRQL, IDT/GDT pointers, pointer to KPRCB |
KPRCB | CurrentThread, NextThread, IdleThread, DPC queue |
KDPC | DeferredRoutine, DeferredContext, DpcListEntry |
ActiveProcessLinks is a doubly linked LIST_ENTRY chaining every EPROCESS. The Task Manager view of “all processes” is, at bottom, a walk of this list. That makes it a prime DKOM target: unlinking an EPROCESS hides the process from list-based enumeration while it continues to run and be scheduled — covered in Section 10.
8. The SSDT and System Call Dispatch
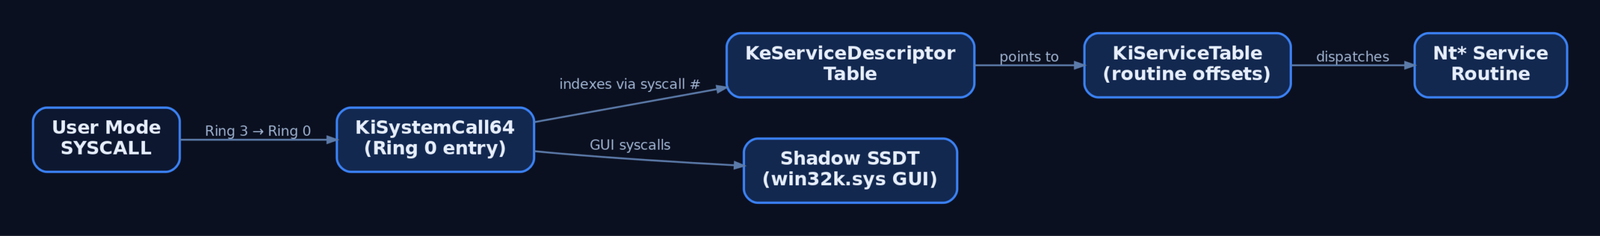
A user-mode SYSCALL instruction transfers Ring 3 → Ring 0 and lands in ntoskrnl!KiSystemCall64. The dispatcher indexes the System Service Dispatch Table via KeServiceDescriptorTable, which points at KiServiceTable (an array of service routine offsets) and KiArgumentTable (argument byte counts). GUI calls into win32k.sys route through the shadow table KeServiceDescriptorTableShadow.
Patching KiServiceTable so a service index points at attacker code is the classic SSDT hook, historically used by rootkits to intercept NtQuerySystemInformation, NtOpenProcess, and similar. On x64 this is exactly the kind of structure modification PatchGuard validates, so SSDT hooking is loud and largely obsolete on modern systems — but understanding the dispatch path is essential for reading both live disassembly and integrity-check telemetry.
9. Live Analysis with WinDbg and Volatility
Load Microsoft symbols and the entire layout becomes navigable. List the core modules and dump structures directly:
0: kd> lm m nt              ; ntoskrnl base, range, symbols
0: kd> lm m hal             ; hal.dll base and range
0: kd> dt nt!_EPROCESS      ; full EPROCESS field layout
0: kd> !process 0 0         ; enumerate processes via ActiveProcessLinks
0: kd> !pcr 0               ; KPCR for CPU 0
0: kd> !prcb 0              ; KPRCB: CurrentThread / IdleThread
0: kd> dps nt!KeServiceDescriptorTable   ; SSDT pointer + service count
0: kd> !idt                 ; IDT vectors (HAL-programmed interrupt routing)
For dead-box memory forensics, Volatility 3 reconstructs the same view from a dump and is the natural cross-check against a possibly compromised live host:
# Enumerate processes and loaded kernel modules from a memory image.
vol -f memory.dmp windows.pslist
vol -f memory.dmp windows.modules

# psscan walks pool tags instead of ActiveProcessLinks; a process that
# appears in psscan but NOT in pslist is a candidate DKOM-unlinked process.
vol -f memory.dmp windows.psscan
A delta between windows.pslist (list-based) and windows.psscan (pool-scan-based) is a high-fidelity indicator of ActiveProcessLinks tampering.
10. Common Attacker Techniques
Kernel-core abuse turns on either modifying ntoskrnl structures from a loaded driver or exploiting a vulnerability to reach Ring 0 in the first place.
| Technique | Description |
|---|---|
| SSDT hooking | Patch KiServiceTable entries to intercept syscalls |
| DKOM unlinking | Splice an EPROCESS out of ActiveProcessLinks to hide a process |
| Kernel callback removal | Strip PsSetCreateProcessNotifyRoutine entries to blind EDR |
| BYOVD | Load a vulnerable signed driver to gain a Ring 0 primitive |
| Kernel exploitation | Abuse an ntoskrnl/HAL bug to escalate Ring 3 → Ring 0 |
| In-memory image patch | Patch ntoskrnl.exe code pages at runtime |
A malicious driver is still loaded through the documented path — a Services registry key of Type = 1 followed by a load — which is exactly where detection begins. Bring-Your-Own-Vulnerable-Driver remains popular precisely because it sidesteps the need to find a fresh kernel bug.
11. Defensive Strategies & Detection
Detection centers on driver loads, integrity events, and kernel structure cross-checks.
| Sysmon Event ID | Name | Relevance |
|---|---|---|
6 | Driver Loaded | Kernel driver load with Signed, Hashes, Signature fields |
7 | Image Loaded | Module loads in unusual contexts |
13 | Registry Value Set | New Services driver entries |
Pair Sysmon with Windows event sources: System Event ID 7045 (new kernel-mode service installed), Security Event ID 5038 (image hash invalid — DSE failure), and Event ID 6281 (page hash mismatch). The Microsoft-Windows-Kernel-Memory ETW provider surfaces pool allocations useful for hunting pool-based implants.
title: Suspicious Unsigned Kernel Driver Load
logsource:
  product: windows
  service: sysmon
detection:
  selection:
    EventID: 6
    Signed: 'false'
  filter_legit:
    ImageLoaded|startswith:
      - 'C:\Windows\System32\drivers\'
      - 'C:\Windows\System32\DriverStore\'
  condition: selection and not filter_legit
level: high| Mechanism | Description |
|---|---|
| PatchGuard (KPP) | Validates SSDT, IDT, GDT, KPCR, and kernel code; bug check 0x109 on tampering |
| Driver Signature Enforcement | ci.dll requires Authenticode-signed drivers |
| HVCI | VTL1 enforces signed Ring 0 code; blunts BYOVD and runtime patching |
| Secure Boot | Validates the winload → ntoskrnl/hal chain in firmware |
Operational hardening: enable HVCI (Core Isolation → Memory Integrity), confirm Secure Boot in msinfo32, audit SeLoadDriverPrivilege use, deploy the Microsoft Vulnerable Driver Blocklist (DriverSiPolicy.p7b), monitor HKLM\SYSTEM\CurrentControlSet\Services\ for new Type = 1 entries, and baseline loaded-module hashes against periodic WinPmem/Volatility snapshots.
12. MITRE ATT&CK Mapping
| Technique | MITRE ID | Detection |
|---|---|---|
| Rootkit | T1014 | Volatility pslist/psscan delta; PatchGuard bug check 0x109 |
| Kernel Modules and Extensions | T1547.006 | Sysmon EID 6; Event ID 7045; Services key writes |
| Exploitation for Privilege Escalation | T1068 | Crash telemetry, anomalous Ring 0 transitions |
| Impair Defenses | T1562.001 | Missing kernel callbacks; EDR self-protection alerts |
| Process Injection | T1055 | Kernel KeStackAttachProcess/MmCopyVirtualMemory use |
| Modify System Image | T1601.001 | Code integrity Event ID 5038/6281; PatchGuard |
13. Tools for Kernel Analysis
| Tool | Description | Link |
|---|---|---|
| WinDbg | Live and dump kernel debugging, structure walks | microsoft.com |
| Volatility 3 | Memory forensics, pslist/psscan/modules | volatilityfoundation.org |
| WinPmem | Live memory acquisition | github.com |
| Process Hacker | Driver and handle inspection | processhacker.sourceforge.io |
| Sysmon | Driver-load and registry telemetry | sysinternals.com |
| sigcheck | Image signature and hash verification | sysinternals.com |
| Ghidra | Static analysis of drivers and ntoskrnl | ghidra-sre.org |
14. Summary
- HAL and ntoskrnl are the two Ring 0 binaries every other Windows component is built on — HAL abstracts hardware, ntoskrnl implements the kernel and Executive policy layers.
- The kernel layer (
Ke) supplies scheduling and synchronization; the Executive (Ob,Ps,Mm,Io,Se,Cm,Ex) builds managers on top, all arbitrated by IRQL that the HAL enforces in hardware. - Core structures —
EPROCESS,ETHREAD,KPCR, the SSDT — are the backbone of process and CPU state and the prime targets for SSDT hooks, DKOM unlinking, and callback removal. - Detect kernel tampering via Sysmon Event ID
6, Event IDs7045/5038/6281, and Volatility pslist-vs-psscan deltas; prevent it with HVCI, DSE, Secure Boot, and the vulnerable-driver blocklist.
Related Tutorials
- Access Tokens and Privileges: The Kernel’s Security Context
- System Calls and SSDT: How User Mode Reaches the Kernel
- User Mode vs Kernel Mode: Privilege Rings and the Boundary
- SIDs and Security Descriptors: Identity in Windows Security
- Fibers: User-Mode Cooperative Threads
References
- Windows Kernel-Mode HAL Library – Microsoft Learn (Windows Drivers)
- Windows Kernel-Mode Kernel Library – Microsoft Learn (Windows Drivers)
- Overview of Windows Components (Kernel-Mode) – Microsoft Learn
- User Mode and Kernel Mode – Microsoft Learn (Windows Drivers)
- Boot or Logon Autostart Execution: Kernel Modules and Extensions (T1547.006) – MITRE ATT&CK
- Deeper into Windows Architecture (HAL, ntoskrnl, Executive) – Microsoft Learn Archive